
ABSTRACT
In 2015, the UN adopted a new set of Sustainable Development Goals (SDGs) to eradicate poverty, establish socioeconomic inclusion and protect the environment. Critical voices such as the International Council for Science (ICSU), however, have expressed concerns about the potential incompatibility of the SDGs, specifically the incompatibility of socio-economic development and environmental sustainability. In this paper, we test, quantify and model the alleged inconsistency of SDGs. Our analyses show which SDGs are consistent and which are conflicting. We measure the extent of inconsistency and conclude that the SDG agenda will fail as a whole if we continue with business as usual. We further explore the nature of the inconsistencies using dynamical systems models, which reveal that the focus on economic growth and consumption as a means for development underlies the inconsistency. Our models also show that there are factors which can contribute to development (health programmes, government investment) on the one hand and ecological sustainability (renewable energy) on the other, without triggering the conflict between incompatible SDGs.
Introduction
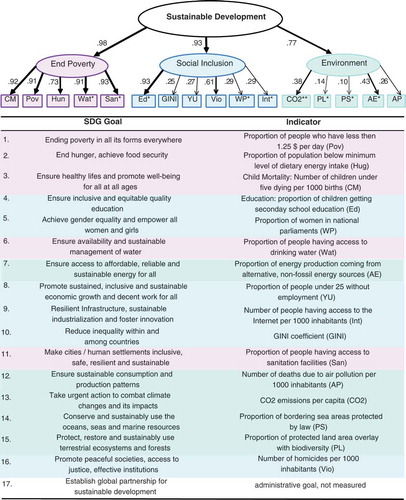
The concept of sustainable development was conceived in 1987 by the Brundtland Commission as ‘development that meets the needs of the present without compromising the ability of future generations to meet their own needs’ (World Commission on Environment and Development Citation1987). Since then, it has been repeatedly challenged with the argument that economic growth is not sustainable because it is accompanied by a depletion of natural resources and deterioration of environmental service (Repetto et al. Citation1989; Pearce & Atkinson Citation1993; Hamilton & Clemens Citation1999). Redclift (Citation2005) even called sustainable development an oxymoron that disguises the inherent conflict of human and natural systems. And Dasgupta (Citation2013) noted that ‘the entire architecture of contemporary development thinking is stacked against nature’ (p.2). Despite this challenge not being sufficiently addressed, the world now prepares to take up the ambitious Sustainable Development Goals (SDGs). The SDGs go beyond the earlier Millennium Development Goals (MDG) programme in that, as well as addressing extreme poverty, they also focus on socio-economic inclusion and ecological sustainability. Seventeen SDG goals () have been defined by the UN for the next 15 years, with both developing and developed countries held accountable for meeting the goals (Leadership Council of the Sustainable Development Solutions Network Citation2015; United National Department of Economic and Social Affairs Citation2015).
Figure 1. CFA Results. The factors are shown in ellipses, while the observed indicators in rectangles. The numbers above the arrows are standardized factor loadings. *Variables were reverse coded to ensure a common directionality of all observed indicators. **1/CO2. Model Fits: CFI: 0.91, TLI: 0.89, SRMR: 0.08, RMSEA: 0.06. Full colour available online.
The International Council for Science (ICSU) reviewed the SDGs and criticized ‘that the framework as a whole might not be internally consistent – and as a result not be sustainable’, if interlinkages, complex dynamics and conflicting relations between the goals are ignored (International Council for Science and International Social Science Council Citation2015, p.9). The conflict between ecological sustainability and socio-economic progression is of particular concern to the ICSU. However, the ICSU does not provide empirical evidence for its concerns. In fact, little is known about the nature and extent of the repeatedly claimed incompatibility of sustainability and development (Stern et al. Citation1996; Redclift Citation2002, Citation2005; Luke Citation2005; Saboori & Sulaiman Citation2013; Brown Citation2015).
The aim of this study is to use the increasing amount of data available on development (Leadership Council of the Sustainable Development Solutions Network Citation2015) to investigate potential contradictions in the SDGs. We compiled an extensive, cross-country time series data set, including data from the World Bank, Polity IV, CIRI Human Rights Data Project, Freedom House and the Heritage Foundation/the Wall Street Journal. The compiled data set consists of 1,423 economic, social, environmental and political indicators for 217 countries, covering the period 1980–2014 (see Supplementary Information S1 Data). We first applied Confirmatory and Exploratory Factor Analyses (Reinecke Citation2005; Harrington Citation2008) to test and quantify the (in)consistency of the SDGs. To then understand the dynamics and mechanisms of sustainable development inconsistencies, we use a Feature Selection Algorithm (Guyon & Elissee Citation2003; Mehmood et al. Citation2012) to preselect best predictors for sustainable development from the large set of potential predictors and then fit dynamical systems models (Ranganathan et al. Citation2014) with the pre-selected predictors. Finally we suggest how the resulting dynamical systems models can be used to monitor sustainable development.
Data and methods
To test, quantify and model the alleged inconsistency of the SDGs, we used data from various sources. First, we downloaded all the data provided by the World Bank for the period 1980–2014, through the World Bank Data API. This includes all World Development Indicators (WDI), African development Indicators (ADI), International Debt Statistics, MDG data, Education Statistics, Gender Statistics, Health, Nutrition and Population Statistics, Worldwide Governance Indicators (WGI), Climate Change data, Global Financial Development data, Doing Business data, Enterprise Surveys data, Poverty and Equity Database, The Changing Wealth of Nations data, International Labour Organization (ILO) data and International Development Association (IDA) Results Measurement System (see Supplementary Information S1 Data) (World Bank Development Data Group Citation2014). To this World Bank data set, we added data sets from Polity IV containing measures on democracy vs. autocracy and regime durability (Marshall et al. Citation2014), CIRI Human Rights Data Project containing various human rights indices (Cingranelli et al. Citation2013), Centre for Systemic Peace data containing data on conflicts (interstate wars, civil wars, etc.), state fragility, governance and immigration (compiled by Marshall Citation2014), the Freedom House data containing the indices for political and civil rights as well as freedom of press (Freedom House Citation2014a, Citation2014b) and the Heritage Foundation/Wall Street Journal data containing measures on economic freedom such as property rights, freedom from corruption, fiscal freedom, government spending, business freedom, labour freedom, trade freedom, investment freedom and financial freedom (Miller et al. Citation2014). Please see Supplementary Information S1 Data for further details on the data set.
We first applied Confirmatory and Exploratory Factor Analyses to test and quantify the inconsistency of the SDGs. A Confirmatory Factor Analysis (CFA) is a special case of a covariance-based structural equation model. It is used to test the consistency of theoretical or generally abstract constructs. Sustainable development, for instance, is a construct that is rather programmatic, theoretical and not directly observable or measurable. Given a direct measurement of sustainable development is not possible, observable variables are used as multiple indicators and in composition they measure the abstract (latent) construct. Thus, if we want to test the consistency of the SDGs framework, a CFA can help us to understand to what extent data support the SDG construct as a whole. The CFA can be hierarchical involving first- and second-order latent constructs. The SDGs, for instance, are constructed hierarchically, with three pillars, ‘Ending Poverty’, ‘Social Inclusion’ and ‘Environment’ that build the first-order latent factors, while ‘Sustainable Development’ represents the second-order latent factor. The observable indicators, suggested by the UN (Leadership Council of the Sustainable Development Solutions Network Citation2015), construct the first-order latent factors and these first-order latent factors then construct the second-order factors (see ). Standardized factor loadings (ranging from −1 to 1), which are interpreted similarly to correlation coefficients and Z-scores, which describe the relation between the estimated value (factor loading) and its standard error, are used to evaluate the contribution of the measured indicators to the latent factor. Model indices such as the Root Mean Square Error of Approximation (RMSEA), the Standardized Root Mean Square Residual (SRMR), Comparative Fit Index (CFI), Tucker-Lewis Index (TLI) are used to assess the overall goodness of the CFA model (Reinecke Citation2005; Harrington Citation2008) (see Supplementary Information S2.1 for further details).
An Exploratory Factor Analysis (EFA) is the explorative version of a CFA, used to test whether the correlation structure of the observed variables allows the extraction of one or several factors, and thus, to what extent the observed variables can be predicted by one or several latent factors (Thompson Citation2004). EFAs are therefore used if the theoretical or abstract construct is not explicitly known but assumed. The data are then used to extract the assumed latent, thus not directly measurable, abstract phenomenon. If the CFA, for instance, fails to confirm a theoretical construct empirically, say our CFA would reveal that the SDG framework envisioned by the UN is not consistent with the data, then an EFA can be used to find an alternative latent structure, thus an alternative SDG framework. Similar to a CFA, standardized factor loadings and Z-scores are used to evaluate the contribution of the observable variables to the latent factor. The goodness of the EFA-extracted latent factor model is subsequently tested with a CFA approach (see Supplementary Information S2.1 for further details). Thus, the CFA and EFA provide methodological means to detect inconsistencies and incompatibilities in abstract, theoretical constructs such as the SDGs.
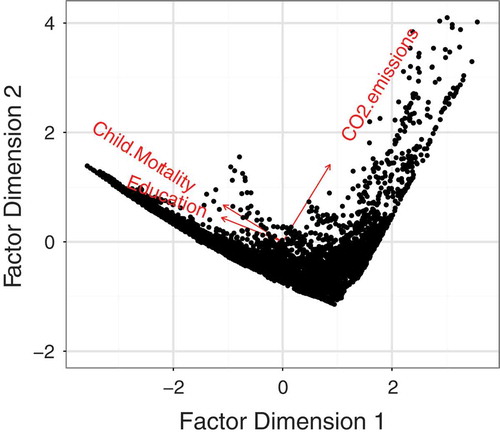
Once a consistent latent factor structure is extracted and confirmed, factor scores can be used to generate a latent variable, i.e. the abstract construct becomes quantifiable and can then be used in further quantitative analyses, for example, in dynamic systems models (see below). Typically, factor scores are linear combinations of the observed variables based on the shared variance between the observed variable and the factor (latent variable) and the variance that is not measured (DiStefano & Mîndrilă Citation2009). We used this approach to create the latent variable L, which consists of the three observable variables Child Mortality, Education (reverse coded, see Supplementary Information S1.1) and CO2 emissions per capita (see after next section for justification of the three chosen variables). Thus, L is essentially a composite index of those three variables, but instead of simply adding the values of the three variables disregarding their covariance and unobserved variance, an equation, similar to the regression equation, is used to calculate the index value (see Supplementary Information S2.1 for further details).
Given our CFA- and EFA-based analyses do reveal inconsistencies and incompatibilities in the SDG framework (see next section), we undertook further analyses to understand the dynamics and mechanisms of sustainable development inconsistencies. Dynamical systems models (Ranganathan et al. Citation2014) are mathematical models that can help us to understand potentially non-linear, coupling and feedback effects and dynamics in social change. They can further our comprehension of what drives sustainable development, including its inconsistencies. However, given our data contain a large set of potential predictors to be included in the model, we first had to find a way to identify the relevant predictors. For that purpose, we used a Feature Selection Algorithm (Guyon & Elissee Citation2003; Mehmood et al. Citation2012) to preselect best predictors for sustainable development from the large set of potential predictors. Specifically, we used the Variable Elimination Algorithm (Mehmood et al. Citation2012), a supervised feature selection machine learning method based on partial least squares regression. The uninformative variable elimination is a wrapper method, based on procedures iterating between model fitting and variable selection. The search algorithm extracts a subset of relevant variables and evaluates each subset by fitting a model. The variables can then be ranked based on an estimated relevance measure (see Supplementary Information S2.2 for further details).
Finally, we fitted dynamical systems models with the pre-selected predictors. Pursuing a data-driven approach, the goal was to derive from the data a mathematical model for changes in L that would further our understanding of what drives sustainable development and its inconsistencies. We thus used the data to inform model selection from a large pool of potential models by fitting polynomial differential equations that are capable of capturing various linear and non-linear dynamical patterns in the data. Specifically, changes in L between times t and t + 1 were modelled as a function of all possible combinations of numerous pre-defined polynomial terms involving the pre-selected predictors at time t with varying complexity (number of polynomial terms included in the model). Bayesian model selection as outlined in Ranganathan et al. (Citation2014) was used to identify the overall best-fitting model. Please see the Supplementary Information S2.3 for further details on our methodological approach.
Testing the consistency of sustainable development
We tested the consistency of the SDGs using the CFA approach (described in previous section). The UN SDG concept suggests a hierarchical latent structure. The first-order factors represent the three main pillars of the SDGs: to end poverty, ensure socio-economic inclusion and protect the environment. The second-order, overarching factor represents sustainable development (Leadership Council of the Sustainable Development Solutions Network Citation2015; United National Department of Economic and Social Affairs Citation2015). Each of the three main pillars further break down into 16 goals (plus the 17th administrative goal) which can be related to specific indicators identified by the UN (Leadership Council of the Sustainable Development Solutions Network Citation2015) (see and Supplementary Information S1 Data).
shows that the ‘End Poverty’ pillar appears to be a valid latent construct with good indicators. The ‘Social Inclusion’ factor, however, is much weaker in its validity, with some indicators like Education representing the latent construct quite well and others like the GINI coefficient having low factor loadings. The ‘Environment’ factor is particularly poorly defined and incoherent. There seems to be only a weak relation between the various environment indicators.
A Principal Component Analysis (PCA) further emphasizes the inconsistencies of the SDG framework (see )). Three of the Environment goals – CO2 emissions, Protected Land and Protected Sea – load in the opposite direction on the first factor dimension than the poverty-and social inclusion-related goals. An EFA then suggests a model that departs considerably from the original SDG concept (see )). A ‘Development’ factor is extracted that represents development in classical terms, i.e. reducing poverty and fostering socio-economic inclusion. Within the Development factor, the CO2 emissions indicator has a negative loading, suggesting an inherent conflict between classic development and ecological sustainability. The other Environment indicator, Air Pollution, loads positively to the Development factor, but with a weak factor loading. All the other indicators from the Environment pillar and two from the Social Inclusion pillar (Youth Unemployment and Women Parliament) were dropped by the EFA, which suggests that they are neither related with Development nor with each other, as they do not build a factor on their own.
Figure 2. (a) PCA Factor Map of 16 SDG indicators with Factor Dimension 1 having a proportion of explained variance of 37.3% and Factor Dimension 2 of 11.6%. The axes depict standardized factor loadings. The colour shows the contribution of each indicator to the factor solution: indicators in red contribute strongly, those in blue weakly. (b) EFA Results. The factors are shown in ellipses, while the observed indicators in rectangles (colours as in ). The numbers above the arrows are standardized factor loadings. *Variables were reverse coded. CFA Model Fits for the EFA model: CFI: 0.96, TLI: 0.95, SRMR: 0.06, RMSEA: 0.06. Full colour available online.
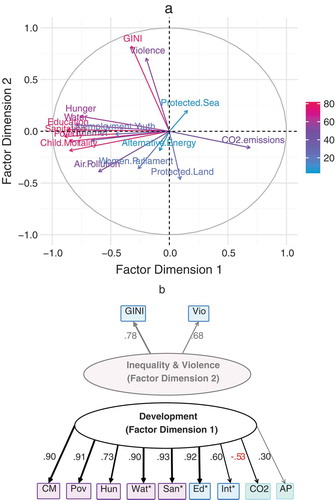
The EFA gives a second factor of ‘Inequality and Violence’, which shows that inequality measured by the GINI coefficient is related to Violence. Galtung and Hoeivik (Citation1971) suggest that ‘direct violence’ has roots in ‘structural violence’, i.e. in injustice, exploitation and extreme inequality that stunts disadvantaged peoples’ ability to develop their human potential. Our EFA supports this theory, and identifies Violence and inequality (GINI) as lying together on a separate dimension to the other developmental goals.
Modelling the inconsistency of sustainable development
The factor analyses results suggest that SDGs will be difficult to attain if we continue with the development model that most countries have adopted in the past. However, the analyses do not reveal what the major problems are in obtaining sustainable development. To investigate this in more detail, we first chose one indicator for each of the three SDG pillars to create a latent variable, L, representing the inconsistent development. To represent each pillar, we chose those indicators with the highest EFA/CFA loadings and best available data, namely Child Mortality, Education and CO2 emissions. We then performed a new CFA on these three variables (see ) and used the CFA factor scores to create the latent variable L (see Supplementary Information S2 Methods).
Figure 3. EFA-Biplot with Factor Dimension 1 having a proportion of explained variance of 73.5% and Factor Dimension 2 of 21.1%. The EFA suggests a single factor solution. A CFA for this factor, L, comprising CO2 emissions (factor loading: −0.53), Child Mortality (factor loading: 0.82) and Education (reverse coded, factor loading: 0.98) has good Model Fits: CFI: 0.97, TLI: 0.93, RMSEA: 0.03 and SRMR: 0.06.
We then applied a Feature Selection Algorithm (see Supplementary Information S2.2) to scan through the large number of potential indicators in our data set to find the 12 most relevant predictors for changes in the latent variable L (see Supplementary Information S3 Results, Table S1). These 12 indicators were then used to fit a dynamical system model (see Supplementary Information S2 Methods) for changes in L. The best model, according to the Bayes Factor (see Supplementary Information S3 Results, Table S2), for rate of change of L is:
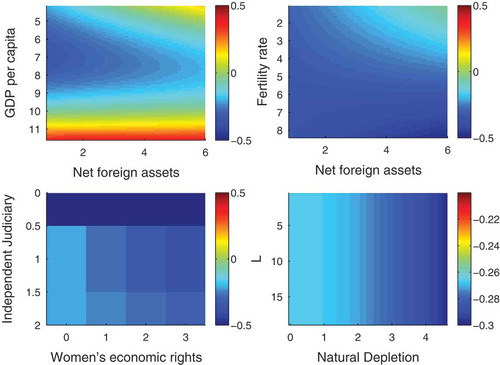
The Equation (1) terms reveal what factors are associated with development. The effects captured in the equation terms are moreover visualized in . Note that a negative value of Equation (1) implies a decrease in Child Mortality and in the proportion of people without secondary school education, but an increase in CO2 emissions. Conversely, a positive value of Equation (1) has the opposite implication. The first term indicates that high debts (D/G is the ratio net foreign assets, D, to log GDP per capita, G) prevent a reduction in L, with high indebtedness being particularly detrimental to socio-economic development if countries are poor. The second and third terms indicate that countries with larger gross domestic product (GDP) reduce L faster (see ), but this effect is cancelled out as the economy reaches the size of a modern Western economy (i.e. approximately G = 10). This is further exacerbated when debts are high. Thus, economic growth and low indebtedness reduce poverty and facilitate socio-economic inclusion but simultaneously harm the environment.
Figure 4. Heat map panels for effects in Equation (1). Bluish colours indicate a reduction in L and reddish colours indicate an increase. The first panel shows the non-linear interactive effect of log GDP per capita and net foreign assets on L with other indicators kept at mean. The second panel shows the interactive effect of fertility rate and net foreign assets (term four in Equation (1)) with other indicators kept at mean. The third panel shows the beneficial effect of women’s economic rights on development and the forth panel shows that development is coming at natural depletion costs. Full colour available online.
It may be objected that GDP per capita plays such a prominent role in the Equation (1), given it is usually heavily criticized for its inadequacy to measure social welfare, human betterment and genuine progress not to mention its complete neglect of environmental costs (van den Bergh 2007). We do agree with the criticism put forward against GDP as an indicator, nevertheless, the indicator was picked by our feature selection and modelling/model selection algorithm as an important predictor, most likely as a substitute for better measures of economic progress that are currently not available.
The fourth term in Equation (1) arises because poor countries (i.e. with high indebtedness, D, and high fertility rates, Fr) have a general tendency to make progress in terms of socio-economic development, while environmental depletion tends to increase. The fifth term reflects that women’s economic rights, Rf, is positively associated with socio-economic development, particularly in countries with weak judicial institutions, J. The last term shows that L decreases as an accelerating function of natural depletion costs, Nd.
To sift out the reasons for sustainable development inconsistencies, we then investigated the indicators associated with changes in the three SDG pillars: Child Mortality, Education and CO2 emissions (see Supplementary Information S3 Results, Table S2). We found that decreases in Child Mortality are best predicted by
The first term shows that a combination of high log GDP, G, and trade freedom, Tf, is associated with a reduction in Child Mortality. The second and third terms indicate that efficient health programmes such as measles immunization, M, reduce Child Mortality in poor countries. Once countries are rich, common diseases such as measles are mostly eradicated and therefore the positive effect of targeted health programmes ceases. The last term finally implies that poor countries that have typically high fertility rates, Fr, tend generally to develop and therefore to reduce Child Mortality.
Changes in Education were best predicted by
The first and third terms show that higher log GDP per capita, G, and government spending, Wg, predict decreases in the proportion of people without secondary school education. In the second and fourth terms, final consumption expenditure, C, combines with the other two indicators to signify that in rich countries, where the majority has presumably attained secondary education, the reduction ceases.
Finally, changes in CO2 emissions were best predicted by
The equation combines several non-linear terms, involving natural depletion costs (Nd), renewable energy production (Er), log GDP per capita (G), particulate emission damage (Em) and final consumption expenditure (C). The model is highly complex and shows how the various factors interact in various non-linear ways. Combined, these terms show that poor countries have low CO2 emissions, that then rise with growing economy and consumption until countries have reached very high wealth levels, at which point CO2 emissions can be expected to stall, though at this stage the CO2 emissions levels of a country will be already unsustainably high. CO2 emissions are proportional to overall natural depletion costs per unit of energy produced through biomass and they are coupled with particulate emission damage, thus with detrimental effects of environmental pollution on human health.
The four Equations (1-4) provide some explanation for the inconsistency of sustainable development. All models include GDP per capita, which has overall a positive effect on reducing poverty (Equations (1),(2)) and increasing socio-economic inclusion (Equations (1),(3)), but a mainly negative effect on reducing CO2 emissions (Equations (1),(4)). It is the current economic system that is based on growth and consumption (C in Equations (3),(4)) that makes some of the SDGs incompatible. As every nation seeks to increase economic growth to meet the rising standard of living expectations of its population, nature is under-prioritized (Managi & Kaneko Citation2009; Jorgenson Citation2010; Pao & Tsai Citation2010; Redclift Citation2010; Rich Citation2013). The natural capital and ecosystems services framework (Costanza et al. Citation1997), for instance, quantifies the neglected value of ecological services and discusses the potentially grave effects on future human welfare if the ecosystems services are not figured in. But our models also reveal factors (indicators unique to Equations (2), (3) and (4)) that have beneficial effects on one goal, without having simultaneously adverse effects on other goals. These include extensive health programmes for reducing Child Mortality, government spending on Education and renewable energy production for reducing CO2 emissions. These results suggest that we should shift our focus from a consumption-based economic growth to investment in human well-being (health, education) and environment-friendly technologies. Indeed, this reflects not only some of the theoretical ideas on sustainable development put forward, for instance, by Dasgupta (Citation2013) (see next section) but also other recent research that suggests that human well-being can be decoupled from GDP per capita and environmental exploitation (Dietz et al. Citation2009; Lamb et al. Citation2014).
One might object that the models do not explicitly take into account technological innovations or new trends and normative changes, which some claim will ensure that climate change and other environmental problems can be addressed in future (Ridley Citation2010; OECD (Citation2011, Citation2013)). The feature selection algorithm and model selection procedure did not pick specific technological indicators from the vast data set as good predictors, except for the renewable energy production (Er) indicator. In fact, the first term in Equation (4) can be interpreted as capturing technological innovation targeted at reducing environmental degradation, i.e. climate change. Capturing overall technological change and its potential (future) contribution to mitigating environmental depletion is however extremely challenging. Arrow et al. (Citation2012), for instance, use time itself in their models on sustainable development to account for effects of time-varying factors such as technological change or new trends and normative changes. However, this approach was widely criticized as inappropriate (Solow Citation2012). We therefore refrained from including time in our models, but the models can be easily extended to include time as a predictor.
Monitoring sustainable development
Given the current socio-economic development ‘is stacked against nature’ as Dasgupta (Citation2013) noted, it will be necessary to develop new development models and agendas; and along with them new measures of sustainable development, progress and nation’s wealth that will help to monitor worldwide sustainable development advances.
One of the most elaborated and comprehensive recent approaches to measure sustainable development and nations’ wealth is the Inclusive Wealth Index. Dasgupta (Citation2010) defines sustainable development in terms of intergenerational well-being, which he tries to capture with the inclusive or comprehensive wealth measure (Arrow et al. Citation2012; Dasgupta Citation2007a). This measure represents a society’s stock of all its capital assets (reproducible /productive capital, human capital and natural capital) and their changes over time accounting for population growth and technological change. These various capital assets form a society’s productive base which is a means to protecting and promoting well-being across the generations. Therefore, economic development is only sustainable, if the change in inclusive wealth over time is positive and is likely to increase in future (ibid.). This is usually the case if consumption per capita does not exceed net domestic product per capita, which is interpreted as GDP per capita minus the depreciation of those capital assets and/or if (government) investment (e.g. in health, preserving ecosystems) is positive (Dasgupta Citation2013). In consequence, sustainable development can involve excessively high rates of (government) investment, which can be a burden on the current generation (ibid.). Dasgupta shows empirically that the Inclusive Wealth Index frequently indicates a decline in intergenerational well-being, while GDP per capita and Human Development Index (HDI) increased (Dasgupta Citation2007a, Citation2007b, Citation2010, Citation2013), demonstrating the unsuitability of these traditional indices for measuring sustainable development. However, Dasgupta’s theoretically elegant approach is currently severely limited by cross-country, time-series data availability issues, particularly when it comes to environmental data (Arrow et al. Citation2012; Dasgupta Citation2013). Moreover, the approach would accept a temporary conflict between different capital assets and thus between socio-economic and environmental development goals as long as the overall sum of the inclusive wealth change remains positive and is expected to grow in future. The expected future increase is however difficult to estimate accurately, particular as the model does not take into account non-linear development dynamics (Spaiser et al. Citation2014; Ranganathan et al. Citation2015b).
We suggest here an alternative, data-driven approach for measuring and monitoring sustainable development, accounting for data availability issues and non-linear dynamics in development processes. First of all, we can use models for single SDG goals, Equations (2-4), to monitor progress of the SDGs separately. These models can then be used to make future predictions about likely development trajectories and potential development traps (Spaiser et al. Citation2014; Ranganathan et al. Citation2015a). For an overall index to monitor sustainable development, we can use the rate of change in our latent variable. The model in Equation (1) is used to calculate scores for each country and year, using country- and year-specific initial values for the predictors in the model (SDG index 1). As such, the resulting index scores represent the expected changes in a country’s development status and thus the expected progress of a country.
Alternatively, an overall index can be constructed directly from the models for the single SDG goals using a Bayesian model combination approach (see Supplementary Information S2.3). Such an approach would result in an alternative model for changes in the latent variable L:
As in the previous model, negative values imply a decrease in Child Mortality and in the proportion of people without secondary school education, but an increase in CO2 emissions. visualises the model predictions. Model terms one and two show that higher log GDP per capita (G) is generally beneficial for socio-economic development until rich countries reach very high GDP levels (along with high consumption expenditure (C) levels) at which point the positive effect ceases. The third and fourth terms reveal that government investment (Wg) is overall a positive factor in lowering poverty and increasing socio-economic inclusion, particularly in emerging countries (middle range in consumption expenditure C). Though, the more developed a country becomes, the higher the government spending needs to be to achieve further socio-economic improvements. In rich countries (high levels of final consumption expenditure C), further improvements in socio-economic development through government spending cannot be achieved according to this model. However, government spending may then contribute to the mitigation of high CO2 emissions. The fifth term indicates that poorer countries (high fertility levels (Fr)) have a general tendency to develop. The sixth term finally shows that the socio-economic development comes at natural depletion costs (Nd). The term is a ratio of natural depletion costs per renewable energy production (Er). As mentioned previously, this term can be interpreted to measure technological progress targeted at reducing environmental degradation. A small ratio, for example, when Er is high, would imply CO2 emissions containment. This alternative model can be used as an alternative overall index to monitor SDGs (SDG index 2).
shows two world maps with countries coloured based on their SDG index scores for 2011. We can see that the two indices do not always make the same predictions about countries’ development. The first SDG index, based on Equation (1), suggests that most counties in the East, such as Russia, China, Kazakhstan, India, as well as some South American (e.g. Mexico), Arabic (e.g. Tunisia) and African (e.g. Mauritania) countries are performing well in reducing poverty and increasing socio-economic inclusion. However, given the incompatibility of the SDGs, this positive development comes along with increasing CO2 emissions. Rich developed countries such as the US, Canada, Australia and the UK have reached already high levels of socio-economic development, thus there is little room for further development. The SDG index rather suggests that poverty and socio-economic exclusion may be rising again in those countries. On the other hand, we would expect that the CO2 emissions will level off or even slightly decrease in those countries in the long run, though on a high unsustainable level. Some South American (e.g. Brazil), Asian (e.g. Thailand) and African (e.g. South Africa) countries on the other hand seem to be stuck with no or only very slow socio-economic development or even some drawback in terms of socio-economic development.
Figure 5. Heat map panels for effects in Equation (5). Bluish colours indicate reduction in L and reddish colours indicate an increase in L. The first panel shows the non-linear interactive effect of log GDP per capita and final consumption expenditure on L with other indicators kept at mean. The second panel displays the non-linear interaction effect of final consumption expenditure and government spending on changes in L. Fertility rate (panel three) is again acting as an indicator for the development level of a county and seems to have a rather weak effect on changes in L. Finally, the fourth panel shows the effect of the ratio of natural depletion costs per renewable energy production. Full colour available online.
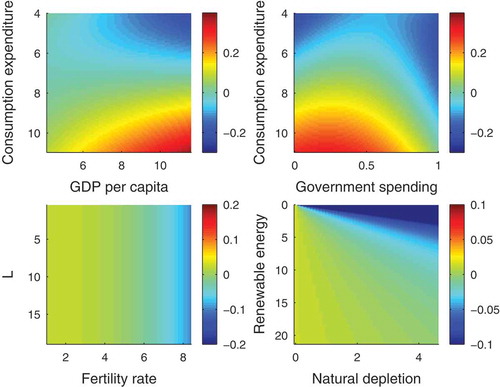
Figure 6. World maps with countries being coloured based on their SDG indices scores in 2011. White colour indicates that an index could not be calculated due to missing data in one or several of the predictors in the two models (1) and (5). (a) shows the index colouring based on Equation (1) and (b) shows the index colouring based on Equation (5). Full colour available online.
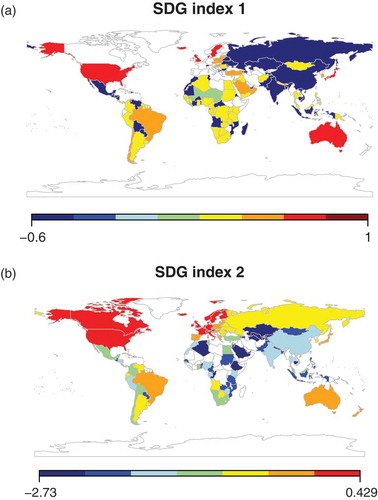
The second SDG index based on Equation (5) suggests similar results for rich, developed countries. But according to the second SDG index, Russia seems to be stuck with no or only very slow socio-economic development. China, India and Kazakhstan on the other hand are again performing rather well in terms of socio-economic development. However, their socio-economic development goes hand in hand with rising CO2 emissions. Moreover, the second index suggests that several African countries (e.g. Angola, Kenya) are not stalling or regressing, as suggested by the first SDG index, but in fact making some progress in terms of socio-economic development.
The differences in the predictions for various countries result from the different conceptualizations of the two models in Equations (1) and (5). The first model assumes a true latent variable with the three components being only some observable indicators for this latent development phenomenon, which ultimately goes beyond those three indicators. Thus, the model seeks to predict changes in this latent variable primarily and not changes in its components. On the other hand, model (5) is much closer to the three components, given it was built from the three original component models. Thus, model (5) would tend to primarily predict changes in the three components and to a lesser extent changes in the true latent variable L.
To decide which SDG index is more suitable for monitoring sustainable development and to compare the performance of our predictive SDG indices with widely used indices of economic development, GDP per capita and HDI, we compared how well these indices are doing in predicting changes in the latent variable L and in its three components, Child Mortality, Education and CO2 emissions. We thus fitted models where the indices would predict changes in the three L components and in L itself and compared the Bayes factors of these models. We did not include a comparison with the Inclusive Wealth Index or other recently suggested development indices such as the Happy Planet Index (Abdallah et al. Citation2012) or Social Progress Index (Porter et al. Citation2013) because these indices are currently available only for 2 or 3 years (and rather recent years) and do not always cover the majority of worlds’ countries. and summarize the evaluation results.
Table 1. Predictive power of the two SDG indices, SDG index 1 is based on model 1 and SDG index 2 is based on model 5 in comparison to HDI and GDP per capita, based on R2.
Figure 7. Bayes factors for models predicting changes in L, Child mortality, Education and CO2 emissions with either SDG index 1, SDG index 2, HDI or GDP per capita as predictors.
Our SDG indices perform better than the common indices for economic development HDI and GDP per capita. Moreover, the SDG index 1 based on Equation (1) seems to be a better predictor for the overall SDG process and for Child Mortality comparing with the SDG index 2 based on Equation (5). But, it performs less well in predicting changes in education and CO2 emissions comparing with the second SDG index. It should be noted that the inherent contradiction between development and sustainability is encoded in Equations (1) and (5) and therefore in the SDG indices. They do not resolve the conflict and remain, therefore, dialectic.
Conclusion
Over the past 30 years, there has been an inherent conflict between socio-economic development and ecological sustainability (Redclift Citation2002, Citation2010; Jorgenson Citation2010; Rich Citation2013). Our results have quantified this inconsistency and showed that economic growth fulfils socio-economic goals while simultaneously hindering environmental goals. On a more positive note, our models identify factors, which can contribute to socio-economic development (health programmes, government spending) on the one hand and ecological sustainability (renewable energy) on the other, without triggering the conflict between incompatible SDGs. The decoupling of the two SDG indicators for Violence and Inequality (see ) offers the possibility that improvement can be made on these goals independent of the other 14 goals.
Nevertheless, our analyses are limited in several ways. First of all, given we suggest here a data-driven approach, data are essential to the validity of our analyses. However, the data we have had access to and used for the analyses is in many ways problematic (see Supplementary Information S1 Data). Frequently, appropriate measures are not available or of low quality (e.g. excessive many missing values, short time series, unclear validity and reliability). Some measures are essentially unusable because they provide too few datapoints and quite often these are potentially the most interesting measures. We thus had to work often with less appropriate data and with proxies. Generally, it is quite evident that while economic data are largely complete, data on environment (with exception of CO2 emissions), equality, social matters, etc. suffers from incompleteness and bad quality. This alone creates a misbalance and bias for all analyses involving these data. Given these data concerns, the models suggested here should be evaluated with caution. They are necessarily preliminary. Nevertheless, it is important to use the data that are available in the best and most effective way to get a better understanding of development and sustainability. Data analyses are useful in monitoring changes. As more reliable development data become available along with the UN ‘data revolution for sustainable development’ (United National Department of Economic and Social Affairs Citation2015), we can both monitor progress towards the SDGs and, by revising our models and indices in light of improved data, develop a deeper understanding of the path which our planet is taking. But it is an ongoing process.
Data-driven approaches are moreover criticized for lacking theoretical foundations. However, with respect to the SDGs, it should be noted that, in fact, the SDGs themselves were criticized for having a very weak if any theoretical foundation (International Council for Science and International Social Science Council Citation2015; Szirmai Citation2015). Moreover, there is no agreement on a comprehensive sustainable development theory, there are different contested theoretical approaches and definitions (Hopwood et al. Citation2005). Consequently it is unclear which theory should guide the study of SDGs. The SDGs provided a list of targets, with no clear priorities and no theory on how these goals can be attained. Two of the SDGs ‘goals’ (Nr. 8 ‘economic growth and productive employment’ and Nr. 9 ‘resilient infrastructure, inclusive and sustainable industrialization and innovation’) are in fact means to achieve development goals rather than goals in their own rights. They were explicitly included as a reaction to the criticism that the SDGs predecessors, MDGs lacked a theoretical foundation of how to achieve development (Szirmai Citation2015). However, this response does not necessarily reflect the most recent theoretical developments in sustainable development research (Hopwood et al. Citation2005; Dasgupta Citation2013; Atkinson et al. Citation2014). We hope however to inspire with our explorative, data-driven approach and the outcomes it generated further thinking on how to link the UN SDGs with existing sustainable development theories.
Finally, we do acknowledge that the SDGs are a future-oriented programme and sustainable development is a long-term process with potentially unforeseen future turns like major technological innovations, for instance, not present in data records. Data analyses show the world as it was in the past and at best at it is in the present, not as it could or will be. (Field-)experimental approaches (Schill et al. Citation2015; Tollefson Citation2015) and scenario analysis, thus theoretically informed examinations of various possible scenarios (Barreto et al. Citation2003; Swart et al. Citation2004; Ostrom Citation2009) are better suited to test ‘alternative worlds’. Other more explorative approaches such as agent-based simulations (Castella et al. Citation2005), participatory observations and focus groups (Cuthill Citation2002) or case studies (Crépin Citation2003; Dearing et al. Citation2014; Duit Citation2014; Guerrero et al. Citation2016), for example, of the Bolivian case, the first country to grant nature equal rights to humans in its constitution (Bolivian Democratic Government Citation2010) could provide insights into alternative development trajectories and transformative potentials. Generally, it is essential to explore solutions and not to wait for a future technological breakthrough. Technological innovations follow incentives and since the environment is constantly underpriced and disregarded in the present economic system, the innovators have little reason to develop technologies that focus on reducing environmental depreciation (Dasgupta & Ehrlich Citation2013). Moreover, historical evidence suggests that successful technological response cannot be guaranteed (ibid.). We thus have to try and find responses to the incompatibility of economic development and environmental sustainability within our present capabilities. And for that purpose, we need to understand what was prohibiting us so far from a more sustainable development and here data analyses along with other analytic approaches can help.
SupplInf.pdf
Download PDF (109.6 KB)Disclosure statement
No potential conflict of interest was reported by the authors.
Supplemental data
Supplemental data for this article can be accessed here.
Additional information
Funding
Related Research Data
References
- Abdallah S, Michaelson J, Stoll L, Marks N, Shah S 2012. The happy planet index 2012 report. nef. Available from: http://b.3cdn.net/nefoundation/d8879619b64bae461f_opm6ixqee.pdf
- Arrow KJ, Dasgupta P, Goulder LH, Mumford KJ, Oleson K. 2012. Sustainability and the measurement of wealth. Environ Dev Econ. 17:317–353.
- Atkinson G, Dietz S, Neumayer E, Agarwala M. 2014. Handbook of sustainable development. 2nd ed. Cheltenham: Edward Elgar.
- Barreto L, Makihira A, Riahi K. 2003. The hydrogen economy in the 21st century: a sustainable development scenario. Int J Hydrogen Energ. 28:267–284.
- Bolivian Democratic Government. 2010. Ley de Derechos de la Madre Tierra - Estado Plurinacional de Bolivia. Available from: www.bolivia.gob.bo/
- Brown JH. 2015. The oxymoron of sustainable development. BioScience. 20:1–2.
- Castella JC, Trung TN, Boissau S. 2005. Participatory simulation of land-use changes in the northern mountains of Vietnam: the combined use of an agent-based model, a role-playing game, and a geographic information system. Ecol Soc. 10:27.
- Cingranelli DL, Richards DL, Clay KC 2013. Short variable descriptions for indicators in the cingranelli-richards(CIRI) human rights dataset. Document version 5.21.14. CIRI Human Rights Data Project. Available from: http://www.humanrightsdata.com/p/data-documentation.html
- Costanza R, d’Arge R, de Groot R, Farberk S, Grasso M, Hannon B, Limburg K, Naeem S, O’Neill RV, Paruelo J, et al. 1997. The value of the world’s ecosystem services and natural capital. Nature. 387:253–260.
- Crépin AS. 2003. Multiple species boreal forests what faustmann missed. Environ Resour Econ. 26:625–646.
- Cuthill M. 2002. Exploratory research: citizen participation, local government and sustainable development in Australia. Sustain Dev. 10:79–89.
- Dasgupta P. 2007a. Measuring sustainable development: theory and application. Asian Dev Rev. 24:1–10.
- Dasgupta P. 2007b. The idea of sustainable development. Sustain Sci. 2:5–11.
- Dasgupta P. 2010. Nature’s role in sustaining economic development. Phil T Roy Soc B. 365:5–11.
- Dasgupta P 2013. The nature of economic development and the economic development of nature. Cambridge Working Papers in Economics. CWPE 1349. Cambridge: University of Cambridge.
- Dasgupta P, Ehrlich PR. 2013. Pervasive externalities at the population, consumption, and environment nexus. Nature. 340:324–328.
- Dearing JA, Wang R, Zhang K, Dyke JG, Haberl H, Hossain MS, Langdon PG, Lenton TM, Raworth K, Brown S, et al. 2014. Safe and just operating spaces for regional social-ecological systems. Global Environ Chang. 28:227–238.
- Dietz T, Rosa EA, York R. 2009. Environmentally efficient well-being: rethinking sustainability as the relationship between human well-being and environmental impacts. Hum Ecol Rev. 16:113–122.
- DiStefano C, Zhu M, Mîndrilă D. 2009. Understanding and using factor scores: considerations for the applied researcher. Pract Assessment Res Eval. 14. Available from http://pareonline.net/pdf/v14n20.pdf
- Duit A. 2014. State and environment. The comparative study of environmental governance. Cambridge (MA): MIT Press.
- Freedom House. 2014a. Freedom in the world 2014 methodology. Available from: https://freedomhouse.org/sites/default/files/Methodology\%20FIW\%202014.pdf
- Freedom House. 2014b. Freedom of press 2014 methodology. Available from: https://freedomhouse.org/sites/default/files/FOTP2014_Methodology.pdf.
- Galtung J, Hoeivik T. 1971. Structural and direct violence: a note on operationalization. J Peace Res. 8:73–76.
- Grubb M. 2013. Technology innovation and climate change policy: an overview of issues and options. Keio Econ Stud. 41:103–132.
- Guerrero AM, Bodin RR, McAllister J, Wilson KS. 2016. Achieving social-ecological fit through bottom-up collaborative governance: an empirical investigation. Ecol Soc. 20. doi:10.5751/ES–08035–200441
- Guyon I, Elissee A. 2003. An introduction to variable and feature selection. J Mach Learn Res. 3:1157–1182.
- Hamilton K, Clemens M. 1999. Genuine savings rates in development countries. World Bank Econ Rev. 13:333–356.
- Harrington D. 2008. Confirmatory factor analysis. Oxford: Oxford University Press.
- Hopwood B, Mellor M, O’Brien G. 2005. Sustainable development: mapping different approaches. Sustain Dev. 13:38–52.
- International Council for Science and International Social Science Council. 2015. Report: review of targets for the sustainable development goals: the science perspective. Available from: http://bit.ly/1Vs9Q99
- Jorgenson AK. 2010. World-economic integration, supply depots, and environmental degradation: a study of ecologically unequal exchange, foreign investment dependence, and deforestation in less developed countries. Crit Sociol. 36:453–477.
- Lamb WF, Steinberger JK, Brows-Larkin A, Peters GP, Roberts JT, Wood FR. 2014. Transitions in pathways of human development and carbon emissions. Environ Res Lett. 9:014011.
- Leadership Council of the Sustainable Development Solutions Network. 2015. Indicators and a monitoring framework for the sustainable development goals. United Nations. Available from: http://unsdsn.org/wp-content/uploads/2015/05/FINAL-SDSN-Indicator-Report-WEB.pdf
- Luke TW. 2005. Neither sustainable nor development: reconsidering sustainability in development. Sustain Dev. 13:228–238.
- Managi S, Kaneko S. 2009. Chinese economic development and the environment. Cheltham: Edward Elgar.
- Marshall MG 2014. Forcibly displaced populations, 1964-2008. Center for systemic peace. Available from: http://www.systemicpeace.org/inscr/FDPCodebook2008.pdf
- Marshall MG, Gurr TR, Jaggers K. 2014. Polity IV project. Political regime characteristics and transitions 1800-2013, dataset users’ manual. Center for Systemic Peace. Available from: http://www.systemicpeace.org/inscr/p4manualv2013.pdf
- Mehmood T, Liland KH, Snipen L, Saebo S. 2012. A review of variable selection methods in partial least squares regression. Chemometri Intell Lab. 118:62–69.
- Miller T, Holmes KR, Kim A. 2014. 2014 index of economic freedom. The Heritage Foundation and The Wall Street Journal. Available from: http://www.heritage.org/index/download
- OECD (Organisation for Economic Co-Operation and Development). 2011. Promoting technological innovation to address climate change. OECD Publishing. Available from: http://www.oecd.org/env/cc/49076220.pdf
- Ostrom E. 2009. A general framework for analyzing sustainability of social-ecological systems. Science. 325:419–422.
- Pao HT, Tsai CM. 2010. CO2 emissions, energy consumption and economic growth in BRIC countries. Energ Policy. 38:7850–7860.
- Pearce DW, Atkinson G. 1993. Capital theory and the measurement of sustainable development: an indicator of weak sustainability. Ecol Econ. 8:103–108.
- Porter ME, Stern S, Loria RA. 2013. Social progress index 2013. Social Progress Imperative. Available from: http://bit.ly/1Mefegv
- Ranganathan S, Nicolis SC, Spaiser V, Sumpter DJ. 2015a. Understanding democracy and development traps using a data-driven approach. Big Data. 3:22–33.
- Ranganathan S, Spaiser V, Mann RP, Sumpter DJ. 2014. Bayesian dynamical systems modelling in the social sciences. PLoS ONE. 9:e86468.
- Ranganathan S, Swain RB, Sumpter DJ. 2015b. The demographic transition and economic growth: implications for development policy. Palgrave Commun. 1:15033.
- Redclift M. 2002. Sustainable development: exploring the contradictions. London: Routledge.
- Redclift M. 2005. Sustainable development (1987-2005): an oxymoron comes of age. Sustain Dev. 13:212–227.
- Redclift M. 2010. Development and the environmental crisis: red or green alternatives. London: Routledge.
- Reinecke J. 2005. Strukturgleichungsmodelle in den Sozialwissenschaften. Oldenbourg: Oldenbourg Wissenschaft Verlag.
- Repetto R, Magrath W, Wells M, Beer C, Rossini F. 1989. Wasting assets: natural resources in the national income accounts. Washington (DC): World Resources Institute.
- Rich B. 2013. Mortgaging the Earth: the World Bank, environmental impoverishment, and the crisis of development. Washington (DC): Island Press.
- Ridley M. 2010. The rational optimist: how prosperity evolves. London: 4th Estate.
- Saboori B, Sulaiman J. 2013. Environmental degradation, economic growth and energy consumption: evidence of the environmental Kuznets curve in Malaysia. Energ Policy. 60:892–905.
- Schill C, Lindahl T, Crépin AS. 2015. Collective action and the risk of ecosystem regime shifts: insights from a laboratory experiment. Ecol Soc. 20:48.
- Solow R. 2012. A few comments on “sustainability and the measurement of wealth”. Environ Dev Econ. 17:354–355.
- Spaiser V, Ranganathan S, Mann RP, Sumpter DJ. 2014. The dynamics of democracy, development and cultural values. PLoS ONE. 9:e98231.
- Stern DI, Common MS, Barbier EB. 1996. Economic growth and environmental degradation: the environmental Kuznets curve and sustainable development. World Dev. 24:1151–1160.
- Swart RJ, Raskin P, Robinson J. 2004. The problem of the future: sustainability science and scenario analysis. Global Environ Chang. 14:137–146.
- Szirmai AE. 2015. How useful are global development goals? United Nations University. Available from: http://unu.edu/publications/articles/reflection-on-global-goals.html
- Thompson B. 2004. Exploratory and confirmatory factor analysis: Understanding concepts and applications. Washington (DC): American Psychological Association.
- Tollefson J. 2015. Can randomized trials eliminate global poverty? Nature. 524:150–153.
- United National Department of Economic and Social Affairs. 2015. Transforming our world: the 2030 agenda for sustainable development. UN Sustainable Development Knowledge Platform, Available from: https://goo.gl/bk0IMw
- van den Bergh JC, Abolishing GDP, Paper, TI 2007-019/3. Available from: http://papers.tinbergen.nl/07019.pdf
- World Bank Development Data Group. 2014. World Development Indicators. World Bank Publishing. Available from: http://data.worldbank.org/data-catalog/world-development-indicators
- World Commission on Environment and Development. 1987. Our common future. New York (NY): Oxford University Press.