
 ?Mathematical formulae have been encoded as MathML and are displayed in this HTML version using MathJax in order to improve their display. Uncheck the box to turn MathJax off. This feature requires Javascript. Click on a formula to zoom.
ABSTRACT
The ambitious United Nations Sustainable Development Goals (SDGs) have been criticized for being universal, broadly framed, inconsistent and difficult to quantify, implement and monitor. We contribute by quantifying and prioritising the SDGs and their impact on sustainable development. We employ structural equation models (SEM) to investigate, which of the underlying pillars of SDGs (economic, social and environment) are the most effective in achieving sustainable development. Our results reveal that the developed countries benefit most by focusing on social and environmental factors, whereas the developing countries benefit most by retaining their focus on the economic and the social factors.
1. Introduction
Milton Friedman famously said, ‘One of the great mistakes is to judge policies and programs by their intentions rather than their results’. Agenda 2030 with its 17 Sustainable Development Goals (SDGs) aims to eradicate poverty, establish socioeconomic inclusion and protect the environment (United Nations Citation1992). A global to-do list for sustainable development, it has been criticized for being too ambitious, universal, expansive and with potential inconsistencies, particularly between the socio-economic development and the environmental sustainability goals (Stern et al. Citation1996; Redclift Citation2005; UN SDSN Citation2015; ICSU and ISSC Citation2015; Easterly Citation2015; Spaiser et al. Citation2016). These challenges are akin to a quagmire of conceptual and quantification problems, and extrication of a measure of sustainable development and its impact is complex.
Our objective is to quantify SDGs and compare our measures to established measures of development, such as Human Development Index (HDI). Second, we investigate and quantify the impact of SDGs’ underlying pillars (economic, social and environment) on sustainable development. Third, we examine if the developing and the developed countries may pursue different strategies in achieving sustainable development in the short term.
We employ Structural Equation Models (SEM) on recent data, in the public domain, for 117 countries. Contrary to some confusion in the literature (Wilkinson Citation1999), SEM analysis produces quantitative causal claims, conditional on the input assumptions, along with data fitness and well-defined tests (Pearl Citation2012; Bollen and Pearl Citation2013; Tarka Citation2018). Our results reveal that for the developed countries, all the three underlying pillars of SDGs are significant, although the magnitude of increase in sustainable development is highest from the underlying social and environmental pillars of SDGs. For the developing countries, our results suggest that these countries may continue their focus on the economic and social pillars of SDGs. Although the sustainable development gains from the SDGs environment pillar are relatively smaller in magnitude (and statistically insignificant) in the short run, it cannot be ignored due to the interlinkages, synergies and trade-offs between these three pillars of SDGs. These results are robust, even when China and India are excluded.
Monitoring and quantifying the impact of Agenda 2030 requires measuring SDGs and sustainable development, which is fraught with challenges (Bali Swain Citation2018). Easterly (Citation2015) argues that the SDGs are encyclopedic where everything is top priority, implying that nothing is a priority. Moreover, there is ambiguity as to how the U.N. is going proceed in achieving the unactionable, unquantifiable targets for the SDGs, that may also be unattainable, like ‘ending poverty in all its forms and dimensions,’ ‘universal health coverage,’ ‘[end] all forms of discrimination against all women and girls everywhere,’ ‘achieve full and productive employment and decent work for all women and men,’ etc.
In spite of the inherent difficulties in measuring and monitoring SDGs, a limited body of literature has recently emerged (Nicolai et al. Citation2015; Green Growth Knowledge Platform Citation2016; Sachs et al. Citation2016; Spaiser et al. Citation2016). However, to our knowledge, there are none that quantify the impact of SDGs and draw causality between the underlying SDG pillars and sustainable development. Our paper contributes at several levels. First, employing global data we measure unobservables like sustainable development and the underlying pillars of SDGs (economic, social and environment). Second, to maintain the comparability of the results, the analysis is based on global data available in the public domain. Third, we take the multiple dimensionality of the SDGs into account without computing indices or averages that impose autonomous weights. We employ the Principal Component Analysis (PCA) method to compute the scores for each of the SDGs as measured by multiple observed indicators. Moreover, to capture the connections between the SDGs and the economic, social and environmental pillars, we use Exploratory Factor Analysis (EFA), instead of imposing extraneous links between the SDGs and the SDG pillars. Fourth, by employing Structural Equation Models (SEM) we are able to establish causality between the underlying (latent) SDG pillars and another latent variable like sustainable development. Finally, our analysis enables us to examine which of these underlying pillars are most effective in achieving sustainable development for the developing and the developed countries, in the short term.
The next section briefly reviews the existing literature on quantification of sustainable development, followed by sections explaining the methodology and the data analyzed. Section 5 presents and discusses the empirical results. The final section concludes.
2. Quantifying sustainable development and goals
The Millennium Development Goals (MDGs) that preceded the SDGs were precise and measurable, which made them attractive (Easterly Citation2015). With eight well-defined MDGs, the demand for information was limited. Even then, the lack of reliable data rendered the unreported, invisible to the decision makers.For instance, for the MDG indicators, only three African countries have data on all indicators (United Nations Citation2014). As compared to the MDGs, the 17 SDGs (169 sub-targets) pose a formidable challenge. In March 2016, the UN Statistical Commission adopted a list of 230 indicators suggested by the Inter-Agency and Expert Group on SDG Indicators.Footnote1 This is in sharp contrast to the 60 globally harmonized indicators for the MDGs. Operationalization of SDGs and their implementation involves monitoring and measuring sustainable development indicators.
In this section, we describe some of the significant publications in the emerging literature on SDG measurement, while in the next section we go into the details of the methodology that we develop to evaluate SDGs. Three major studies in the developing literature are: the GGKP Report on Measuring Inclusive Green Growth at the Country Level (Green Growth Knowledge Platform Citation2016); the SDG Index and Dashboards Global Report prepared by the UNSDSN and the Bertelsmann Stiftung (Sachs et al. Citation2016); and the Overseas Development Institute Report (Nicolai et al. Citation2015). The GGKP Report on Measuring Inclusive Green GrowthFootnote2 (IGG) at the Country Level is not limited to the SDGs and focuses on the Inclusive Green Growth and their interaction in a dynamic perspective (Fay Citation2012).
The Overseas Development Institutes report (Nicolai et al. Citation2015) develops a grading system for each of the SDGs. The report classifies them into three categories: reform, revolution, and reversal. Reform level SDGs are more than halfway to achievement by 2030, while goals that require progress by multiples of current rates are graded as revolution. The most extensively used SDG Index is the one presented in the SDG Dashboards report (Sachs et al. Citation2016). It identifies multiple indicators from the most recent published, to measure each SDG goal. Employing geometric and arithmetic averages, it computes scores for the data across all indicators that apply to each of the SDG. The method enables them to calculate a country scores for each of the 17 goals. These scores are averaged to find the overall SDG Index for each country. This study finds that three Scandinavian countries (Sweden, Denmark and Norway) have the highest SDG index, implying that they are the closest to achieving the SDG targets for 2030.
In our earlier paper (Spaiser et al. Citation2016) we construct two separate measures of SDGs. These measures assume a true latent variable for sustainable development with the three components of child mortality, education and CO2 emissions (representing the economic, social and environment pillar). We find that these two different constructs of sustainable development perform better than the common indices, namely, HDI and GDP per capita. Spaiser et al. (Citation2016) also quantify the incompatibility and inconsistency in the SDGs.
While these studies present indices and hence the possibility to monitor sustainable development and SDGs, they are restricted by major data limitations. Furthermore, they do not inform the policy makers on which of the underlying economic, social or environment pillars are significant in impacting sustainable development. This is critical, given the inconsistencies and trade-offs between the various components of SDGs (Spaiser et al. Citation2016).
We also need to measure sustainable development. Efforts to quantify sustainable development are not neoteric. As far back as in the 1970s, Agenda 21 formulated the need for sustainable development indicators.Footnote3 On sustainable development indicators, Agenda 21 (paragraph 40.4) states that:
‘Indicators of sustainable development need to be developed to provide solid bases for decision-making at all levels and to contribute to a self-regulating sustainability of integrated environment and development systems.’
Sustainable development was initially interpreted to be a dynamic optimization problem of intergenerational equity. It was about ensuring optimal consumption that could be maintained in the long run without depleting the generated (Pierantoni Citation2004).
Since the early 1990s, multiple measures of sustainability have been developed and used by policy makers. These range from conventional measures of economic performance, such as gross domestic product (GDP), to measures that aim to capture the sustainable development. Output measures like GDP, net domestic product and real consumption per capita are widely used but only capture the economic aspect of development (Parris and Kates Citation2003) and may be misleading as they disregard the overexploitation of the natural resources (Goodland and Ledec Citation1987). This has led to a spate of measures that account for the depletion of environmental or natural capita, such as, Green Net National Product (Hartwick Citation1990; Weitzman Citation1997), Genuine Savings Index (Hamilton Citation1994; Neumayer Citation2001), Ecological footprint (Rees Citation1992; Lin et al. Citation2016), Environmental Sustainability Index (Parris and Kates Citation2003) etc.
An alternate set of sustainable development indices attempt to measure the well-being. These include the Well-being index (Parris and Kates Citation2003), Genuine Progress indicator Gross National Happiness index (Ura et al. Citation2012), etc. However, these indices suffer from errors and biases, which are significant for the environmental data in general. Also, measures for the social aspect of sustainability suffer from subjectivity in the selection of input variables (Custance and Hillier Citation1998). Ambiguity, errors and biases in data collection and analysis of sustainable development measures have thus implied that there are no indicators that are universally accepted by policy makers (Parris and Kates Citation2003). An added problem is the lack of a measure that is easily comparable and interpreted across countries and sectors (B¨ohringer and Jochem Citation2007). Thus, UNDP's Human Development Index (HDI) remains one of the most accepted indicators of social development with its three major components: longevity, knowledge, and income (United Nations Development Programme Citation2010).
Sen’s theory of development as freedom and capabilities approach provides a wider interpretation of development to include social capital and human capital (Sen Citation1985, Citation2001, Citation2010). A recent body of literature defines Sustainable Development in terms of Inclusive Wealth or intergenerational well-being (Arrow et al. Citation2012). Inclusive Wealth is the society’s stock of all its capital assets (reproducible/productive capital, human capital and natural capital) and their changes over time, accounting for population growth and technological change. Unlike GDP per capita and Human Development Index (HDI), empirical evidence shows that the Inclusive Wealth Index can better capture sustainable development through changes in intergenerational well-being (Dasgupta Citation2013). This measure is, however, severely limited by cross-country, time-series data availability (Arrow et al. Citation2012; Dasgupta Citation2013).
3. Methodology
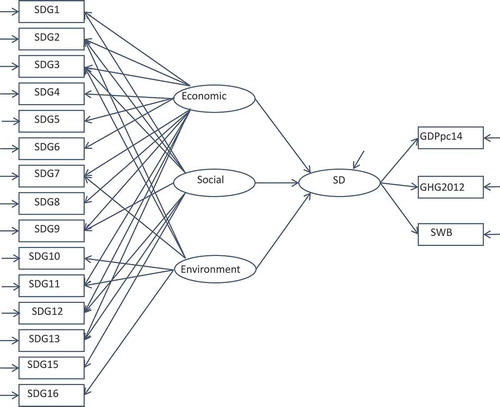
We employ Factor Analysis exploratory factor analysis and Structural Equation Models (SEM) in our analyses. The path diagram of the model of interest is explained in . The ellipses in the middle of the path diagram (with the arrows) represent the structural model, which reveals the causal relationship between the latent factors (SDGs underlying pillars and sustainable development). The three underlying pillars of sustainable development are represented by the latent variables: economic, social and environment (left-hand side ellipses). The causal impact of these three latent variables on the latent sustainable development variable (right-hand side ellipse) is estimated in the structural model. SEM models have been widely used in economics (for a review refer to Tarka (Citation2018)). A large body of literature present SEM as the prime language of causal analysis for both linear and nonlinear analyses (Pearl Citation2012; Bollen and Pearl Citation2013).
3.1. The measurement model
The measurement models are captured by the rectangles and arrows connect the observed and the latent variables on the left and right-hand side of . The measurement of the three pillars of SDGs (left-hand side) is estimated in two steps.
In step 1, the Principal Component Scores (PCA) are calculated for each of the SDGs using the set of observed indicators for that specific goal. PCA is a common dimension-reduction or data compression tool often used to reduce high-dimensional data structures while retaining most of the information. It is a mathematical procedure that transforms a number of (possibly) correlated variables into a (smaller) number of uncorrelated variables called principal components. We apply this technique to compute the scores for each of the SDG goals. The calculation of the principal component scores is briefly summarized in the Appendix.
In Step 2, instead of extraneously imposing the connections between the SDG scores (in rectangles) and the latent factors, namely, Economy, Social, Environment (in ellipses), we employ Exploratory Factor Analysis (EFA) to identify the underlying theoretical structure of the latent phenomena. EFA is used to identify the structure of the relationship between the observed variables and the latent factors, i.e. SD, Economy, etc. It tests whether the correlation structure of the observed indicators allows to extract one or several factors. It thus examines if the observed variables can be predicted by one or several latent factors.
The other measurement model (on the right-hand side) of , determines the latent sustainable development (in ellipses) using indicators (measures in rectangles). The arrow pointing to the sustainable development (SD) ellipse signifies the error term in the structural model with the latent variables.
Figure 1. Path diagram for structural equation model (SEM) of sustainable development goals.
3.2. The structural equation models
The structural model that corresponds to and measures the causal relationship between the underlying pillars of SDGs and sustainable development can be expressed in the matrix form as follows:
where x and y are the indicator vectors of latent factors, namely, x includes the SDGs on the left-hand side of the path diagram and y represents the matrix of measures of sustainable development on the right-hand side. η is latent sustainable development and ξ includes latent factors (pillars) economic, social and environment. Λx and Λy are factor loadings which connect the latent factors and the observed indicators. The Γ coefficients indicate the causal relations between the latent factors, whereas δ, ε and ς are the error terms associated with the measurements.
The model is estimated by the Maximum Likelihood estimation method. The Maximum Likelihood (ML) approach estimates the unknown parameters in the model by minimizing the fit function
where k is the number of indicators, S and Σ are the sample and model implied variance and covariance matrix, respectively. This fit function assumes that the observed indicators have a multi-normal distribution.
4. Data
Quantifying SDGs require data and data in the developing countries is often remarkably poor and often missing. In fact, there is not a single five-year period since 1990 where countries have enough data to report on more than 70% of MDG progress (United Nations Citation2014). Child mortality is widely assumed to have the best reported data, yet of the 161 developing countries, only 136 have data on it (Rodr´ıguez-Pose and Samuels Citation2015). Even where comprehensive data exists, certain groups are missing, such as ethnic minorities or indigenous populations and slum-dwellers. The SDG Dashboards report (Sachs et al. Citation2016) identifies 77 indicators for 149 countries to measure SDGs based on five quality criteria for data selection, namely, global relevance and applicability to a broad range of country settings; statistically reliable data; availability for most recent years; best available data derived from official national and international sources; and good data coverage. While there is no ideal and strict approach to data availability, Sachs et al. balance their data on two key decisions: using only actual published data, and including as many countries as possible. Data sources include the World Development Indicator database (World Bank Citation2016), the Human Development Report (United Nations Development Programme Citation2015), and OECD Statistics (OECD Citation2016), etc. They include indicators for which 80% of the data is available for countries with population greater than 1 million. We begin with this dataset as the base for our analyses.
Sachs et al. (Citation2016) have full information on 77 indicators for only 34 countries to calculate the augmented SDG Index. However, the 149 countries are ranked based on the overall arithmetic and geometric score while ignoring the missing values.4 Starting with the same data as Sachs et al. (Citation2016), we delete the missing values. Our analyses is based on the remaining 51 SDG indicators for 117 countries. The observed indicators that were used to estimate the SDG scores are described in with their definition, data source and year. Data on SDG 14 and 17 were missing and had to be dropped. For instance, for several land-locked countries, there is limited information on indicators for SDG 14, Life in water. This implied that SDG 14 had to be deleted from our analysis.
Table 1. Indicators included in the SDG index and dashboards and our study.
The variables have also been scaled in the same direction. For instance, if the amount of untreated sewage decreases, it is a positive development, whereas if the number of school-going children decline, it has a negative impact on development. The variables are scaled, such that increase in it implies a positive impact on SDG and a decline implies a corresponding negative impact on SDGs.
The sustainable development (right-hand side latent variable in ) is measured by three indicators, namely, GDP per capita in 2014 (economic), greenhouse gas emissions equivalent in 2012 (environment) and subjective well-being in 2014 (social). Subjective well-being consists of three components: cognitive evaluations of one’s life, positive emotions (joy, pride), and negative ones (pain, anger, worry) (OECD Citation2013; Helliwell Citation2016). It thus broadly captures the state of well-being that includes experiencing pleasant emotions, low levels of negative moods, and high life satisfaction.
For robustness check, we repeat the analysis by employing Healthy life expectancy at birth (HALE) as the social indicator, developed by the World Health Organization (WHO Citation2003).5 HALE is defined as the estimate of the number of healthy years that an individual is expected to live at birth by subtracting the years of ill health weighted according to the severity from the overall life expectancy.
5. Results
5.1. Quantifying and comparing sustainable development measure
Employing Principal Component Scores (PCA) we compute the latent SDG measure, whereas the Exploratory Factor Analysis (EFA) suggests their relationship to the three underlying pillars of SDGs (). We begin by examining the results from the left-hand side measurement model in the path diagram. It specifies how the pillars of SDGs (economic, social and environment) are measured from the SDGs and describes their reliability and validity. The SDG scores are calculated from their respective observed indicators. , and present the estimated parameters of the measurement models for all countries, developed countries and developing countries, respectively. The coefficients indicate the linear causal relationship between the observed indicators of SDGs (xi) and the latent (SDG pillar) factors (i). The statistical significance of the coefficients indicate that the SDG scores are a valid measure of the three underlying pillars of sustainable development (latent factors). As stated earlier, the scales are all in the same direction but to interpret the coefficients, one has to rely on the description of indicators in . presents the analytical result of the measurement.
Table 2. All countries: estimated parameters of the measurement model for sustainable development and underlying SDG pillar factors.
Table 3. Developed countries: estimated parameters of the measurement model for sustainable development and underlying SDG pillar factors.
Table 4. Underdeveloped countries: estimated parameters of the measurement model for sustainable development and underlying SDG pillar factors.
Model for all countries and shows the connection between the latent factors and observed indicators that measure them. For instance, a negative sign on the SDG 1 (No Poverty) coefficient shows that as the Poverty headcount ratio at $1.90 a day (2011 PPP) (percent of population) decreases, the economic factor (pillar) of sustainable development improves.
Based on the EFA, the economic SDG factor includes SDGs related to the socio-economic well-being (SDGs 1–6); affordable and clean energy (SDG 7); decent work and economic growth (SDG 8); industry, innovation and infrastructure (SDG 9); Sustainable cities and communities (SDG 11); responsible consumption and production (SDG 12) and Climate Action (SDG 13). Clearly, SDGs are strongly inter-linked; thus, economic factor has a strong well-being, social and environmental component. Thus, actions that remove poverty also overlap with changes in education, health and climate change. The interlinkages also emerge in other pillars of SDGs. The social SDG factor includes indicators focused towards the well-being of the poor and lower income groups. It includes No Poverty (SDG 1), Zero Hunger (SDG 2); and good health and well-being (SDG 3). Additional components include responsible consumption and production (SDG 12); Climate Action (SDG 13); and Life on Land (SDG 14). Finally, the environmental component includes Zero Hunger (SDG 2); good health and well-being (SDG 3); Affordable and Clean Energy (SDG 7); Reduced inequalities (SDG 10); Sustainable cities and communities (SDG 11) and Peace, Justice and strong institutions (SDG 16).
Figure 2. Sustainable development space: human development index and sustainable development goals measure. This is a scatter-plot of sustainable development goals scores as estimated by the left-hand side measurement model in and the human development index (HDI).
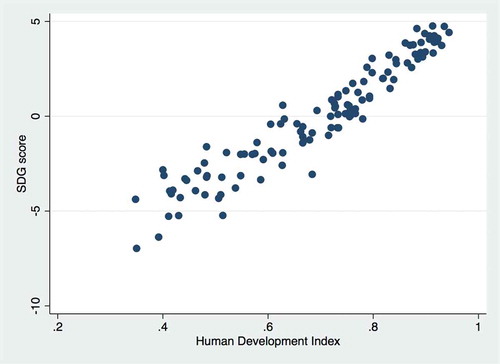
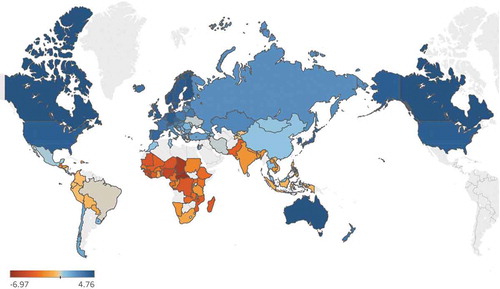
The left-hand side measurement model in the path diagram computes the measure of sustainable development from the underlying pillars of SDGs, which are presented in the world map (). This SDG measure traces the countries’ level of success in achieving its SDGs. The countries with the lower SDG scores are depicted in red color and countries with the higher level of SDGs are represented in blue. Scandinavian countries are the top SDG performers. Most of Western Europe, North America, New Zealand and Australia is performing well in meeting the socio-economic and environmental targets, though there is substantial scope for improvements. Parts of Eastern Europe and Central Asia are lagging behind. The situation is acute in several African countries. Although South Asia and South-east Asia does not perform well on their SDGs, China does relatively better. South American countries, with the exception of a few, also have a long path to transverse before the SDG targets can be met. Comparing our SDGs measure with other widely used indices, for example, the UN SDG dashboard report index (Sachs et al. Citation2016) and Human Development Index (HDI) show a strong correlation. shows a strong positive relationship with the widely used measure of development, the HDI.
5.2. Factors impacting sustainable development
The SEM model of sustainable development captures the causal relationship between the underlying pillars of SDGs (economic, social and environment) and sustainable development. The results help determine the most effective factor in impacting and creating sustainable development.
Figure 3. Map of Sustainable Development Goals (SDG) measure. This map is based on the Sustainable Development Goals scores as estimated by the left-hand side measurement model in . The scale moves from low SDG scores (red) to high SDG scores in blue. Gray color shows that the score cannot be calculated due to missing data.
presents the parameter estimates and some of the fit indices for the structural model for sustainable development. These coefficients are standardized and may thus be interpreted on both significance and magnitude. The fit of the structural equation model can be assessed by examining the Satorra–Bentler scaled chi-square goodness of fit index, the Comparative Fit Index (CFI) and Root Mean Square residual (RMR). The estimated Satorra–Bentler scaled chi-square in indicates that the model shows a good fit for all countries (column 1), developed countries (column 2) and developing countries (column 3). For a good approximate fit the RMR should be less than 0.8 and the CFI should be close to 0.9. The model fits well for all countries and developing countries; however, for the developed countries, the model fit is on the margin and should be interpreted carefully.
Table 5. Estimated parameters of sustainable development structural model.
The results in reveal causality between the underlying pillars of SDGs and sustainable development. For the developed countries we find that while all the three latent factors have a positive and significant impact on their sustainable development; the environmental and the social pillars of SDGs have the strongest impact, both in terms of statistical significance and magnitude. The environmental SDG factor has an impact that is 3.5 times greater than that of the economic SDG factor on sustainable development. The impact of the social SDG factor is equally strong. As compared to the economic SDG factor, the social SDG factor has a 3.3 times greater effect on the sustainable development of developed countries. Thus, for developed countries, emphasis on the environmental and social SDGs factors would lead to greater sustainable development. Most developed countries have effectively provided basic amenities and standard. However, for greater impact on sustainable development, they need to continue their focus on No Poverty (SDG 1), Zero Hunger (SDG 2), good health and well-being (SDG 3), reduced inequalities (SDG 10) and responsible consumption and production (SDG 12). In addition, focus on Climate Action (SDG 13), Life on Land (SDG 14), Affordable and Clean Energy (SDG 7), Sustainable cities and communities (SDG 11) and institutional factors like Peace, Justice and strong institutions (SDG 16) are of critical importance to developed countries’ strategy for sustainable development.
The results for the developing countries are presented in (column 3). Our results confirm that for the developing countries, the economic factor is the most significant in its impact on sustainable development. In many of these countries achieving a basic standard of living is a challenge. A large proportion of the developing countries’ population is struggling in poverty and are malnourished with limited opportunities to decent livelihood. The strongest impact on sustainable development comes through the underlying economic SDG pillar, which has a 44 times greater impact on sustainable development as compared to the environmental SDG pillar. The economic SDG factor is also 2.4 times stronger than the social SDG factors. Developing countries should focus on SDGs related to the socio-economic well-being (SDGs 1–6), affordable and clean energy (SDG 7), decent work and economic growth (SDG 8); industry, innovation and infrastructure (SDG 9); Sustainable cities and communities (SDG 11); responsible consumption and production (SDG 12) and Climate Action (SDG 13).
Rapidly developing economies of China, India, Brazil, Indonesia, Mexico, Turkey, etc. have become large emitters along with the developed large economies such as the United States, the United Kingdom, Canada, Japan, Germany, Italy, etc., accounting for the majority of the future global emissions till 2020 (Ranganathan et al. Citation2014; World Bank Citation2016). The Asian economies account for two-thirds of the global increase in carbon emissions, with China and India as the two main contributors to carbon emissions (IEA Citation2018). China and India (along with United States, Russian Federation and Japan) are amongst the top five emitters contributing to more than 50% of total global emissions of greenhouse gases. China overtook the United States as the highest emitter in 2005, and India bypassed Russia as the third largest emitter in 1998. We, therefore, re-estimate the structural model for the developing countries by excluding India and China. The results are robust and slightly stronger for the remaining set of developing countries.
6. Conclusions
The path to quantifying and monitoring SDGs is a quagmire. It requires a profound understanding of sustainable development, commitment and ability to operationalize and implement the multi-dimensional SDGs, access to all forms of data and the expertise to analyze and interpret the results. Furthermore, there is an inherent conflict between the socio-economic development and ecological sustainability, which makes it challenging to determine the most effective strategy to create sustainable development (Redclift Citation2005; Spaiser et al. Citation2016). Undertaking these challenges, we employ published open access data for 117 countries to investigate which one of the three underlying pillars of SDGs are the most effective in creating sustainable development.
The theoretical foundation of SDGs is weak (ICSU and ISSC Citation2015; Szirmai Citation2015) and a comprehensive sustainable development theory does not exist. Instead, there are different contested theoretical approaches and definitions (Hopwood and O’Brien Citation2005; Holden et al. Citation2014). The SDGs provide a list of targets, with no clear priorities and no theory on how these goals can be attained (Bali Swain Citation2018). We therefore rely on confirmatory and exploratory factor analysis approaches. Employing SEM models we estimate a structural model that enables us to find causality between sustainable development and the three underlying pillars of SDGs, namely, economic, social and environmental. Our results suggest that while all three factors are critical to sustainable development, the developing countries should focus their resources and policies in the short run on economic growth and social development. Resources are limited and SDGs are fraught with trade-offs and inconsistencies. Therefore, strategic policy focus on socio-economic development in the developing countries may be a successful short-run policy to achieve sustainable development. Developed countries' results, however, suggest a greater propensity to achieve sustainable development by focus on the environmental and social factors.
The recent (IPCC Citation2018) report calls for the impact of global warming to be limited to 1.5 C, which requires a strengthened global response to the threat of climate change, sustainable development and efforts to eradicate poverty. Given the urgency of responding effectively to these challenges, our results may be interpreted to suggest that the developing countries should continue pursuing the MDG agenda of focusing on socio-economic development in the short-run to create a greater impact on their sustainable development, given their scarce resources and structural constraints. These results are in line with the literature that visualizes SDGs as an interlinked set of policies with trade-offs and synergies (Spaiser et al. Citation2016; Bali Swain and Ranganathan Citation2018). Maintaining the momentum on the MDG agenda in the shortrun should not imply ignoring the environment. On the contrary, the synergies, trade-offs and inter-linkages between the SDGs may be better leveraged in achieving sustainable development, by focusing on the economic and social factors in the developing countries.
Disclosure statement
No potential conflict of interest was reported by the authors.
Additional information
Funding
Notes
1. Some of these proposed indicators lack data and statistical definitions. The list may be accessed from https://unstats.un.org/unsd/statcom/47th-session/documents/2016-2-IAEG-SDGs E.pdf.
2. The GGKP report identifies five broad characteristics of IGG: Natural Assets; Resource Efficiency and Decoupling; Resilience and Risks; Economic Opportunities and Efforts; and Inclusiveness.
3. It was adopted by 183 governments at the 1992 United Nations Conference on Environment and Development (UNCED) in Rio de Janeiro (United Nations, Citation1992) and was reaffirmed at the World Summit on Sustainable Development held in Johannesburg, South Africa in 2002, and the 2012 Rio de Janeiro conference.
References
- Arrow KJ, Dasgupta P, Goulder LH, Mumford KJ, Oleson K. 2012. Sustainability and the measurement of wealth. Environ and Dev Econ. 17:317–353. doi:10.1017/s1355770x12000137
- B¨ohringer C, Jochem PE. 2007. Measuring the immeasurable — a survey of sustainability indices. Ecol Econ. 63:1–8. doi:10.1016/j.ecolecon.2007.03.008
- Bali Swain R. 2018. A critical analysis of the sustainable development goals. In: W. Leal Filho, editor. Handbook of sustainability science and research. Springer International publishing. p. 341–355.
- Bali Swain R, Ranganathan S. 2018. Capturing sustainable development goals interlinkages. conference paper for 8th IAEG meeting, 5–8 November, Stockholm.
- Bollen KA, Pearl J. 2013. Eight myths about causality and structural equation models. In: Morgan SL, editor. Handbook of causal analysis for social research. Dordrecht: Springer. p. 301–328.
- Custance J, Hillier H. 1998. Statistical issues in developing indicators of sustainable development. J R Stat Soc Ser A (Stat Soc). 161:281–290. doi:10.1111/1467-985x.00108
- Dasgupta PS. 2013. The nature of economic development and the economic development of nature. Cambridge: University of Cambridge.
- Easterly W. 2015 Nov. The trouble with the sustainable development goals.Curr History, 114(775).
- Fay M. 2012. Inclusive green growth: the pathway to sustainable development. New York: World Bank Publications.
- Goodland R, Ledec G. 1987. Neoclassical economics and principles of sustainable development. Ecol Modell. 38:19–46.
- Green Growth Knowledge Platform. 2016. Measuring inclusive green growth at the country level – taking stock of measurement approaches and indicators. Technical Report. Green Growth Knowledge Platform.
- Hamilton K. 1994. Green adjustments to GDP. Resour Policy. 20:155–168. doi:10.1016/0301-4207(94)90048-5
- Hartwick JM. 1990. Natural resources, national accounting and economic depreciation. J Public Econ. 43:291–304. doi:10.1016/0047-2727(90)90002-y
- Helliwell JF. 2016. Life satisfaction and quality of development, in: policies for happiness. Oxford: Oxford University Press; p. 149–174. doi:10.1093/acprof:oso/9780198758730.003.0008.
- Holden E, Linnerud K, Banister D. 2014. Sustainable development: our common future revisited. Global Environ Change. 26:130–139.
- Hopwood M, O’Brien. 2005. Sustainable development: mapping different approaches. Sustainable Dev. 13:38–52.
- ICSU and ISSC. 2015. Review of the sustainable development goals: the science perspective, ICSU and ISSC, Paris.
- IEA. 2018. Global energy & co2 status report 2017. International Energy Agency.
- IPCC. 2018. Special report global warming of 1.5 c. Intergovernmental panel on climate change.
- Lin D, Hanscom L, Martindill J, Borucke M, Cohen L, Galli A, Lazarus E, Zokai G, Iha K, Eaton D, et al. 2016. Working guidebook to the national footprint accounts. 2016 edition. Oakland: Global Footprint Network
- Neumayer E. 2001. The human development index and sustainability—a constructive proposal. Ecol Econ. 39:101–114.
- Nicolai S, Hoy C, Berliner T, Aedy T, 2015. Projecting progress: reaching the SDGs by 2030. Technical Report. London: Overseas Development Institute.
- OECD. 2013. OECD guidelines on measuring subjective well-being. Paris: OECD Publishing.
- OECD. 2016. OECD statistics. Stats.oecd.org. accessed 2016 Jul 7 http://stats.oecd.org/.
- Parris TM, Kates RW. 2003. Characterizing and measuring sustainable development. Annu Rev Environ Resour. 28:559–586.
- Pearl J. 2012. The causal foundations of structural equation modeling. In: Hoyle RH, editor. Handbook of structural equation modeling. New York: Guilford Press; p. 68–91.
- Pierantoni I. 2004. A few remarks on methodological aspects related to sustainable, in: measuring sustainable development: integrated economic, environmental and social frameworks. Paris: OECD Publishing; p. 63–89.
- Ranganathan S, Spaiser V, Mann RP, Sumpter DJT. 2014. Bayesian dynamical systems modelling in the social sciences. PLoS One. 9:1–9. doi:10.1371/journal.pone.0086468
- Redclift M. 2005. Sustainable development (1987–2005): an oxymoron comes of age. Sustainable Dev. 13:212–227.
- Rees WE. 1992. Ecological footprints and appropriated carrying capacity: what urban economics leaves out. Environ Urban. 4:121–130.
- Rodr´ıguez-Pose R, Samuels F. 2015. Rwanda’s progress in health: leader- ship, performance and health insurance. London: ODI.
- Sachs J, Schmidt-Traub G, Kroll C, Durand-Delacre D, Teksoz K. 2016. SDG index and dashboards — A global report. New York: Bertelsmann Stiftung and Sustainable Development Solutions Network (SDSN).
- Sen A. 1985. Commodities and capabilities. Amsterdam New York New York (N.Y., U.S.A): North-Holland Sole distributors for the U.S.A. and Canada, Elsevier Science Pub. Co.
- Sen A. 2001. Development as freedom. Oxford New York: Oxford University Press.
- Sen A. 2010. Equality of what? In: MacMurrin SM, editor. The Tanner lectures on human values, 4. 2nd ed. Cambridge: Cambridge University Press; p. 195–220.
- Spaiser V, Ranganathan S, Swain RB, Sumpter DJT. 2016. The sustainable development oxymoron: quantifying and modelling the incom- patibility of sustainable development goals. Int J Sus- Tainable Dev World Ecol. 24:457–470. doi:10.1080/13504509.2016.1235624
- Stern DI, Common MS, Barbier EB. 1996. Economic growth and environmental degradation: the environmental Kuznets curve and sustainable development. World Dev. 24:1151–1160.
- Szirmai A. 2015. How useful are global development goals?. New York: United Nations University.
- Tarka P. 2018. An overview of structural equation modeling: its beginnings, historical development, usefulness and controversies in the social sciences. Qual Quant. 52(1):313–354.
- UN SDSN. 2015. Data for development. A needs assessment for SDG monitoring and statistical capacity development. Technical Report. UNSDSN.
- United Nations. 1992. Agenda 21. Technical Report. United Nations.
- United Nations. 2014. A world that counts mobilizing the data revolution for sustainable development. Technical Report. Independent Expert Advisory Group on a Data Revolution for Sustainable Development.
- United Nations Development Programme. 2010. Human development report. Technical Report. New York: UNDP.
- United Nations Development Programme, 2015. Human development report. Technical Report. New York: UNDP.
- Ura K, Alkire S, Zangmo T, Wangdi K, May 2012. An extensive analysis of GNH index. Technical Report. Thimphu (Bhutan): Centre for Bhutan Studies.
- Weitzman ML. 1997. Sustainability and technical progress. Scand J Econ. 99:1–13. http://www.jstor.org/stable/3440608.
- WHO. 2003. Health systems performance assessment: debates, methods and empiricism. Geneva: World Health Organisation.
- Wilkinson L. 1999. Statistical methods in psychology journals: guidelines and explanations. Am Psychologist. 54:594–604. on Statistical Inference, T.T.F., of Scientific Affairs, A.B.
- World Bank. 2016. World development indicators. The World Bank. [accessed 2016 Jul 7]. http://data.worldbank.org/products/wdi.
Appendix
Let be a data matrix of order
where N is the number of cases and p is the number of variables.
is the normal linear combination where
satisfies
The sample covariance matrix
can be written as
where
is defined as
and
is a diagonal matrix. For simplicity, we assume that all eigenvalues of
of
are positive.
Then, the principal component scores is given as a
matrix
Post multiply to equation
gives
We can show that the covariance matrix of the principal component scores is
,