
 ?Mathematical formulae have been encoded as MathML and are displayed in this HTML version using MathJax in order to improve their display. Uncheck the box to turn MathJax off. This feature requires Javascript. Click on a formula to zoom.
ABSTRACT
The recent challenges of the contemporary world have brought into question the long-term sustainability of human activities. In 2015, all the countries of the UN General Assembly made a commitment to promote sustainability in the Agenda 2030, which introduced a worldwide concept of 17 main goals in achieving sustainable development – Sustainable Development Goals (SDGs). To become successful in meeting the SDGs, the necessity of measuring, evaluating and controlling the goals emerges. The aim of our study is to enrich this area of research by introducing Data Envelopment Analysis (DEA) into the assessment of the level of the SDGs achievement and the measurement of the countries’ progress. We apply the DEA to compute the relative efficiency of the individual countries in fulfilling their commitment. The best performers that we identify are Finland, Japan and Iceland. Next, we estimate a year in which the individual countries may be able to achieve the SDGs if they continue with their current strategies. Following the actual pace of the improvements, we find that only five countries are on track to become relatively efficient by or around 2030.
Introduction
The economic perspective on limited resources and increasing the population of our planet has already been addressed by classical economists, since the beginning of the 19th century. However, recent considerable public interest in planetary limits was initiated by the publication The Limits to Growth (Meadows et al. Citation1972). The authors published the results of the simulation of exponential economic and population growth within limited resource settings. The result warned against exhausting scarce resources and the necessary decline both in welfare and the population. This strong voice predicting a pessimistic future draws attention to environmental issues in the global agenda. As a result, with a focus on economic goals, the environmental problems are more and more important in political decisions.
The concept dealing with the contradiction of how to meet two competing goals – socioeconomic development and preservation of the environment and scarce resources – refers to a new concept of sustainable development. The awareness of future developments and their limits led the United Nations to appoint a mission that came into the general awareness as The Brundtland Commission, which clarifies the definition of sustainable development as ‘meeting the needs of the present without compromising the ability of future generations to meet their own needs’ (Brundtland Citation1987). A decade later at the Earth Summit (1992), Agenda 21 addressing sustainable development targets to be achieved by 2021 was adopted. Since then, it has been modified several times (Rio + 5 in 1997, Rio + 10 in 2002, Rio + 20 in 2012), and it was finally included in the most recent Agenda 2030.
In particular, the 2030 Agenda was adopted in September 2015, a commitment to continue with creating a sustainable world in which all its inhabitants can lead a productive and vibrant life in peace in a healthy environment. Paragraph 92 of the 2030 Agenda defines the SDGs and summarises their main focus. They contain all the eight Millenium Development Goals (MDGs) from the previous concept Agenda 21 and continue to amend them stressing the most challenging issues as environmental sustainability, which is less tackled by the MDGs (Deneulin and Shahani Citation2009; UN Citation2013). Although the concept of the SDGs is a direct successor to the MDGs, the overall philosophy is quite different. The MDGs were mostly focused on the poor countries to ensure better health care and to eliminate extreme poverty. The effort to eliminate extreme poverty is maintained in the SDGs, but goals like infrastructure development and innovations, inclusive economic growth and low unemployment challenge the rich countries in the same way as the poor ones. Also, as evaluated by Allen et al. (Citation2019), the new goals are far more complex and interlinked than the previous ones. This leads to new challenges both in research and implementation. Although a current medical crisis may compromise some of the goals, authors, such as Sachs et al. (Citation2020), still perceive them as feasible.
The progress in the SDGs agenda is monitored by a comprehensive dataset published by the United Nations, which was introduced recently. In particular, 17 interdependent sustainable development objectives were established and specified by 169 targets, each of which is represented by 1–3 indicators. Overall, 231 indicators are used to measure compliance with the targets. Some of them are used repeatedly to describe progress in more than one target (UN Citation2017). The recency of the consensus on the goals to be measured, however, also implies a limited and incomplete dataset, which was stressed in the literature (Hák et al. Citation2016). Schmidt-Traub et al. (Citation2017) have tried to fill some of the gaps using unofficial data sources by creating the SDG Index, which is limited by world-wide comparability. Now, in one-third of the period monitored (2015–2030), the quality of the dataset is still quite insufficient in terms of data availability as many of the fields are blank.
The availability is highly heterogeneous both among the countries and the respective indicators. As a result, only a few studies have tackled the SDGs so far, and only some of them present the first evaluations of the initial progress in achieving the SDGs. Schmidt-Traub et al. (Citation2017) found significant differences in the starting points among countries around the world, although they concluded that every country has its weaknesses in different goals and needs specific improvement. Allen et al. (Citation2019); Bali Swain and Yang-Wallentin (Citation2020); and Zanten and Tulder (2020) stress that the implementation of the goals will require their hierarchization and focus on the most important priorities. Moreover, As Blanc (Citation2015) notes, many of the SDG goals are well interlinked, which creates the possibility to affect more than one goal with a single action.
In line with Schmidt-Traub et al. (Citation2017), as the SDGs were adopted by 193 countries: all members of the United Nations covering almost the entire inhabited world – it forms the most heterogenous group one can imagine. This heterogeneity implies that the initial social, economic and environmental conditions are crucial determinants in meeting the objectives. Some countries have started a long and difficult road full of reforms, while others have an easier starting position. The differences we can find both in the starting points and the steps to reach the desired state create the necessity for a regular and thorough evaluation of the progress.
Given the amount of input data, it is opportune to find the appropriate way for its representation in order to determine each country’s state in meeting the SDGs and what progress it has made since the SDGs were approved. Thus, not only accession to the SDGs agreement but also monitoring and control based on quality data and appropriate methodology are necessary to determine whether the measures taken correspond to the goals.
One approach is represented by Lafortune et al. (Citation2018), who published a methodological paper with a main focus on the percentage fulfilment of the SDGs and showed the average percentage performance and shift in time.
In our study, we propose to complement Lafortune et al.’s methodology with the DEA approach, which might help in creating a more complex view on achieving the SDGs with respect to the inputs, i.e. the setting of the countries in the area of sustainable development, and considering individual goals not separately but as a system of individual goals. Moreover, with an appropriate structure of indicators, DEA enables to quantify not only the relative efficiency in reaching the SDGs, given the initial settings, but also the individual shortcomings of the countries in specific indicators with respect to the frontier.
The aim of this paper, then, is to determine how individual states manage to meet measurable SDGs in terms of their capabilities. In this research, the current situation of the individual states in achieving the SDGs will be monitored and, focusing on the time dimension in the data, their progress and the speed of the implementation of the SDGs will be traced. The aim of the paper is not to doubt the methodology and the results of Lafortune et al. (Citation2018); it aims to provide a complementary study supplying an alternative point of view on the ability to achieve the SDGs taking into account the countries’ capabilities.
Empirical strategy
In order to determine the current level in meeting the SDGs and the progress a country has made since the SDGs were approved, it is crucial to find appropriate methods of providing this kind of information. Lafortune et al. (Citation2018) present the average percentage performance and shift in time. This approach is simple and universal, less data demanding, and it can technically work with gaps in the data. On the other hand, it has the following limitations: (i) averaging normalised variables, the information on how much countries should improve in the individual indicators cannot be obtained. (ii) Next, it also does not consider the initial settings of the individual countries. As the SDGs were adopted by 193 countries, there is a considerable heterogeneity within the dataset. Some countries may have significantly better indicators compared to other countries, so the process of achieving the goals is relatively easier. On the other hand, the countries who had a much worse situation in 2015 may have problems with fulfilling the SDGs despite their efforts. Moreover, some of them have started a long and difficult road full of reforms. The initial social, economic and environmental conditions are, thus, crucial in evaluating how and to what extent an individual state meets the objectives. (iii) The averaging also reduces the differences among indicators, with significantly better and significantly worse indicators within one group suppressing this kind of information. (iv) Last, averaging does not address the linkages between the goals. To sum up, percentual averaging provides information on the current situation, its relative distance to the goal and the trend showing the potential ability of a country to achieve the SDGs in 2030, but it does not reflect the information about the capabilities of the individual countries regarding their initial situation, nor does it discuss particular indicator details, recommendations and their interconnectedness.
Using the DEA approach, we offer this additional information. We compute the relative efficiencies in achieving the SDGs with respect to the countries’ settings in the area of sustainable development taking into account the interconnectedness of their individual goals. It is possible to quantify individual shortcomings given the country’s initial situation and capabilities. In more detail, we identify how far the country is from the required optimum given the set of countries and indicators, and the pace and capability to move to the frontier, i.e. to reach the SDGs by 2030.
On the other hand, we admit the shortcomings of this approach. It is sensitive to the lack of observations, to the number of indicators included in the DEA, to the classification of variables as inputs and outputs and to the possibility of setting a technical optimum. The technical optima to which the results are sensitive must also be determined with care respecting the SDGs. Therefore, it is necessary to work precisely and carefully with the data and their categorisations.
To conclude, we are convinced that the DEA approach might enrich the current studies by determining the imaginary distance from the target with respect to the countries’ capabilities and so address three issues: (i) it provides information on the current state, i.e. how efficient each country with its capabilities is relative to the technical optimum; (ii) it traces the direction and speed of the implementation of the strategies towards the SDGs from 2015 to the present, both of which serve to reflect whether the current strategy, if continued, leads to the timely achievement of the goals given the initial situation and thus the capabilities of the country; and (iii) it provides guidance for a possible revision of the strategies for achieving the SDGs by 2030. We therefore offer an alternative perspective on achieving the SDGs, which reduces the information loss as we do not use techniques such as standardising, normalising and averaging. We so do not contest the methodology and results of Lafortune et al. (Citation2018) but provide additional information on the ability of achieving the SDGs taking the countries’ capabilities into account, therefore forming a more complex view on achieving them.
In order to assess the individual country’s relative efficiencies, i.e. the country’s ability to achieve the SDGs relative to other countries, we perform a dual input-oriented DEA, in particular the BCC model (Banker et al. Citation1984). The BCC model restricts the CCR model with constant returns to scale (CRS) allowing for variable returns to scale (VRS). It adds a convexity constraint to guarantee that an inefficient decision-making unit (DMU) is compared only to a DMU of a similar size. If m inputs and r outputs for each DMU (a particular country, in our case) are assumed, the model for the qth DMU can be formally written as:
where n is the number of DMUs; X={xij i=1,…,m;j=1,…,n} is a matrix of inputs; and Y={yij i=1,…,r;j=1,…,n} is a matrix of outputs. θq is the relative efficiency of the qth DMU; ε is an infinitesimal that standardly equals 10–8; s+ and s− are input and output slacks, respectively; λ is a vector of weights; xq is the qth column of matrix X, and yq is the qth column of matrix Y, representing the inputs and outputs of qth DMU, respectively; and 1ʹ is a row vector with all the elements equal to 1.
Consequently, the ability to reach the SDGs by 2030 is computed. The solution to the question whether the countries can reach the SDGs by the target year 2030 is derived from relative efficiency dynamics. The relative efficiency trend is estimated by the OLS regression and, assuming the continuation, the resulting year of the SDGs achievement is calculated.
Data
Regarding the SDGs achievement, reliable and adequate data is crucial to describe in which situation each particular country is relative to the optimum. This may consequently help in tracking the progress and reaching the goals more easily. Analysing the efficiency in reaching the targets, however, requires attention to be paid to the following specifics in the dataset.
Several methodological problems in the dataset may be identified. The number of indicators may thus change during the monitored period of 2015–2030, shedding different light on the fulfilment of the particular target. The methodology may also change over time and vary among the countries, as it may vary in the quality of data collection. Despite the comparability in time and the space problems, we respect the goals as set by the UN, and we do not question their content, nor do we include other indicators or data sources, and we also do not cluster them. Only several indicators needed to be weighted in order to achieve comparable results.Footnote1 Overall, we base our research purely on official data published by the UN, although we are aware of data incompleteness. In our analysis, we use the same set of indicators throughout the whole time span analysed to achieve comparable results.Footnote2 The data range between 2015 and 2019 and cover 172 countries.
For our analysis, we employ the same set of indicators that can be measured and for which an unambiguous technical optimum can be defined. The SDGs are represented by technical optima that are set as follows:
If measurable targets are directly defined, the absolute quantitative thresholds of the SDGs are used (e.g. goal two defines the aims to end hunger; thus, the indicator 2.1.1 prevalence of undernourishment should be 0), otherwise we proceed as follows:
(i) For gender or age parity issues, we consider the target of the same representation of the individual groups. The technical optimum then represents a 0 deviation from this optimal distribution.
(ii) If the goal does not specify a measurable target to reach, we use a hypothetical 100% achievable value. (e.g. target 11.5 aims to reduce the adverse environmental impact with respect to air quality. The technical optimum for the corresponding indicator, the mean levels of fine particulate matter, is set to 0, i.e. the best possible performance.)
(iii) If it is not possible to explicitly set a specific target numerically, we use the principle of no one left in front or behind for the maxima and minima, respectively. In other words, the values of the best and worst performers are used. This principle is also used if the SDG is exceeded by at least one country. This addresses the motivation of the countries to improve the indicators even when the optimum is reached. The technical optimum is then increased according to the best performer after reaching the original technical optimum. Moreover, this step helps to avoid the optical masking of weaker indicators by those that are successful and above the optima.
As DEA cannot work with multiple optima, all the indicators with selective goals that do not have a common goal are excluded.
In order to also emphasise the distance from the worst possible performance, we define the technical minimum, which is based on the analogic decision-making process setting the opposite extreme from the scale.
According to the optima definition, all the variables that should be minimised are defined as inputs, and all the others as outputs. The final list of inputs and outputs and their summary statistics can be seen in .
Table 1. Descriptive statistics – inputs
Empirical analysis and results
As mentioned above, the paper aims to evaluate how efficient individual countries are relative to the optima and other countries in achieving the SDGs and to map countries progress towards the goals. First, the current state of relative efficiencies in terms of the SDGs must be evaluated. Using a DEA approach, we calculated the efficiency in achieving the SDGs ranging between 0.022 and 0.998. Finland, Japan and Iceland are the only countries whose relative efficiency score exceeds 0.9. Finland almost managed to reach the highest possible score and is considered the most efficient in terms of reaching the goals evaluated in this paper. The country excels in ecological issues and has a high-quality sanitation and health-care system and an above-average infrastructure.
On the other hand, our analysis showed Central African Republic, Pakistan and Nigeria to be the worst performers with a maximum DEA score of 0.025. The general problems for countries with low efficiency are health care and sanitation issues, an underdeveloped infrastructure and ecological issues, such as deforestation.
The complete overview of the resulting DEA efficiencies can be seen in and also in . In our analysis, a considerable skewness with the highest frequencies with low DEA scores can be detected. That is there are many countries that are not very efficient in reaching the SDGs relative to more efficient countries. The latter group consists of high-income European countries plus Asian best performers, like Japan, Singapore and Korea. The least-efficient countries are low-income countries mainly in Africa.
Figure 1. Calculated DEA efficiencies for 2019
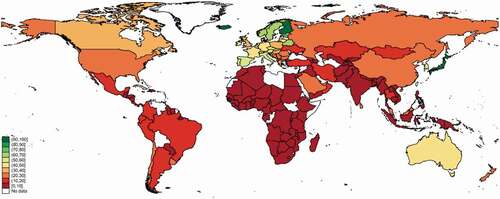
For further analysis, we divided the countries into groups using the World Bank classification according to the income level and geographical location.
In general, the DEA scores on average correspond to the level of economic development; however, the heterogeneity within each group varies considerably. As seen in , with an average DEA score of 0.426, the high-income group countries reached on average the highest scores, while the lowest mean (0.038) can be seen in the group of the least-developed countries. The group of low-income countries is very homogeneous in terms of the DEA results. The only outlier and also the best performer in this group is Syria, which reaches almost a double relative efficiency score compared to the second-best performer in this income group. Moreover, Syria’s DEA score is greater than both the minimum and the mean score of lower middle-income countries and the minimum score of upper middle-income countries.
Table 2. Average DEA scores by income group and region
The greatest span of relative efficiencies can be seen among the high-income countries where a specific subgroup of countries with relatively low estimated efficiency scores can be identified. These are tropical islandic Trinidad and Tobago, Mauritius, Panama, Seychelles and Barbados, all being a part of the Commonwealth of Nations with the lowest relative efficiencies ranging from 0.085 to 0.124.
In the upper middle-income group, the lowest score (0.03) was achieved by Equatorial Guinea with a considerably high difference from the second worst performer Gabon (0.043). At the other extreme of the group, our DEA approach identified Belarus and Monte Negro as the clear outliers as they are unequivocally the most efficient countries in this income group with comparatively high scores of 0.692 and 0.609, respectively. Overall, the Balkans and some post-Soviet countries are among the best-performing states in this income group.
The groups of low-income and lower-middle-income countries are mixed in terms of the relative efficiencies, even if the average score corresponds to this classification. The overall worst results, as mentioned above, were achieved in Central African Republic, Pakistan and Nigeria. The latter two are, however, classified as a low-middle income group.
The differences in the DEA scores are also remarkable vis-à-vis the geographical groups identified by the World Bank.
The highest scores are reached by European and Central Asian countries followed by North American countries. The latter countries never became the worst in any of the SDGs achievements, while the results in European and Central Asian countries deviate throughout the region as the region is very broadly defined in terms of culture and socioeconomic outputs. The lowest relative efficiencies are detected in sub-Saharan Africa with a mean of 0.042.
The resulting efficiency scores achieved by the East Asia and Pacific and the Middle East and North Africa regions present the values of 0.21 and 0.155, respectively. One outlier, Israel, was detected, which increases the average DEA score with the double value compared to the second-best: Qatar and Saudi Arabia. The East Asian region is highly heterogenous with very developed and, in terms of our analysis, sustainable economies, such as Japan, Singapore or South Korea. The lower scores are achieved mostly by Polynesian states.
Dynamics of achieving the SDGs
The second part of the analysis is dedicated to the dynamic progress in achieving the SDGs. It aims to assess the velocity of achieving the SDGs and verify whether the countries analysed are on track to reach them by 2030. In general, our model detected a generally positive shift towards the sustainability goals. Almost all the countries can be seen below the red line in , which means that their relative efficiency score in 2019 was higher than their score computed for 2015. Thus, the general movement towards the SDGs is positive, but in a vast majority of the countries analysed, the magnitude of the movement is negligible. We also found that some countries have a negative improvement in terms of reaching the SDGs, namely the Czech Republic, Brunei, Mauritius, Portugal, Fiji and Oman.
Figure 2. Progress in achieving the SDGs between 2015 and 2019
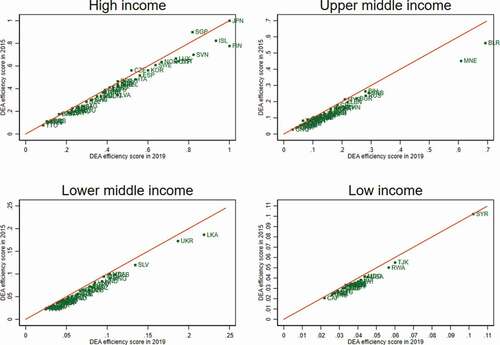
The improvement differs among the groups of countries. In terms of an absolute shift (), we see that the high-income group made the biggest progress towards meeting the SDGs. Even though the high-income countries experienced the most significant absolute improvement in their DEA score (0.030 on average), their relative change was the poorest one (7.6%). Indeed, their room for improvement is smaller as the mean relative efficiency is quite high (see ). However, one might ask whether the rich countries with the greatest resources are doing enough to fulfil their commitments. Comparatively, the greatest relative change was realised by the upper-middle countries with a relative change of 10.7%. Progress in the relative efficiency of the low-income group is particularly small. In terms of the absolute and relative change, this group of countries stays behind the rest of the world.
Table 3. Descriptive statistics of DEA scores by income group and region
Evaluating the regional progress, the greatest absolute improvement is detected in Europe and Central Asia (0.041) followed by North America with a half change (0.018), while the lowest changes are in sub-Saharan Africa (0.003) followed by East Asia and Pacific (0.005), Latin America and the Caribbean (0.010). The Middle East and North Africa as well as South Asia improved their efficiency score by 0.011 on average. The last mentioned, however, experienced the greatest relative progress (13.8%) compared to 2015. The second fastest relative progress took place in Europe and Central Asia (11.6%).
Using the DEA results, we estimate an initial trend towards the SDGs, which every country has either begun or continued in. In particular, the trend of the DEA efficiency change was estimated using linear regression (OLS model) in all the countries analysed. This initial trend should indicate whether a particular country is on track to meet the goals by at least 2030. The general results are depicted in . The higher the estimated number, the higher the speed in meeting the goals. As seen on the map, most of the countries of the world keep a mild pace in the range of 0–0.1 in the estimated trend. Only a few countries are green, which means relatively fast growth in the relative efficiency.
Figure 3. Trend in DEA efficiency growth towards meeting the SDGs
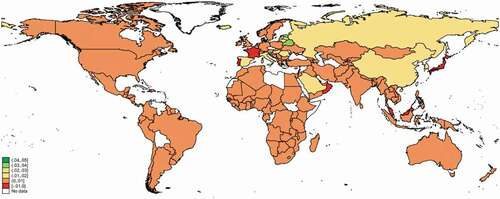
Consequently, using the initial trend, we estimate the year in which the computed relative efficiency may be equal to 1. This evaluation should not be interpreted as a prediction; it can be understood as a simplistic measure regarding whether a country makes enough effort to meet the SDGs or whether its structural change is insufficient.
As reported in , we estimated only five countries reaching the relative efficiency of 1 by 2030. The most successful of them, Finland, is expected to reach the SDGs very soon. Countries like Singapore, Iceland or Slovenia have a sufficiently positive trend to reach the SDGs by 2030. Montenegro and Luxembourg are expected to reach the goals within the next decade. On the other hand, many other countries seem to be struggling with reaching the goals: 134 are not expected to reach the relative efficiency by the end of the century, and 69 of them are developed high-income or upper-middle-income countries.
Table 4. The expected year of achieving the SDGs (countries achieving the SDGs target and the following top 10 countries)
Table 5. DEA efficiency scores in 2019
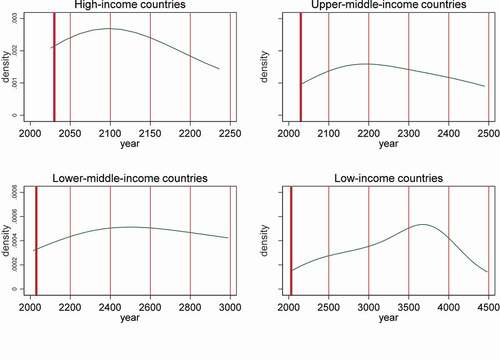
The resulting years differ among the individual countries, but differences can be also seen among the income groups. As expected, the burden of low-income countries in terms of their initial conditions and their possibility of improvement prevents the majority of these countries from reaching the SDGs by 2030, as depicted in . Nevertheless, their trend in the growth of the relative efficiency is also not very steep. The majority of high-income countries and upper-middle-income countries will achieve the SDGs by 2150 and 2300, respectively. As expected, the lower-middle-income and low-income countries when continuing with their current developments will be able to achieve the SDGs much later.
Figure 4. Year of achieving the SDGs according to the income groups
Conclusions
The paper aims to assess how countries are efficient in approaching the SDGs and whether they can fulfil their commitments by 2030 if continuing with their current strategies. As the topic is recent and thus the availability of data is limited, only a few studies contribute to this field. This study proposes a new insight into the measurability of fulfilling the goals. It applies DEA to compute how individual countries are efficient relative to the targets and other countries in achieving the SDGs. That is, we estimate how far the countries are from the efficiency frontier. We aim to provide additional information to complement Lafortune et al. (Citation2018)’s percentage fulfilment of individual goals. The approach of Lafortune et al. (Citation2018) and the DEA approach can thus be understood as two complementary views of the SDGs fulfilment – the first focuses on the percentage fulfilment of the SDGs showing the average percentage performance and shift in time. But averaging and normalising absorb many details, and the study neither provides information on how much countries should improve in the individual indicators, nor does it address the interconnectedness of the goals. Similar to Lafortune et al., the latter computes the actual state in achieving the SDGs and the trend towards the optimum. Moreover, the actual state is computed based on the countries’ capabilities and initial settings relative to the optimal state and the other countries, all without losing individual information. Also, by tracing the direction and speed of the implementation of the SDGs, we identify the countries that should be able to reach the SDGs by the targeted year 2030.
In the ability to achieve the SDGs, according to the DEA approach, the best performers are the developed countries, such as Finland, Japan and Iceland; the countries that can make the best use of their potential given their limiting conditions. The sub-Saharan countries are the worst off, from the DEA perspective. In general, improvements regarding the SDGs fulfilment are quite slow and, according to the current trend, only five countries will meet their commitments.
The performance in the various SDG areas shows the dependence on the individual countries’ income. In particular, the infrastructure and health goals seem to improve with income, as confirmed by Lopez-Casasnovas et al. (Citation2007); Baird et al. (Citation2011); Todaro and Smith (Citation2015); Murray and Koehring (Citation2019), while the ecological outputs generally correspond to the Environmental Kuznets Curve (Halkos Citation2003; Mills and Waite Citation2009; Issever Grochová Citation2014). The countries with low economic levels produce relatively small environmental burdens, but along with the growth of their economic levels, their produced ecological burden is also growing. However, this applies only to a certain point. At a certain economic level, preferences in society begin to turn towards environmental issues, which results in the higher environmental sustainability of advanced economies (which is also confirmed by Bali Swain and Yang-Wallentin (Citation2020)). The achievement of other goals does not seem to correlate with income but can be determined by other factors, such as location, religion, culture or local problems and interests.
The multidimensionality and complexity of the SDGs, however, bring about new issues that must be considered. The most crucial question points to the contradiction of some of the goals. Essentially, fulfilling social and environmental goals may be hindered by many trade-offs, as noted by Allen et al. (Citation2019). On the other hand, there are valuable opportunities to accelerate progress by examining the interlinkages across the SDGs. For example, the aim to tackle climate change requires a shift to clean energy, reversing the trend in forest loss, and changing our production and consumption patterns. Promoting sustainable agriculture can help reduce both hunger and poverty since close to 80% of those who are extremely poor live in rural areas. Increasing access to safe drinking water, sanitation and hygiene can save millions of lives per year, which, in turn, can enhance economic development (Gallardo-Albarrán Citation2018). Another important task is to provide education and improve school attendance worldwide. Improving proficiency in reading and mathematics of some 200 million children who are falling behind in sub-Saharan Africa will help them climb out of poverty and ultimately enable the region to better compete in the global marketplace (Gyimah-Brempong Citation2011).
To conclude, comprehensive, reliable and spatially comparable data together with an understanding of the determinants of the SDGs achievement, as well as their interconnectedness, may help in improving the strategies towards sustainable development as defined by the UN which, in turn, creates space for further research.
Disclosure statement
No potential conflict of interest was reported by the authors.
Notes
1. Namely, indicator 3.4.1 ‘The number of deaths attributed to non-communicable diseases’ is calculated per 1000 inhabitants; indicator 9.1.2 ‘Freight volume’ is calculated per 1,000,000 km2; and indicator 9.1.2 ‘Passenger volume (passenger kilometres)’ is calculated per 1,000,000 inhabitants.
2. This solves the sensitivity of DEA to changes in inputs and outputs definition and to changes in their quantity.
References
- Allen C, Metternicht G, Wiedmann T. 2019. Prioritising SDG targets: assessing baselines, gaps and interlinkages. Sustainability Sci. 14(2):421–438. doi:https://doi.org/10.1007/s11625-018-0596-8.
- Baird S, Friedman J, Schady N. 2011. Aggregate income shocks and infant mortality in the developing world. Rev Econ Stat. 93(August):847–856. doi:https://doi.org/10.2307/23016081.
- Bali SwainR, Yang-Wallentin F. 2020. Achieving sustainable development goals: predicaments and strategies. Int J Sustainable Dev World Ecol. 27(2):96–106. doi:https://doi.org/10.1080/13504509.2019.1692316.
- Banker RD, Charnes A, Cooper WW. 1984. Some models for estimating technical and scale inefficiencies in data envelopment analysis. Manage Sci. 30(9):1078–1092.
- Blanc DL. 2015. Towards integration at last? The sustainable development goals as a network of targets. Sustainable Dev. 23(3):176–187. doi:https://doi.org/10.1002/sd.1582.
- Brundtland GH. 1987. Report of the world commission on environment and development: our common future. Oxford: Oxford University Press.
- Deneulin S, Shahani L, eds. 2009. An introduction to the human development and capability approach: freedom and agency. London: Earthscan. https://idl-bnc-idrc.dspacedirect.org/bitstream/handle/10625/40248/IDL-40248.pdf?sequence=1&isAllowed=y
- Gallardo-Albarrán D. 2018. ‘Health and economic development since 1900ʹ. Econ Hum Biol. 31(September):228–237. doi:https://doi.org/10.1016/j.ehb.2018.08.009.
- Grochová L. 2014. Regulatory quality and sustainable economic development. Acta Universitatis Agri Et Silviculturae Mendelianae Brunensis. 62(6):1301–1308. doi:https://doi.org/10.11118/actaun201462061301.
- Gyimah-Brempong K. 2011. Education and economic development in Africa*. African Dev Rev. 23(June):219–236. doi:https://doi.org/10.1111/j.1467-8268.2011.00282.x.
- Hák T, Janoušková S, Moldan B. 2016. Sustainable development goals: a need for relevant indicators. Ecol Indic. 60(January):565–573. doi:https://doi.org/10.1016/j.ecolind.2015.08.003.
- Halkos GE. 2003. Environmental Kuznets Curve for Sulfur: evidence Using GMM estimation and random coefficient panel data models. Environ Dev Econ. 8(4):581–601. doi:https://doi.org/10.1017/S1355770X0300317.
- Jan Anton van Z, van Tulder R. 2020. Towards nexus-based governance: defining interactions between economic activities and sustainable development goals (SDGs). Int J Sustainable Dev World Ecol. 1–17. doi:https://doi.org/10.1080/13504509.2020.1768452.
- Lafortune G, Fuller G, Moreno J, Schmidt-Traub G, Kroll C. 2018. ‘SDG index and dashboards detailed methodological paper’. 2018. [accessed 2020 Sep 03] https://www.sustainabledevelopment.report
- Lopez-Casasnovas G, Rivera B, Currais L. 2007. ‘Health and economic growth: findings and policy implications’. MIT Press Books. The MIT Press. ISBN: 0-262-62212-2
- Meadows DH, Meadows DL, Jørgen Randers WW, Behrens JR, Behrens W. 1972. The Limits to Growth. New York: Universe Books. http://www.donellameadows.org/wp-content/userfiles/Limits-to-Growth-digital-scan-version.pdf
- Mills JH, Waite TA. 2009. Economic prosperity, biodiversity conservation, and the environmental kuznets curve. Eco Econ. 68(7):2087–2095. doi:https://doi.org/10.1016/j.ecolecon.2009.01.017.
- Murray S, Koehring M. 2019. ‘the economist: the critical role of infrastructure for the sustainable development goals | FNTP’, 2019. [accessed 2020 Nov 11] https://content.unops.org/publications/The-critical-role-of-infrastructure-for-the-SDGs_EN.pdf
- Sachs J, Schmidt-Traub G, Lafortune G. 2020. Speaking Truth to Power about the SDGs. Nature. 584(7821):344–345. doi:https://doi.org/10.1038/d41586-020-02373-7.
- Schmidt-Traub G, Kroll C, Teksoz K, Durand-Delacre D, Sachs JD. 2017. National baselines for the sustainable development goals assessed in the sdg index and dashboards. Nat Geosci. 10(8):547–555. doi:https://doi.org/10.1038/ngeo2985.
- Todaro, MP, Smith SC. 2015. Economic Development, 12th Edition. 12th edition. Harlow: Trans-Atlantic Publications. ISBN 978-1-292-00297-2
- UN. 2013. ‘A life of dignity for all: accelerating progress towards the millennium development goals and advancing the United Nations development agenda beyond 2015ʹ. [accessed 2020 Oct 26]. https://www.unodc.org/documents/about-unodc/Post-2015-Development-Agenda/A_Life_of_Dignity_for_All1.pdf
- UN. 2017. ‘Resolution adopted by the general assembly on 6 July 2017: global indicator framework for the sustainable development goals and targets of the 2030 agenda for sustainable development’. [accessed 2020 Oct 22] https://undocs.org/A/RES/71/313