
 ?Mathematical formulae have been encoded as MathML and are displayed in this HTML version using MathJax in order to improve their display. Uncheck the box to turn MathJax off. This feature requires Javascript. Click on a formula to zoom.
ABSTRACT
With 2.5 global hectares (gha) per capita against 2.7 gha per capita, China’s ecological footprint is desirably below the world’s average ecological footprint per capita. Undesirably, the country’s per person ecological footprint outweighs the world’s average biocapacity per person of 1.7 gha, thus signifying an enormous pressure on the country’s ecological capacity. This reason accounts for the motivation to explore the dynamics of ecological footprint for China over the period 1971–2016 by employing a series of empirical techniques that include quantile-on-quantile regression (QQR), spectral Granger causality (SGC), and quantile regression. Indicatively, the empirical findings are in folds. First, from the QQR, economic growth exerts a positive effect on (i) ecological footprint especially in the middle quantile (0.4–0.7) and (ii) all quantiles (0.01–0.95) of economic growth. Second, both fossil fuel and primary energy utilization exert a positive impact on (i) all quantiles (0.01–0.95) of ecological footprint and (ii) all quantiles (0.01–0.95) of the two energy profiles. Third, it is surprising to see renewable energy utilization exerting a positive effect on ecological footprint at the lower tail (0.1–0.40) and on renewable energy use at the higher tail (0.70–0.95). Additionally, the SGC result revealed Granger causality from primary energy use and economic growth to the ecological footprint in the long-run without reverse. Additionally, without reverse, there is a Granger causality from renewable energy use to the ecological footprint in the short-, medium-, and long-term. Importantly, the overall policy implication suggests a more drastic decoupling of the country’s growth from the supply side (ecological pressure and environmental deprivation).
1. Introduction
Lately, several studies have drawn the attention of all and sundry to the issues of rising greenhouse gas emission (GHG) especially carbon emission as a major factor contributing to the degradation of the environment (IPCC Citation2007, Citation2018). Notwithstanding, environmental degradation remains one of the major challenges confronting policymakers and authorities around the globe in the 21st century. Although environmental degradation exists as a global phenomenon, the magnitude and consequences of degradation vary from one location to another even as the commitment to environmental protection differs among countries around the globe vis-à-vis pledges towards emission reduction as outlined in the Paris Agreement (UNEP Citation2018; IPCC Citation2019).
As such, there have been increasing calls for nations to do more to protect the environment especially for those at the forefront of the global GHG emission including countries like China, the US, the EU, and India among others.Footnote1 The use of carbon emission proxy for environmental degradation has dominated the scope of empirical literature being an important pollutant. However, the scope of environmental degradation covers broader forms of environmental destruction which extends beyond GHG emissions alone, to include adverse environmental effects of all kinds of activities by humans on the biosphere as encapsulated in the framework of the ecological footprint.
An ecological footprint is a scientific accounting indicator that addresses the concern of how much natural resources should be utilized within the scope of the earth’s regenerating capacity and it is measured based on the amount of biologically productive area that can support resources consumption in a unit called global-acres (GFN, Citation2018). While cutting carbon emission levels stands to save the world from a global climate disaster (IPCC Citation2018), zero net emission alone may not necessarily connote an immediate degradation-free environment, at least when considering the havoc wrecked by humans’ activities on the biosphere. Around 25% of global ice-free land is prone to degradation as human activities directly impact over 70% of the earth’s surface that is free of ice (IPCC Citation2007, Citation2019). As such, viewing environmental degradation from the perspective of ecological footprint has been gaining more popularity by the day since the 1990s when it was introduced as a yardstick for assessing and monitoring natural resources utilization towards ensuring environmental sustainability (GFN, Citation2018). The footprint indicator takes into cognizance several components including biologically productive areas covering forest and croplands, land resources, energy use, carbon emissions, and population among others.
China with a population of about 1.402 billion people (WDI, Citation2020), has witnessed incredible economic growth over the years as the Asian giant continues to push for its vast industrialization agenda that requires a large-scale energy demand that has positioned the country as the largest consumer of energy in recent time (IEA, Citation2019; Shan et al. Citation2020; Wei et al. Citation2020). According to available data from the International Energy Agency (IEA, Citation2019), electricity demand in China reached 6330terawatt-hours (TWh) in 2018 representing more than half of the total demand for the Asia Pacific region and about 27.48% of the global electricity demand as seen in of the Appendix A.
Offsetting such a huge energy demand in China requires more resources utilization and this poses important implications for the quality of the environment. For instance, fossil energy sources (mainly coals) account for a major chunk of the energy production and the current energy mix has triggered calls for China to do more on addressing pollution (Hao et al. Citation2015; Wu et al. Citation2018; Miller et al. Citation2019; Li et al. Citation2020; Yuping et al. Citation2021). The country currently retains the top position among global GHG emitters with a rising ecological footprint as biocapacity gradually declines over the years. The study of Chen et al. (Citation2007) revealed that the ecological footprint per capita has constantly surpassed the biocapacity even as the footprint intensity grew steadily between 1981 and 2001.
The challenges of environmental degradation are global issues of concern but the attendant consequences are often pronounced in developing and rapidly emerging economies where energy demand has nearly tripled right from the early 2000s (IEA, Citation2019). Hence, more extensive studies in the country-specific case of China are justifiable as far as combating global environmental challenges are concerned giving the leading roles China plays in global energy use. Besides, it has been noted that policy framework on the energy mix in many rapidly emerging economies vis-à-vis energy demand, its determinant, and implications have received insufficient academic attention as a result of lack of sufficient disaggregated data and the low number of local scholars among other factors (Wei et al. Citation2020). Recently few studies have been conducted (e.g. Yan et al. Citation2019, Citation2020; Dong et al. Citation2020; Cheng et al. Citation2021; Adebayo et al. Citation2021; Adebayo and Acheampong Citation2021; Gyamfi et al. Citation2021a) investigating determinants of environment degradation using quantile analysis. However, more studies are needed as rapidly emerging economies like China continues to actively pursue their environmental agenda and emission reduction targets.
Given the afore highlighted background information, the present study distinguishes itself from extant works by applying a battery of advanced econometric methodologies to analyze the nexus of ecological footprint with energy use, fossil fuel, and renewable energy consumption in China as the leading energy consumer. This study contributes to the literature in the following ways: to the authors’ knowledge, this is the first empirical study to employ Sim and Zhou’s (Citation2015) QQ technique to assess the influence of fossil fuel, primary energy use, economic growth, and renewable energy utilization on ecological footprint in China. Adebayo and Kirikkaleli (Citation2021) claimed that econometric procedures are critical for producing impartial research results, and they propose utilizing sophisticated new econometric techniques. Thus, we applied the novel QQ approach. This technique is utilized because it combines the ideas of quantile regressions (QR) with non-parametric estimate analysis, the QQ approach is thus beneficial. The QQ method is resistant to outliers and can take into account slope heterogeneity. Secondly, the literature review suggests that most empirical studies are based on panel data modeling techniques. Although estimates from panel data techniques are efficient, their conclusions and policy implications may not apply to individual countries due to their heterogeneities (Adebayo et al. Citation2021). Exploring these advanced second-generation approaches helps to circumvent econometrical pitfalls while generating robust estimates that provide well-inform recommendations and intervention policies for the Chinese authorities, policymakers, practitioners, and other stakeholders.
2. Literature review
Studies relating to the nexus of environmental quality with energy use, fossil fuel consumption, and renewable energy use have been on the increase in recent times (Shahbaz et al. Citation2020a; Alola and Ozturk Citation2021; Onifade et al. Citation2021a; Sadik-Zada and Ferrari Citation2020; Alola and Joshua Citation2020; Bekun et al. Citation2021b; Onifade et al. Citation2021b). Some of the studies in the growing literature have focused on China as a sample country (Hao et al. Citation2015; Sarkodie et al. Citation2020; Xia and Wang Citation2020; Shahbaz et al. Citation2020b; Li et al. Citation2021). Several studies have utilized the carbon emission level to represent environmental degradation for China study and the observed results vary with approaches and sample observations (Li and Yang Citation2016; Chen et al. Citation2019; Xia and Wang Citation2020; Jiang et al. Citation2021). On the other hand, some other studies have also utilized the ecological footprint proxy and come up with varying results (Destek and Sarkodie Citation2019; Yilanci and Pata Citation2020; Pata and Caglar Citation2021).
Li and Yang (Citation2016) examined the impacts of energy consumption on China’s carbon emission level. Their study focused on the effects of non-fossil energy consumption using the ARDL technique. The empirical outputs show that the consumption of non-fossil energy reduces carbon emission levels in China but only on a long-term basis. The carbon mitigating effect of non-fossil energy use is not visible in the short-run. Unlike Li and Yang (Citation2016) that focused only on energy consumption, Jiang et al. (Citation2021) explored the combined impacts of energy production and energy consumption on CO2 emission in China using a simultaneous equation modeling approach. The outcomes show that the two energy indicators induce carbon emission in China and are therefore encouraging environmental deterioration.
In another study, Chen et al. (Citation2019) examined the connection between carbon emissions, energy use (renewable and non-renewable), and economic growth in three regions of China (Central, Eastern, and Western regions). They applied the FMOL and DOLS approach for the regional panel analysis and observed that the impacts of energy consumption (renewable) differ from one region to another. While renewable energy consumption supports environmental quality in the Eastern and Western regions by reducing carbon emissions, it has no significant effect in the central region of the country. On the other hand, non-renewable energy (fossil energy) increases carbon emission with different levels of impact across the regions. These findings correlate with the submissions of Xia and Wang (Citation2020) that renewable energy consumption like hydropower reduces carbon emissions in China while fossil energy consumption creates damages in the environment from higher carbon emissions. However, the conclusions regarding the impacts of energy consumption on environmental degradation using carbon emission (CO2) proxy from the study of Chen et al. (Citation2019) and Xia and Wang (Citation2020) contradict the conclusion from the study of Pata and Caglar (Citation2021) that renewable energy use has no impacts on environmental degradation in China.
The study of Destek and Sarkodie (Citation2019) examined the impacts of energy consumption and economic growth on the ecological footprint of some selected newly industrialized countries. They discovered that economic growth Granger causes energy consumption and shows a two-way causality with the ecological footprint in China and other selected newly industrialized countries in the study. The results obtained only support a U-shaped environmental Kuznets curve (EKC) hypothesis nexus between growth and ecological footprint in China. In another study on China, Yilanci and Pata (Citation2020) also set out to validate the popular environmental Kuznets curve (EKC) hypothesis in China while exploring both short-term and long-term connections between energy consumption and ecological footprint in China. The study utilized the Fourier ARDL approach and the results show that energy consumption induces the ecological footprint in China and this observation was valid for both the short-term and long-term cases. Also, the EKC hypothesis was rejected for China as economic growth elasticity in the long-run exceeds the short-run elasticity. This outcome supports the findings of Destek and Sarkodie (Citation2019).
Overall, other techniques rather than the quantile approach have dominated empirical literature for the Chinese economy except for the studies of Mallick et al. (Citation2019), and Gyamfi et al. (Citation2021b). While the study of Gyamfi et al. (Citation2021b) focuses on the links between renewables and other energy sources on CO2 emission in the E7, on the other hand, the study of Mallick et al. (Citation2019) focuses on the nexus of carbon emissions and income distribution pattern in the BRICS economy. The results from the former show that CO2 emission is reduced by coal rent and renewable energy while the latter study shows that higher income levels reduce the quality of the environment in China and South Africa. Thus, Gyamfi et al. (Citation2021b), provide contrary evidence to the submission of Pata and Caglar (Citation2021) that renewable energy use has no impact on environmental degradation in China.
Although Gyamfi et al. (Citation2021b) follow the quantile approach in a direction that is different from others studies like Pata and Caglar (Citation2021), the study however follows the traditional QR approach. On the other hand, the current study distinguishes itself by utilizing the novel Sim and Zhou’s (Citation2015) QQ technique that aggregates the traditional (QR) approach with non-parametric estimate analysis alongside other sophisticated econometric procedures. Besides, findings from the two studies do not precisely provide a clear picture of an ideal country-specific dynamics of the Chinese economy as the analysis was done in the aggregated case of the BRICS economy and the E7 economy in the case of Mallick et al. (Citation2019) and Gyamfi et al. (Citation2021b) respectively. Furthermore, the majority of the extant studies have focused on the carbon emission perspectives of the environmental degradation of China, meanwhile, the prism of ecological footprint also stands to offer additional insightful perspectives.
Hence, the present study distinguishes itself by providing a robust analysis of the combined nexus of ecological footprint with energy use, fossil fuel, and renewable energy consumption in China as the leading energy consumer within the framework of advanced econometric methodologies including Quantile Cointegration, Quantile Unit Root, BDS Test, Quantile-on-Quantile (QQ) Regression, Quantile Regression (QR), and Spectral Granger Causality. Exploring the combination of these methodologies helps to tap into the novelty of the approaches thereby informing robust estimates that support proactive policy directions.
3. Data description and methodology
In this empirical analysis, we utilized data stretching from 1971 to 2016 to explore the influence of fossil fuel (FF), primary energy use (PE), and economic growth (GDP) on the ecological footprint (ECF) in China. In this study, the dependent variable is ecological footprint which is calculated as a global hectare (GHA) is obtained from the global footprint network (Citation2018). The independent variables are fossil fuel which is measured as a share of total energy and obtained from the World Development Indicator of the World Bank (World Development Indicator, Citation2020), renewable energy use is calculated in thousand tons (tonne of oil equivalent) as obtained from the Organization for Economic Co-operation and Development (OECD Citation2020) and economic growth is measured as GDP US$ is gathered from the database of World Development Indicator (Citation2020). The component estimates in this research are centered on the United Nations 9th, 15th, 13th 17th, 7th, and 8th sustainable development goals (SDGs). presents the study variables description. GDP has the highest mean value which is followed by ECF, REC, LF, and REC. The standard deviation is utilized to identify which variables have the highest level of consistency. The REC has the lowest value which illustrates that the scores are less spread out from the mean. Therefore, the score of REC is more consistent. The kurtosis value disclosed that all the series are platykurtic. The skewness value shows that REC and FF are skewed negatively while ECF, GDP, PE are skewed positively. The outcomes of the Jarque-Bera disclose that all the series conform to normality. In addition; we utilized the RADAR chat to present the series of descriptive statistics. Lastly, the flow of the empirical analysis is illustrated in .
Figure 1. Descriptive statistics with RADAR chat.
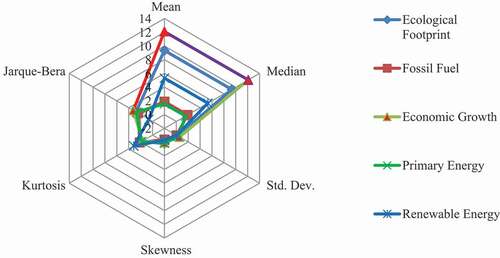
Figure 2. Flow of empirical analysis.
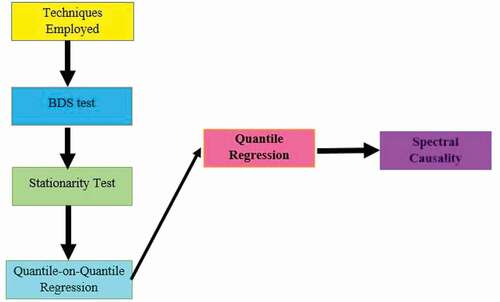
Table 1. Descriptive statistics
3.1. Methodology
In this current study, we utilized the novel Quantile-on-Quantile (QQ) technique initiated by Sim and Zhou (Citation2015) to assess the broad interrelationship between CO2 emissions and globalization use, economic growth, and coal consumption in Australia. This model is a refinement on traditional quantile regression, which emphasizes the influence of a single independent variable’s quantiles on the distinct quantiles of the dependent variable. The use of nonparametric estimations and quantiles is fundamental to this technique. To begin, traditional quantile regression is utilized to explore the impact of an independent variable on the dependent variable’s various quantiles. The traditional quantile regression technique is utilized as an enhancement to the traditional least square technique. Unlike the linear regression model, quantile regression investigates the impact of a variable not only on the conditional mean of the dependent variable but also on distinct quantiles. In this sense, the quantile regression model, rather than the least square method, gives a more comprehensive relationship.
Moreover, Cleveland (1979) and Stone (1977) propose using standard linear regression to explore the effect of the independent variable’s exact quantile on the dependent variable. Investigators can study the impact of different quantiles of the dependent variable on different quantiles of the dependent variable by combining these two techniques, namely conventional quantile regression and classic linear regression. As a consequence, rather than using standard techniques like OLS and simple quantile regression, combining these two approaches can assist in understanding the fundamental connection. Additionally, we use Sim and Zhou’s (Citation2015) Quantile-on-Quantile estimate to explore the effect of different quantiles of X on the various quantiles of Y using the following nonparametric quantile regression model.
Where illustrates dependent variable in period t,
illustrates the independent variable in time t.
is the
quantile on the distribution of X. Additionally,
depicts quantile error term, where estimated
quantile is equal to zero. Furthermore,
is unknown since no information is available on the relationship between X and Y. Moreover, understanding bandwidth selection is essential when utilizing nonparametric analysis. Finally, it is vital to understand bandwidth selection when doing nonparametric analysis. This bandwidth assists in the simplicity of the target point, the size of the quarter backgrounds, and, as a result, bandwidth gearshifts the pace of the conclusion. A large bandwidth, h, decreases variance whilst raising estimate deviation, and vice versa. We use a bandwidth value of h = 0.05 in this investigation, as advised by Sim and Zhou (Citation2015).
4. Empirical results
Before undertaking further analyses, it is critical to confirm the linear features of the series. We applied the BDS test suggested by Broock et al. (Citation1996) to identify the series nonlinearity features. The outcomes are presented in and the outcomes unveiled that all the series are nonlinear. Thus, utilizing linear methods such as DOLS, GMM, ARDL, FMOLS, and VECM, etc will generate inaccurate outcomes. The current study also investigates the series stationarity features by utilizing Zivot and Andrew (ZA) unit root test. Unlike several conventional stationarity tests, the ZA can detect both unit root and a single break simultaneously. The outcomes of the ZA test are depicted in . The outcomes disclosed that at level, all the series are nonstationary; nonetheless, after the first difference was taken, all the series are stationary.
Table 2. BDS test
Table 3. ZA unit root tests
4.1. QQ empirical results
The main empirical findings of the QQ approach of the effect of FF, GDP, REC, and PE on ECF in China are presented in this portion of the study. discloses the slope coefficient estimates, which catches the influence of the τth quantile of X on the θth quantile of Y, at various values of θ and τ for China. The QQ outcomes are illustrated in . The GDP influence on ECF is depicted in ). In all quantiles (0.01–0.95) of the combination of GDP and ECF, the effect of GDP on ECF is strong and positive; however, the influence is more pronounced in the middle tail (0.4–0.75) of ECF and GDP. Regarding the influence of ECF on GDP, the influence of ECF on GDP is weak and positive in all quantiles of ECF and GDP as disclosed by ). The FF influence on ECF is depicted in ). In all quantiles (0.01–0.95) of the combination of FF and ECF, the effect of GDP on ECF is strong and positive. Regarding the influence of ECF on FF, the influence of ECF on FF is weak and positive in all quantiles of ECF and GDP as disclosed by ).
The PE influence on ECF is depicted in ). In all quantiles (0.01–0.95) of the combination of PE and ECF, the effect of GDP on PE is weak and positive. Pertaining to the effect of ECF on FF, the influence of ECF on PE is positive in all quantiles of ECF and GDP as disclosed by ). The REC influence on ECF is depicted in ). In all quantiles (0.01–0.95) of the combination of REC and ECF, the effect of GDP on REC is significant and positive mostly in the higher tail (0.75–0.95) of REC and lower tail (0.1–0.4). About the effect of ECF on REC, the influence of ECF on REC is positive in the lower quantiles of REC (0.1–0.4) of REC and lower quantiles (0.1–0.4) quantiles of ECF; however, the influence of REC on ECF is weak and negative in the middle quantiles of ECF and middle quantile (0.1–0.4) of REC as shown by Figure h.
Figure 3. Quantile-on-quantile (QQ) estimates of the slope coefficient. (a): Impact of economic growth on ecological footprint. (b): Impact of ecological footprint on economic growth. (c): Impact of fossil fuel on ecological footprint. (d): Impact of ecological footprint on fossil fuel. (e): Impact of primary energy use on ecological footprint. (f): Impact of ecological footprint on primary energy use. (g): Impact of renewable energy use on ecological footprint. (h): Impact of ecological footprint on renewable energy use.
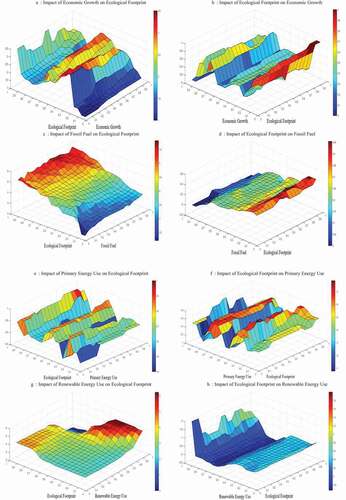
Figure 4. Comparison of quantile regression and quantile-on-quantile estimate. (a): Impact of economic growth on ecological footprint. (b): Impact of ecological footprint on economic growth. (c): Impact of fossil fuel on ecological footprint. (d): Impact of ecological footprint on fossil fuel. (e): Impact of primary energy use on ecological footprint. (f): Impact of ecological footprint on primary energy use. (g): Impact of renewable energy use on ecological footprint. (h): Impact of ecological footprint on renewable energy use.
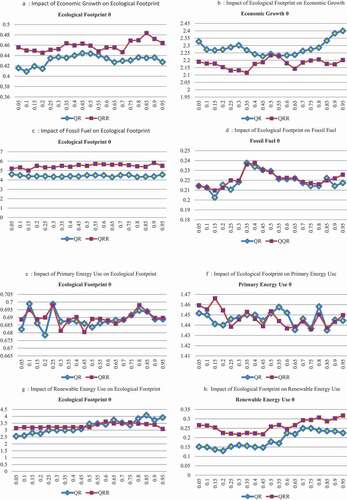
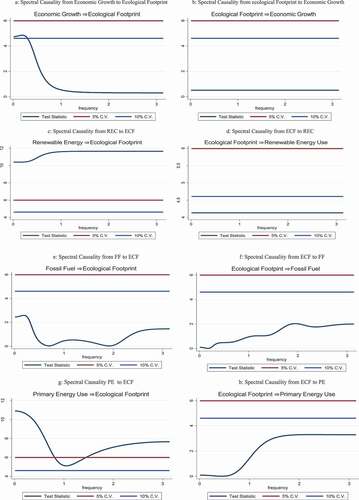
Figure 5. (a): Spectral causality from economic growth to ecological footprint. (b): Spectral causality from ecological footprint to economic growth. (c): Spectral causality from REC to ECF. (d): Spectral causality from ECF to REC. (e): Spectral causality from FF to ECF. (f): Spectral causality from ECF to FF. (g): Spectral causality PE to ECF. (h): Spectral causality from ECF to PE.
4.2 Robustness check
The graphs in show that irrespective of the quantile chosen, the averaged QQ estimates of the coefficient slope are very comparable to the QR estimates for China. This graphical proof revealed that the main characteristics of the QR model can be retrieved by illustrating the more extensive details found in the QQ estimates, including a clear justification of the QQ approach. Thus, ) affirms the outcomes of the QQ analysis reported above. The outcomes of the QR disclosed that at all quantiles; the impact of GDP on ECF is positive which is consistent with the QQ regression outcome. On the flip side, ) illustrates that the outcomes of the QR comply with the QQ outcomes which illustrates that that ECF influences economic growth positively. Furthermore, in ), the outcomes of the QR disclosed that FF influences ECF positively at all quantiles which comply with the QQ outcomes. On the other side, in ), the influence of ECF on FF is positive at all quantiles as revealed by both QR and QQ outcomes. This illustrates that the QR and QQ outcomes validate each other. Also, in ), the influence of PE on CO2 emissions is positive at all quantiles as revealed by both QR and QQ outcomes. In ), the effect of ECF on PE is positive at all quantiles as revealed by QR. Lastly, the influence of REC on ECF is positive in the majority of the quantiles as disclosed by the QR in ) which is also validated by the QQR outcomes. On the other hand, in ), ECF impacts REC positively in the lower and higher quantiles while the influence is negative in the middle quantiles as shown by QR outcomes which comply with the outcomes of the QQR.
The present study takes a further step by assessing the causal connection between ECF and the regressors (fossil fuel, economic growth, renewable energy, and primary energy use). presents the causal impact of GDP on ECF and the outcomes disclosed that at a 10% level of significance there is proof of causal connection from GDP to ECF in the long-term. On the other hand, the causal association from ECF to GDP is revealed by and the outcomes unveiled that at 5% and 10% level of significance there is no evidence of causal linkage between ECF and GDP. The outcomes from disclosed a one-way causal impact from GDP to ECF. ) presents the causal impact of REC on ECF and the outcomes disclosed that at a 5% level of significance there is proof of causal connection from GDP to ECF in the short and long-term. On the other hand, the causal association from ECF to REC is revealed by ) and the outcomes unveiled that at 5% and 10% level of significance there is no evidence of causal linkage between ECF and REC. The outcomes from ) disclosed a one-way causal impact from GDP to REC.
) presents the causal impact of PE on ECF and the outcomes disclosed that at 5% and 10% level of significance there is no proof of causal connection from FF to ECF at all frequencies. On the flip side, the causal association from ECF to FF is revealed by ) and the outcomes unveiled that at 5% and 10% level of significance there is no evidence of causal linkage between ECF and PE. The outcomes from ) disclosed no evidence of causality between FF and ECF. ) presents the causal impact of PE on ECF and the outcomes disclosed that at 5% and 10% level of significance there is proof of causal connection from PE to ECF at all frequencies. On the flip side, the causal association from ECF to PE is revealed by ) and the outcomes unveiled that at 5% and 10% level of significance there is no evidence of causal linkage between ECF and PE. The outcomes from ) disclosed a unidirectional causality PE to ECF.
5. Discussion of findings
The findings were discussed in this phase of the research. The results show that the effect of GDP on ECF is positive for all quantiles (0.1–0.95) of GDP and ECF. This implies that in the Chinese economy, the scale effect outweighs the technique and composition effects. Economic growth has increased economic activity, such as the use of natural resources and industrialization in all areas of the economy. As a consequence, ECF levels have increased and the ecology has degraded. Because the environment and growth are intimately connected, all economic activities are environmentally driven. Another explanation for GDP’s positive influence on ECF is the pace of economic development during the previous two decades. This result is most probably the result of the Chinese government’s strong attempts to expand the industrial sector and increase employment. Construction and manufacturing sectors are the two important subsectors of China’s industrial sector and have been identified as the world’s worst pollutants. Recent discussions indicate that, while economically advantageous, industrial growth has impacted environmental quality. China’s already unstable pollution levels have been worsened by increased growth and industrial activities. The outcome from this research complies with the study of Shan et al. (Citation2021) for highly decentralized economies. Furthermore, the study of Adebayo et al. (Citation2021) for Indonesia utilizing the wavelet coherence approach disclosed similar findings by establishing a positive association between economic growth and emissions. Additionally, the studies of Sarkodie et al. (Citation2021) for Argentina, Zhang et al. (Citation2021) for Malaysia, Su et al. (Citation2021) for Brazil; Kihombo et al. (Citation2021) for West Asia and Middle East nations, and the study of Adebayo et al. (Citation2021) for South Korea also affirmed the study’s findings. Nonetheless, using the novel quantile-on-quantile approach, the study of Rjoub et al. (Citation2021) refutes this finding by establishing a negative connection between GDP and CO2 emissions. Similarly, the findings of Dogan and Turkekul (Citation2016), Usman et al. (Citation2020), and Sarkodie and Strezov (Citation2018), refute this connection by establishing negative CO2-emission interrelationship.
Additionally, in all quantiles (0.1–0.90) combination of fossil fuel use and ECF, the effect of fossil fuel use impacts ECF positively. Also, in all quantiles (0.1–0.90) combination of primary energy use and ECF, the effect of primary energy use impacts ECF positively. All these outcomes are unsurprising considering that fossil fuels contribute to global warming by emitting CO2 and other GHGs emissions when burned, in addition to the energy generated. Notwithstanding its goal to achieve net-zero CO2 emissions by 2060, China continues to burn more coal than any other major economy, depending on fossil fuel to meet the country’s rising energy demand. Over the previous half-century, coal has been the primary energy source for China’s vast manufacturing-based economy. China’s coal consumption nearly tripled from 527 metric tons of oil equivalent (Mtoe) in 1990 to 1,951 Mtoe in 2019. Coal accounted for 57.7% of China’s energy consumption in 2019. The study of Shan et al. (Citation2021) for highly decentralized economies using datasets from 1990 to 2018 concurs with this finding by establishing a positive interconnection between fossil fuel and emissions. The studies of He et al. (Citation2021) for Mexico using data from 1990 to 2018 and Orhan et al. (Citation2021) for India utilizing data between 1965 and 2018 complies with this outcome by establishing a positive linkage between fossil fuel and CO2 emissions.
Surprisingly, in all quantiles (0.1–0.90) the effect of REC on ECF is positive at all combinations of REC and ECF. This demonstrates that an upsurge in REC mitigates the sustainability of the environment. The probable explanation for this association is that renewable use’ provides information about renewable energy composition in China and it shows that ‘Biomas’ use to have the highest share of renewable energy and this (biomass) especially through combustion exerts positive pressure of EFC. This outcome is consistent with the study of Pata (Citation2018) for Turkey who established that an upsurge in renewable energy consumption does not enhance the quality of the environment. However, this outcome contradicts the study of Pata and Caglar (Citation2021) for China who established an insignificant association between renewable energy use and environmental degradation. Furthermore, this study rejects the findings of Dogan et al. (Citation2019) for MINT nations and Usman et al. (Citation2020) who established an association of interrelationship between ecological footprint and renewable energy utilization.
The outcomes from the spectral causality test also disclosed unidirectional causality from economic growth, primary energy utilization, and renewable energy utilization to ecological footprint. This implies that economic growth, primary energy utilization, and renewable energy utilization can predict ECF majorly in the long term. This outcome is important for policy suggestions for policymakers in China. Thus, policy targeted at economic growth, primary energy utilization, and renewable energy utilization will significantly influence the ecological footprint in China.
6. Conclusion and policy
Considering the position of China in the global economic and political configuration, the urgency to revisit the examination of the dynamics of ecological footprint cannot be underplayed. While there is an increasing demand arising primarily from the dynamics in population (P), affluence (A), and technology (T) as opined in IPAT model, the supply-side (ecological components) is unavoidably under immense pressure to meet the escalating demand. To provide a new perspective on the dynamics of this supply-side vis-à-vis ecological footprint, this study examined the effects of economic growth, conventional and unconventional energy profiles, and primary energy utilization over the period of 1971 to 2016. In order to achieve the objective of this study, we employed the newly developed quantile-on-quantile regression alongside the spectral Granger causality, and quantile regression. Indicatively, the arrays of results from the investigation are outlined as follows:
The quantile-on-quantile regression result implies that economic growth exerts a positive and statistically significant impact on the ecological footprint in the middle quantile (0.4–0.7) and on all own quantiles. This implication of the result is that peaked pressure on the country’s ecological composite is largely attributed to economic expansion.
It is further revealed through the quantile-on-quantile regression that fossil fuel and primary energy utilization worsen ecological deprivation and environmental devastation. This is because fossil fuel and primary energy utilization increases ecological footprint in all the quantiles (0.01–0.95) as well as causing a trigger of energy profiles in all the quantiles.
Although the quantile-on-quantile regression revealed an unexpected outcome of the nexus of renewable energy utilization and ecological footprint, it is only experienced in the lower tail (0.010–0.40) of ecological footprint and higher tail (0.60–0.95) of renewable energy utilization.
Concerning the spectral Granger causality, there is a long-run Granger causality from economic growth to ecological footprint without feedback while the no feedback Granger causality from primary energy usage to ecological footprint is statistically significant in the medium- and long-term. Moreover, renewable energy Granger causes ecological footprint without feedback in all the periods (short-, medium, and long-run).
Moreover, robustness evidence that validates the aforementioned results was revealed by the quantile regression.
6.1. Policy matter
Already, the 2060 carbon neutrality policy target of the Chinese government is estimated to gulp a whopping $14.725 trillion, suggesting a significant financial commitment toward achieving carbon neutrality. Thus, the financial allocation for alternative energy development should be largely entrenched in policy for clean energy and greenhouse gas mitigation technologies such as carbon carbon sequestration and storage. Doing this should further minimize potential environmental damage arising from the enormous utilization of biofuels and waste energy (since the energy source is not totally free from environmental hazards) which currently has the largest share of the renewable energy portfolio.
Moreover, nuclear energy which is by far a clean source of energy is less developed in China possibly due to the associated high-risk factor. Notwithstanding, with a public-private partnership, ground-breaking research could unleash a low-risk nuclear energy generation. Other relevant policies akin to the environmental sustainability drive of the country should accommodate sustainable production and consumption without compromising economic growth and development. For instance, the implementation of the economic globalization policies of the Chinese government through the belt and road initiative (BRI) i.e One Belt One Road and other market penetration strategies of the new Asian powerhouse should be pivoted through the pathways of environmental sustainability.
Highlights
The study revealed the drivers of China’s ecology footprint.
Quantile-on-quantile regression and spectral Granger causality approaches were employed.
Economic growth exerts a positive effect in the middle quantile of ecological footprint.
China’s energy profile halts environmental sustainability in all quantiles.
At the lower quantiles of environmental sustainability, renewable energy utilization is hazardous.
Disclosure statement
No potential conflict of interest was reported by the author(s).
Notes
1. According to the United Nation emission gas report (Citation2018), global GHG emission is still on the rising trend and this increase is predominantly energy use (fossil fuels) and industrial production (cement) related, but it also includes land-use change related emission. The world’s total GHG emissions level increased in the year 2017 despite the short success of holding emission level constant for about 3 years in the preceding years. The total emission level rose to a new record of 53.5 gigaton of carbon dioxide equivalent (GtCO2e). The leading emitters being China accounting for more than 27% of global emissions, while the US, the EU, and India account for 13%, 9%, and 7.1% of the total GHG emissions respectively. Emissions from these nations jointly represent over 56% of the world’s emissions in 2017 (UNEP Citation2018).
ReferencesReferences
- Adebayo TS, Acheampong AO. 2021. Modelling the globalization-CO2 emissions nexus in Australia: evidence from quantile-on-quantile approach. Environ Sci Pollut Res. 1–16.https://doi.org/https://doi.org/10.1007/s11356-021-16368-y
- Adebayo, TS, Akinsola, GD, Bekun, FV, Osemeahon, OS, Sarkodie, SA. 2021. Mitigating human-induced emissions in Argentina: role of renewables, income, globalization, and financial development. Environmental Science and Pollution Research, 1–15. https://doi.org/https://doi.org/10.1007/s11356-021-14830–5
- Adebayo, TS, Akinsola, GD, Kirikkaleli, D, Bekun, FV, Umarbeyli, S, Osemeahon, OS. 2021. Economic performance of Indonesia amidst CO 2 emissions and agriculture: a time series analysis. Environmental Science and Pollution Research, 1–15. https://doi.org/https://doi.org/10.1007/s11356-021-13992–6
- Adebayo TS, Awosusi AA, Kirikkaleli D, Akinsola GD, Mwamba MN. 2021. Can CO 2 emissions and energy consumption determine the economic performance of South Korea? A time series analysis. Environ Sci Pollut Res. 1–16. https://doi.org/https://doi.org/10.1007/s11356-021-13498-1
- Adebayo TS, Kirikkaleli D. 2021. Impact of renewable energy consumption, globalization, and technological innovation on environmental degradation in Japan: application of wavelet tools. Environ Dev Sustain. 1–26. https://doi.org/https://doi.org/10.1007/s10668-021-01322-2
- Adebayo, TS, Rjoub, H, Akinsola, GD, Oladipupo, SD. 2021. The asymmetric effects of renewable energy consumption and trade openness on carbon emissions in Sweden: New evidence from quantile-on-quantile regression approach. Environmental Science and Pollution Research, 1–12. https://doi.org/https://doi.org/10.1007/s11356-021-15706–4
- Alola AA, Joshua U. 2020. Carbon emission effect of energy transition and globalization: inference from the low-, lower middle-, upper middle-, and high-income economies. Environ Sci Pollut Res. 27(30):38276–38286.
- Alola AA, Ozturk I. 2021. Mirroring risk to investment within the EKC hypothesis in the United States. J Environ Manage. 293:112890.
- Bekun FV, Gyamfi BA, Onifade ST, Agboola MO. 2021b. Beyond the environmental Kuznets Curve in E7 economies: accounting for the combined impacts of institutional quality and renewables. J Clean Prod. 127924. https://doi.org/https://doi.org/10.1016/j.jclepro.2021.127924
- Broock WA, Scheinkman JA, Dechert WD, LeBaron B. 1996. A test for Independence based on the correlation dimension. Econom Rev. 15(3):197–235.
- Chen B, Chen GQ, Yang ZF, Jiang MM. 2007. Ecological footprint accounting for energy and resource in China. Energy Policy. 35(3):1599–1609.
- Chen Y, Zhao J, Lai Z, Wang Z, Xia H. 2019. Exploring the effects of economic growth, and renewable and non-renewable energy consumption on China’s CO2 emissions: evidence from a regional panel analysis. Renew Energy. 140:341–353.
- Cheng C, Ren X, Dong K, Dong X, Wang Z. 2021. How does technological innovation mitigate CO2 emissions in OECD countries? Heterogeneous analysis using panel quantile regression. J Environ Manage. 280:111818.
- Destek MA, Sarkodie SA. 2019. Investigation of environmental Kuznets curve for ecological footprint: the role of energy and financial development. Sci Total Environ. 650:2483–2489.
- Dogan E, Taspinar N, Gokmenoglu KK. 2019. Determinants of ecological footprint in MINT countries. Energy Environ. 30(6):1065–1086.
- Dogan, E, Turkekul, B. 2016. CO2 emissions, real output, energy consumption, trade, urbanization and financial development: testing the EKC hypothesis for the USA. Environmental Science and Pollution Research 23(2): 1203–1213.
- Dong K, Dong X, Ren X. 2020. Can expanding natural gas infrastructure mitigate CO2 emissions? Analysis of heterogeneous and mediation effects for China. Energy Econom. 90:104830. doi:https://doi.org/10.1016/j.eneco.2020.104830.
- Global Footprint Network, GFN. 2018. Ecological footprint. https://data.footprintnetwork.org/?_ga=2.118071817.1863724020.1626905086-424977614.1626905086#/countryTrends?type=BCtot,EFCtot&cn=351.(Accessed 20 May 2021).
- Gyamfi BA, Adedoyin FF, Bein MA, Bekun FV, Agozie DQ. 2021b. The anthropogenic consequences of energy consumption in E7 economies: juxtaposing roles of renewable, coal, nuclear, oil and gas energy: evidence from panel quantile method. J Clean Prod. 295:126373. doi:https://doi.org/10.1016/j.jclepro.2021.126373.
- Gyamfi BA, Onifade ST, Nwani C, Bekun FV. 2021a. Accounting for the combined impacts of natural resources rent, income level, and energy consumption on environmental quality of G7 economies: a panel quantile regression approach. Environ Sci Pollut Res. 1–13.https://doi.org/https://doi.org/10.1007/s11356-021-15756-8
- Hao Y, Zhang ZY, Liao H, Wei YM. 2015. China’s farewell to coal: a forecast of coal consumption through 2020. Energy Policy. 86:444–455.
- He X, Adebayo TS, Kirikkaleli D, Umar M. 2021. Consumption-based carbon emissions in Mexico: an analysis using the dual adjustment approach. Sustain Prod Consum. 27:947–957. doi:https://doi.org/10.1016/j.spc.2021.02.020.
- International Energy Agency, IEA. 2019. World energy outlook. [Accessed 2020 Feb 28]. https://www.iea.org/reports/world-energy-outlook-2019.
- IPCC. 2007. Summary for policymakers. Climate Change 2007: The Physical Science Basis. Contribution of Working Group I to the Fourth Assessment Report of the Intergovernmental Panel on Climate Change. Cambridge (United Kingdom and New York, NY, USA): Cambridge University Press.
- IPCC. 2018. Global warming of 1.5°C. An IPCC Special Report on the impacts of global warming of 1.5°C above pre-industrial levels and related global greenhouse gas emission pathways, in the context of strengthening the global response to the threat of climate change, sustainable development, and efforts to eradicate poverty.
- IPCC. 2019. Summary for policymakers. Climate Change and Land: an IPCC special report on climate change, desertification, land degradation, sustainable land management, food security, and greenhouse gas fluxes in terrestrial ecosystems.
- Jiang Q, Khattak SI, Rahman ZU. 2021. Measuring the simultaneous effects of electricity consumption and production on carbon dioxide emissions (CO2e) in China: new evidence from an EKC-based assessment. Energy. 229:120616. doi:https://doi.org/10.1016/j.energy.2021.120616.
- Kihombo S, Ahmed Z, Chen S, Adebayo TS, Kirikkaleli D. 2021. Linking financial development, economic growth, and ecological footprint: what is the role of technological innovation? Environ Sci Pollut Res. 1–11. https://doi.org/https://doi.org/10.1007/s11356-021-14993-1
- Li D, Yang D. 2016. Does non-fossil energy usage lower CO2 emissions? Empirical evidence from China. Sustainability. 8(9):874. doi:https://doi.org/10.3390/su8090874.
- Li H, Shahbaz M, Jiang H, Dong K. 2021. Is natural gas consumption mitigating air pollution? Fresh evidence from national and regional analysis in China. Sustain Prod Consum. 27:325–336. doi:https://doi.org/10.1016/j.spc.2020.11.010.
- Li J, Zhang Y, Tian Y, Cheng W, Yang J, Xu D, … Ku AY. 2020. Reduction of carbon emissions from China’s coal-fired power industry: insights from the province-level data. J Clean Prod. 242:118518.
- Mallick H, Padhan H, Mahalik MK. 2019. Does skewed pattern of income distribution matter for the environmental quality? Evidence from selected BRICS economies with an application of quantile-on-quantile regression (QQR) approach. Energy Policy. 129:120–131. doi:https://doi.org/10.1016/j.enpol.2019.02.021.
- Miller SM, Michalak AM, Detmers RG, Hasekamp OP, Bruhwiler LM, Schwietzke S. 2019. China’s coal mine methane regulations have not curbed growing emissions. Nat Commun. 10(1):1–8. doi:https://doi.org/10.1038/s41467-018-07891-7.
- OECD. 2020. Renewable energy. [Accessed 2021 Jul 21]. https://data.oecd.org/energy/renewable-energy.htm.
- Onifade ST, Alola AA, Erdoğan S, Acet H. 2021a. Environmental aspect of energy transition and urbanization in the OPEC member states. Environ Sci Pollut Res. 28(14):17158–17169. doi:https://doi.org/10.1007/s11356-020-12181-1.
- Onifade ST, Erdoğan S, Alagöz M, Bekun FV. 2021b. Renewables as a pathway to environmental sustainability targets in the era of trade liberalization: empirical evidence from Turkey and the Caspian countries. Environ Sci Pollut Res. 1–12. https://doi.org/https://doi.org/10.1007/s11356-021-13684-1
- Orhan A, Adebayo TS, Genç SY, Kirikkaleli D. 2021. Investigating the linkage between economic growth and environmental sustainability in India: do agriculture and trade openness matter? Sustainability. 13(9):4753. doi:https://doi.org/10.3390/su13094753.
- Pata, UK. 2018. Renewable energy consumption, urbanization, financial development, income and CO2 emissions in Turkey: testing EKC hypothesis with structural breaks. Journal of Cleaner Production 187: 770–779.
- Pata UK, Caglar AE. 2021. Investigating the EKC hypothesis with renewable energy consumption, human capital, globalization and trade openness for China: evidence from augmented ARDL approach with a structural break. Energy. 216:119220. doi:https://doi.org/10.1016/j.energy.2020.119220.
- Sadik-Zada ER, Ferrari M. 2020. Environmental policy stringency, technical progress and pollution haven hypothesis. Sustainability. 12(9):3880. doi:https://doi.org/10.3390/su12093880.
- Sarkodie SA, Adams S, Owusu PA, Leirvik T, Ozturk I. 2020. Mitigating degradation and emissions in China: the role of environmental sustainability, human capital and renewable energy. Sci Total Environ. 719:137530. doi:https://doi.org/10.1016/j.scitotenv.2020.137530.
- Sarkodie SA, Strezov V. 2018. Empirical study of the environmental Kuznets curve and environmental sustainability curve hypothesis for Australia, China, Ghana and USA. J Clean Prod. 201:98–110. doi:https://doi.org/10.1016/j.jclepro.2018.08.039.
- Shahbaz M, Nasir MA, Hille E, Mahalik MK. 2020a. UK’s net-zero carbon emissions target: investigating the potential role of economic growth, financial development, and R&D expenditures based on historical data (1870–2017). Technol Forecast Soc Change. 161:120255. doi:https://doi.org/10.1016/j.techfore.2020.120255.
- Shahbaz M, Raghutla C, Song M, Zameer H, Jiao Z. 2020b. Public-private partnerships investment in energy as new determinant of CO2 emissions: the role of technological innovations in China. Energy Econom. 86:104664. doi:https://doi.org/10.1016/j.eneco.2020.104664.
- Shan S, Ahmad M, Tan Z, Adebayo TS, Li RYM, Kirikkaleli D. 2021. The role of energy prices and non-linear fiscal decentralization in limiting carbon emissions: tracking environmental sustainability. Energy. 234:121243. doi:https://doi.org/10.1016/j.energy.2021.121243.
- Shan Y, Huang Q, Guan D, Hubacek K. 2020. China CO 2 emission accounts 2016–2017. Sci Data. 7(1):1–9. doi:https://doi.org/10.1038/s41597-020-0393-y.
- Sim N, Zhou H. 2015. Oil prices, US stock return, and the dependence between their quantiles. J Bank Financ. 55:1–8. doi:https://doi.org/10.1016/j.jbankfin.2015.01.013.
- Su ZW, Umar M, Kirikkaleli D, Adebayo TS. 2021. Role of political risk to achieve carbon neutrality: evidence from Brazil. J Environ Manage. 298:113463. doi:https://doi.org/10.1016/j.jenvman.2021.113463.
- UNEP. 2018. The Emissions Gap Report 2018. Nairobi: United Nations Environment Programme.
- Usman, O, Alola, AA, Sarkodie, SA. 2020. Assessment of the role of renewable energy consumption and trade policy on environmental degradation using innovation accounting: Evidence from the US. Renewable Energy 150: 266–277.
- Wei C, Löschel A, Managi S 2020. Recent advances in energy demand research in China.
- World Development Indictors, WDI. 2020. [Accessed Jul 2021] https://data.worldbank.org/.
- Wu XD, Guo JL, Chen GQ. 2018. The striking amount of carbon emissions by the construction stage of coal-fired power generation system in China. Energy Policy. 117:358–369. doi:https://doi.org/10.1016/j.enpol.2018.02.043.
- Xia C, Wang Z. 2020. The effect of fossil fuel and hydropower on carbon dioxide emissions: EKC validation with structural breaks. J Environ Eng Landsc Manage. 28(1):36–47. doi:https://doi.org/10.3846/jeelm.2020.11832.
- Yan D, Kong Y, Ren X, Shi Y, Chiang S. 2019. The determinants of urban sustainability in Chinese resource-based cities: a panel quantile regression approach. Sci Total Environ. 686:1210–1219. doi:https://doi.org/10.1016/j.scitotenv.2019.05.386.
- Yan D, Ren X, Kong Y, Ye B, Liao Z. 2020. The heterogeneous effects of socioeconomic determinants on PM2. 5 concentrations using a two-step panel quantile regression. Appl Energy. 272:115246. doi:https://doi.org/10.1016/j.apenergy.2020.115246.
- Yilanci V, Pata UK. 2020. Investigating the EKC hypothesis for China: the role of economic complexity on ecological footprint. Environ Sci Pollut Res. 27:32683–32694. doi:https://doi.org/10.1007/s11356-020-09434-4.
- Yuping L, Ramzan M, Xincheng L, Murshed M, Awosusi AA, Bah SI, Adebayo TS. 2021. Determinants of carbon emissions in Argentina: the roles of renewable energy consumption and globalization. Energy Rep. 7:4747–4760. doi:https://doi.org/10.1016/j.egyr.2021.07.065.
- Zhang L, Li Z, Kirikkaleli D, Adebayo TS, Adeshola I, Akinsola GD. 2021. Modeling CO2 emissions in Malaysia: an application of Maki cointegration and wavelet coherence tests. Environ Sci Pollut Res. 28(20):26030–26044. doi:https://doi.org/10.1007/s11356-021-12430-x.
Appendix A
Table A. Global electricity demand by region (year 2000 and 2018)