
 ?Mathematical formulae have been encoded as MathML and are displayed in this HTML version using MathJax in order to improve their display. Uncheck the box to turn MathJax off. This feature requires Javascript. Click on a formula to zoom.
ABSTRACT
To further understanding the perspective of sustainable consumption and production, which is one of the key elements of the Sustainable Development Goals (SDGs), this study examines the environmental effects of material domestic productivity, material footprint and material intensity in the world’s most advanced economies – the Group of Seven (G7) countries by using the dataset that spans over the time 1970 to 2019. The environmental Kuznets curve hypothesis was used as a theoretical framework. By applying the mean group dynamic least squares (DOLSMG) estimation approach and using carbon and greenhouse gas emissions as environmental indicators, the outcome validates the environmental Kuznets curve hypothesis but only in the United States and Germany. Material productivity, footprint and intensity exert a significantly negative impact on the environmental indicators, thus demonstrating the existence of a feasible sustainable consumption and production approach among the countries. By contrast, especially for the country-specific results, material productivity and intensity aggravated environmental degradation by increasing carbon and greenhouse gas emissions in France, Italy, and Japan. A robustness check using the Dumitrescu-Hurlin Granger causality approach aligns with the above-mentioned results. The findings suggest policy recommendations for a more effective approach to reducing material intensification across economic sectors in advanced economies.
1. Introduction
In the twenty-first century, production and consumption patterns have presented great existential challenges to the environment by raising the level of the accumulation of carbon dioxide and other greenhouse gases and increased the average global temperature. This has resulted in global warming and other types of climate change that pose a fundamental threat to human health and economic development (IPCC Citation2018, Usman, Citation2023, Usman and Alola, Citation2022, World Bank, Citation2016). Raw materials that are extracted directly from the natural environment are required for the production of goods and the provision of services. Therefore, the impact of material productivity on environmental degradation remains a major concern among environmentalists, researchers and policymakers. As the global economy grows and the population increases, the manufacturing sector expands, which means that additional raw materials are required to meet demands. The consequence of this growth is the depletion of natural resources and biodiversity, which leads to environmental degradation (Behrens et al. Citation2007, Kassouri et al. Citation2021).
To address the environmental impacts of material productivity, several countries have adopted environmental policy frameworks that encourage sustainable production and consumption patterns. Many countries have implemented green policies that aim to decrease pollution without sacrificing economic development or improvements to social welfare (Balcilar et al. Citation2023). An environmental policy framework can enhance material productivity by increasing economic advantages without increasing natural resource extraction, which can deteriorate the environment. This provides solutions to the emerging conflict between future demand and restricted natural resource availability (Gan et al. Citation2013). According to Usman (Citation2023), green energy technology has the capacity to lower the intensity of energy consumption, thereby reducing the pressure on natural resources. This is because technological innovation mitigates the level of fuel combustion in energy use. Adopting green technologies reduce the intensity of energy usage by industries, residential houses and the transportation sector. Empirical research on environmental sustainability has pervaded the literature for the past three decades, including the pioneering scholarly work of Grossman and Krueger (Citation1991), Selden and Song (Citation1994), Carson et al. (Citation1997) and Suri and Chapman (Citation1998).
In recent times, a growing number of empirical studies have attempted to examine the main drivers of environmental sustainability using time series and panel data settings; however, several challenges persist such as the need to examine whether material productivity and intensity influence environmental sustainability positively or negatively within the framework of the environmental Kuznets curve (EKC) hypothesis in G7 countries. Although one might expect the impact to be negative, material productivity and intensity may be associated with high levels of clean energy use, which would reduce the pressure on natural resources and thereby improve environmental sustainability (see Balcilar et al. Citation2023). The available literature only unfolds the factors influencing material productivity, which has been growing significantly across the world. Therefore, there is a need to further our understanding of sustainable consumption and production––a key element of the Sustainable Development Goals (SDGs).
Given this background, the main objective of this study is to examine the environmental effects of material domestic productivity, material footprint, and material intensity in the Group of Seven (G7) countries over the period 1970 to 2019. The choice of G7 is motivated by the fact that these countries have witnessed an astronomical increase in not only material productivity but also the intensity of the materials. As material productivity and its intensity increase, the goal of achieving environmental sustainability may be jeopardized. Moreover, to spur economic prosperity and curtail negative environmental externalities arising from human activities, including material productivity, the G7 countries have implemented environmental policies that commit to attaining net-zero emissions by 2050. For example, Germany boosted clean energy consumption by 9.3% between 2008 and 2018. Within the same period, France, Italy and the United Kingdom boosted their use of renewable energy by 10.9%, 13.2% and 17.8%. This corresponds with the rise in the proportion of clean energy in the total energy mix in the G7 countries. The Statistical Review of World Energy reported on the growth of clean/renewable energy in four European G7 countries in 2019 and found that Germany had the highest growth (7.3%), followed by the United Kingdom (3.7%), Italy (2.2%) and France (2.1%). Non-European G7 countries have also made remarkable progress on this front. Between 2008 and 2018, the share of renewables rose by 13.3% in Japan, 10.1% in the United States and 13.5% in Canada, which indicates concerted efforts to achieve environmental sustainability in these countries.
While the choice of this period is necessitated by the data availability, the mean group dynamic least squares (DOLSMG) estimator and Dumitrescu-Hurlin Panel Causality are applied. These methods are more suitable for heterogeneous panels which might be a typical feature of the G7 data explored. Overall, our study contributes to the literature on environmental sustainability in several ways. First, given the increase in material productivity and intensity, which has attracted environmental stakeholders in recent times, this study examines how material productivity, material footprint, and material intensity relate to carbon neutrality goals in G7 countries. Second, unlike most studies in the literature, we measured environmental sustainability using two separate indicators – CO2 and greenhouse gas emissions – which showcases the robustness of our findings. Third, panel cointegration and the mean group dynamic least squares (DOLSMG) estimator were used to examine the long-term impacts of the independent variables on environmental sustainability. Country-specific impacts of material productivity and material intensity, alongside other control variables, were also considered. Finally, to circumvent the endogeneity problem and check the robustness of the results, we performed a panel causality test using Dumitrescu and Hurlin’s (Citation2012) framework. We hope that the results of this study will facilitate the crafting of effective environmental policy that will accelerate progress towards attaining the net-zero emissions target in G7 countries by 2050.
This study is organised as follows: Section 2 outlines the study’s theoretical and empirical literature as it relates to material efficiency and intensity. The description of the dataset is presented in section 3. Section 4 presents the methods adopted in this study and section 6 presents the discussion of the results. Lastly, in section 6, the concluding remark is outlined and we address the policy-based implication and limitation of the findings.
2. Theoretical and empirical literature
2.1 Theoretical framework
In this study, two theoretical frameworks are adopted. First, the theoretical underpinning the relationship between environmental indicators and economic growth is rested on the EKC hypothesis proposed by Kuznets (Citation1955) and popularized by the empirical work of Grossman and Krueger (Citation1991). The main thesis of the EKC hypothesis is that at early stage of development, production and environmental pollution levels are at the lower stage; although as income level increases, environmental pollution would increase until a certain threshold is reached, after which an increase in the level of income would reduce environmental pollution. This hypothesis has received a huge empirical validation (see Ozturk and Acaravci Citation2010; Alola et al. Citation2021; Akadırı et al. Citation2021; Usman et al. Citation2021; Magazzino et al. Citation2023a). Secondly, the theoretical underpinning of the connection between material productivity and the environment rests on material flow analysis (MFA). This methodological foundation has been studied but only by a few researchers (e.g. Fischer-Kowalski et al. Citation2014; OECD Citation2008; Schütz and Steurer, Citation2001). MFA demonstrates the process of not only monitoring a system but also analysing the physical fluxes of materials into and out of that system. Essentially, while MFA can be limited to specific materials or chemical constituents, it can also holistically consider all the resources and products in a system (see OECD Citation2008, Talmon-Gros, Citation2014). Given that the core objective of environmental regulations and laws is to reduce the harmful effects of emissions and wastewater on the environment, it must be noted that the inputs of a system directly determine its outputs. Therefore, issues pertaining to material flows may provide insights into sustainable environment analysis.
2.2 Empirical literature
The empirical literature on the EKC hypothesis has generated a mixed finding. While some studies found a support for the EKC hypothesis, others failed to validate the hypothesis. For example, Shahbaz et al. (Citation2017) tested the EKC hypothesis for China by incorporating energy consumption and globalization. The results validated the EKC hypothesis. In the case of Nigeria, it was discovered via an empirical work conducted by Ali et al. (Citation2021) that the EKC hypothesis holds in Nigeria. In a recent paper, Magazzino etal. (Citation2023a) tested the effectiveness of governance in tourism-led EKC hypothesis in the EU and UK regions after the Brexit by employing the ARDL and quantile regression modelling techniques. The outcomes show that governance exerts an upward pressure on the level of emissions while the tourism-induced EKC hypothesis is validated only in the first quantile. Additionally, Magazzino et al. (Citation2023b) tested the long-term EKC using the parametric and semi-parametric additive models for nine advanced countries between 1870 and 2008. The results based on the panel level validate the EKC only in the post-1950s level while in the country-specific level, the inverted U-shape is detected between CO2 emissions and GDP for a subset of countries only. Furthermore, Magazzino (Citation2023) investigated the effect of electricity consumption and economic growth on ecological footprint by incorporating geopolitical risk and natural resources governance. Using the quantile regression method of analysis for the period 1960 to 2019, the results show that electricity consumption and economic growth promote environmental degradation but the effect of urbanization and trade dampen environmental degradation. Magazzino (Citation2012) examined how disaggregated energy production affects real aggregate income in Italy for the period 1883 to 2009. Having found a cointegration between the variables, the results further unveil a two-way causality flowing between energy production and economic growth. The implication of this finding is that energy production can determine the level of economic growth which consequently leads to environmental pollution.
In recent times, several research papers have investigated the potential determinants of material productivity and how material resources affect environmental protection (Giljum et al. Citation2008, Schandl and West Citation2010, Steger and Bleischwitz Citation2011, Gan et al. Citation2013, West et al. Citation2014, Agnolucci et al. Citation2017, Alataş et al. Citation2021). For example, Giljum et al. (Citation2008) examined the development trajectory of materials use as well as resource productivities in Europe. The study modelled three different scenarios towards achieving a sustainable natural resources usage in the European region. The results show that policy instruments targeting eco-system efficiency at micro level is economic growth driven. However, to reduce rebound effect at the macro level, the policy instruments need to be synchronized with other policies to influence not only prices of energy but also materials. Given the rapid rise in resource use leading environmental degradation in the globe, Schandl and West (Citation2010) investigated the linkage between resource efficiency and resource use in the Asia-Pacific region for the period spanning from 1970 to 2005. The results show that the region has experienced an increasing level of total resource use but the resource efficiency level is declining which is associated with and driven by the declining level of resource efficiency in terms of the global level. Steger and Bleischwitz (Citation2011) examined the drivers for not only resource use but also materials productivity across fifteen countries from the European Union over the period 1980 to 2000 and 25 countries from the European Union over the period 1992 to 2000 respectively. The results unveiled that score drivers of resource use include energy efficiency, road maintenance/construction activities, and new dwelling. Furthermore, West et al. (Citation2014) assessed the main patterns of materials use and efficiency changes in the different states of the former Soviet Union. Particularly, their study is focused on assessing three main drivers of materials use within the framework of the IPAT. The results suggested that a positive and significant association is detected between the individual economic growth states and the level to which material productivity is being improved in these states. This finding is essential for assessing whether dematerialization process promotes or retard economic growth.
Furthermore, using the ARDL modelling approach, Wang et al. (Citation2016) examined the dynamics of not only the material productivity but also socioeconomic factors in China over the period 1980 to 2010. The results established a long-run relations between the variables. The decrease in intensity of secondary industry is driven primarily by improved technological innovation, which equally promotes material productivity. Additionally, the openness of trade is significant in promoting material production both in the long run and the associated short term. However, domestic extraction per capita is not significant in driving material productivity in China with a low and weak size of the coefficient. Furthermore, the result showed that domestic extraction per capita dampening material productivity in the short run, suggesting a declining marginal revenue of resource inputs. Moreover, Alataş et al. (Citation2021) assessed the potential of not only material productivity but also energy productivity in mitigating climatic changes in the EU28. Using the convergence testing approach, the energy productivity of conditional β-convergence is found. This convergence does not include material productivity. Furthermore, there is no evidence supporting that all countries in the European Union will converge to specific steady-state equilibrium path. In additional material productivity is found to have contributed towards reducing emissions if it is aligned with measures to reducing energy consumption.
Given the foregoing literature, it is clear that there is a paucity of literature, focusing on how material productivity, material footprints, and material intensity influence environmental degradation. In addition, several arguments been made in the existing literature about the most comprehensive way to measure environmental degradation. While some empirical studies applied CO2 emissions, others argued that greenhouse gas is more intensive (See Usman et al. Citation2021). In this study, we applied both CO2 emissions and greenhouse gas in different equations and within the framework of the EKC hypothesis. Therefore, we hope that this study will provide insights for achieving environmental sustainability, which is central focus in the United Nations’ Sustainable Development Goals (SDGs)
3 Data description
In this study, we investigated the EKC hypothesis within the framework of material efficiency for the G7 countries using data from 1970 to 2019. Stata 17.0 and EViews 11.0 software programs were used in the analysis. In addition, we created two econometrics models for analysis process. In the first model, total annual production-based emissions of carbon dioxide was the dependent variable, while in the second model, greenhouse gas emissions (GHG) was the dependent variable. A series of explanatory variables was employed, and a description of all variables used in the analysis is presented in .
Table 1. Definition of variables.
The analysis was conducted in the following stages:
First, descriptive statistics of the variables were generated. Alongside the series plots that provide visual representations of the data, the statistical information offers raw and vivid insights arising from the changes in the variables over time. Some transformations were made in the series deemed necessary.
Given that a shock in a country arising from social, economic, macroeconomic or even environmental factors could spill over to other G7 countries, it was important to investigate whether the series had cross-sectional dependence. Thus, cross-sectional dependence (CD) was tested with the Breusch – Pagan LM (Breusch and Pagan Citation1980), the Pesaran scaled LM, the bias-adjusted scaled LM and the Pesaran CD (Pesaran Citation2004) tests. The CD test revealed that there was cross-sectional dependence in the series. Hence, the results indicate that the panel unit root and slope coefficients are homogeneous, and cointegration tests that account for CD in the panel are the most appropriate.
Thereafter, we applied the panel Cross-section Augmented Dickey-Fuller (CADF) unit root test developed by Pesaran (Citation2007) in unit root tests that take into account CD and heterogeneity. We found that the growth rate and the square of the growth rate variables are stationary at level values, i.e. at I(0), whereas the other variables become stationary when the first difference of the series is taken, i.e. at I(1).
Also following the existence of CD for the models, the results obtained showed the existence of CD, as the Swamy (Citation1970) test showed that the panel had a heterogeneous structure. In this direction, the investigation benefited from the Westerlund (Citation2008) Durbin – Hausman panel cointegration test, which suggests the suitability of using it for series that are stationary at different levels.
Following the cointegration evidence, we investigated whether the slope coefficients are homogeneous with the homogeneity test proposed by Pesaran and Yamaga (2008). The results indicate that the slope coefficients are heterogeneous.
Eventually, given that the results show that there is a long-term cointegration relationship in both models. We used the mean group dynamic least squares (DOLSMG) estimator proposed by Pedroni (2001) because of its suitability for heterogeneous panels.
Lastly, a Granger causality test was performed. The panel causality test proposed by Dumitrescu and Hurlin (Citation2012) was used because of its suitability for heterogeneous panels.
4. Empirical computations
Following Kuznets (Citation1955) study on the nexus between economic growth and income inequality, which is best known for testing the EKC hypothesis, we examined the roles of material efficiency and material density within the framework of the EKC hypothesis. The impact of the level of material or resource productivity and density on the environment has been a major focus of many studies in recent years (e.g. Alola et al. Citation2021, Chen et al. Citation2023, Flachenecker and Kornejew Citation2019, Mushafiq and Prusak Citation2023, Steinberger and Krausmann, Citation2011, Usman et al. Citation2022, Xin et al. Citation2023). To test the EKC hypothesis and examine the roles of the explanatory variables, two models were implemented separately. The two models, carbon function and GHG emissions function, were employed because (i) each serves as robustness to the other and (ii) the GHG emissions function potentially includes the environmental impacts of other gaseous compounds, including nitrous oxide (N2O), methane (CH4), hydrofluorocarbons (HFCs), perfluorocarbons (PFCs), sulphur hexafluoride (SF6) and natrium trifluoride (NF3). The EKC model is as follows:
Mathematical Model 1:
Mathematical Model 2:
The econometric model is as follows:
Econometric Model 1:
Econometric Model 2:
In the above models, and
represent the constant term, while
, … ,
and
, … ,
denote the slope coefficient terms. In addition,
and
are error terms that represent the stochastic property of the econometric model versus the deterministic property of the mathematical model. In line with the general characteristics of the data in , the econometric model was used in logarithmic – linear form; dependent variables were logarithmic, while independent variables were linear.
Table 2. Statistical description of data.
4.1. Preliminary tests
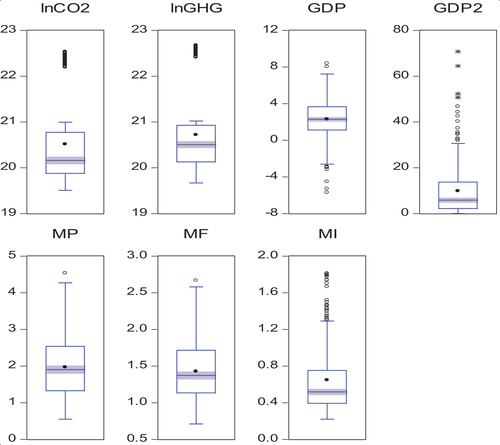
Before starting the econometric analysis, it was first necessary to examine the general characteristics of the data used. We reported the statistical values of the data we used in the analysis in . The values of CO2 and GHG are extremely high, thus necessitating a natural logarithmic conversion of these variables. Conversely, the maximum – minimum values and standard deviations of the independent variables were at an appropriate level given that these variables are mostly in ratios and percentages. Apart from GDP, all the variables have a positive skewness while all the variables employed in this study have positive and excess kurtosis. Consequently, the Jarque-Bera statistics for all the variables are extremely high, rejecting the null hypothesis of normal distribution of the variables. The distributions of numeric data values between variables presented by the descriptive statistics are depicted in .
Figure 1. Box plot for variables.
In addition, reported the correlation matrix analysis of variables employed in this study. As we can see, the coefficients the correlation between the variables are low except for the case of lnCO2 and lnGHG, which both measured environmental degradation. Also, the correlation analysis is also presented via a scatterplot matrix for variables as shown in .
Figure 2. Scatterplot matrix for variables.
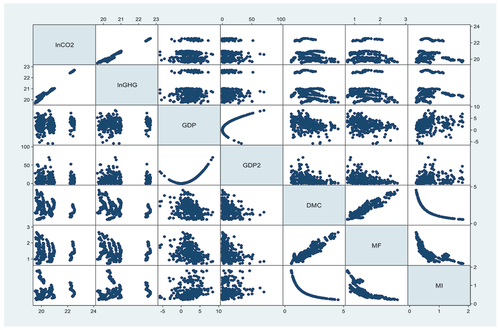
Table 3. Correlation analysis results.
4.2. Other preliminary tests: CD, unit roots, cointegration and slope homogeneity
In the next stage of the analysis, the CD test of the variables, which shows whether there is a relationship between the examined countries, was examined (see ). In this framework, four types of cross-section dependency tests (Breusch-Pagan LM, Pesaran scaled LM, bias-adjusted scaled LM and Pesaran CD) were implemented. The CD test results showed that the null hypothesis (that there is no cross-sectional dependence at the 1% significance level) was rejected. There was also no CD, which means that any shock that countries may be exposed to can be affected by other countries.
Table 4. Cross-section dependence results.
Pesaran and Yamagata’s (Citation2008) homogeneity test results are presented in . The null hypothesis expressing the homogeneity of the slope coefficients was rejected at the 1% significance level. This result shows that the slope coefficients are heterogeneous. Additionally, a panel CADF unit root test was used in the stationarity analysis of the series under the condition of the presence of CD and heterogeneity. The result of the panel CADF unit root test is presented in . While the null hypothesis of the panel CADF test states that the series has a unit root, the alternative hypothesis states that it does not. The analysis results in show that the GDP and series were stationary at the level values for the 1% significance level. The other series became stationary after taking the first difference. In this framework, the dependent variable was I(1) and the independent variables I(0) and I(1) were stationary. Following the panel unit root test, we tested for CD in both models. As reported in , the null hypothesis stating that there is no CD was rejected. This result confirms the CD of the models.
Table 5. Pesaran and Yamagata (Citation2008) homogeneity test results.
Table 6. Pesaran (Citation2007) panel CADF unit root test results.
Table 7. Cross-section dependence results for Model a and Model B.
4.3. Estimations: cointegration and slope homogeneity
We emphasised that the models established before the panel cointegration analysis had CD. Additionally, while taking into account the heterogeneity of the slope parameters, Swamy’s (Citation1970) homogeneity test results show the rejection of the null hypothesis, stating that the slope coefficients are homogeneous at the 1% significance level. In other words, the slope coefficients are heterogeneous. Based on the CD, heterogeneity and unit root test results in the study, the investigation employs the Durbin – Hausman cointegration test developed by Westerlund (Citation2008).
For the Durbin – Hausman cointegration test, the cointegration relationship was examined separately for the panel and for the groups that make up the panel. The null hypothesis of this test was defined as ‘no cointegration’. Therefore, the rejection of the null hypothesis means that there is a cointegration relationship for the entire panel. The Durbin – Hausman panel cointegration results are presented in . The results show that in Model 1 with the constant, the null hypothesis should be rejected at the 5% significance level of the individual panel results. It also shows that the results of both individual panel and group statistics of Model 1 for the fixed and trended cases should reject the null hypothesis at the 10% and 5% significance levels, respectively. The results from Model 2 are similar to those of Model 1 in terms of both the constant and trend structures. The null hypothesis stating that there is no cointegration relationship was rejected and a long-term cointegration relationship was found between the variables. Hence, the results establish the statistical significance or validity of the panel cointegration relationships in the models. This result means that the null hypothesis stating that there is no cointegration relationship was rejected. In this direction, the DOLSMG estimator, alongside the Granger causality among the variables, was implemented to provide concrete information about the proposed relationships.
Table 8. Westerlund (Citation2008) panel cointegration test results.
5. Results and discussion
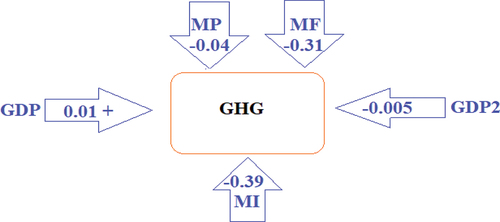
As revealed by the DOLSMG panel results in , the EKC hypothesis is valid for Models 1 and 2. Accordingly, given the validity of EKC and the statistical significance of the parameter while other variables are constant, a 1-unit change in GDP increases and GHG emissions by approximately 0.02%. Additionally, while other variables are constant, a 1-unit change in GDP2 reduces
and GHG emissions by approximately 0.005% in the models, respectively. Evidence of valid EKC in the G7 countries is expected due to their advanced economic development, high societal awareness of and attitudes towards environmental challenges, and states’ commitments to nationally determined contributions (NDCs) arising from global climate goals. Notably, this evidence (EKC validity) has been largely acclaimed in previous literature (Ike et al. Citation2020, Shahbaz et al. Citation2019, Usman et al. Citation2021). Although Balcilar et al. (Citation2020) did not investigate panel evidence, they found that the validity of the EKC hypothesis was country-specific among the G7 countries.
Table 9. Long-run coefficients results (DOLSMG).
Furthermore, while other variables are constant, a 1-unit change in MP reduces emissions by ~ 9%, a 1-unit change in MF reduces the
emissions by ~ 25%, and a 1-unit change in MI reduces
emissions by ~ 40%. The DOLSMG test results of the Model 2 test revealed that the parameters were statistically significant. Accordingly, while other factors are constant, a 1-unit change in MP reduces
emissions by ~ 4%. Similarly, other factors being constant, it was found that a 1-unit change in MF reduces
emissions by ~ 32%. Additionally, a 1-unit change in MI reduces
emissions by ~ 40%. These results point to the key issues of productivity and the intensification of material resource extraction in the midst of the environmental sustainability drive of the countries. They suggest that these countries are on the path towards environmental sustainability given that their material resource utilisation now promotes environmental quality by reducing
and GHG emissions. This suggests that the countries have already undergone significant shifts towards sustainable consumption and production in accordance with Sustainable Development Goal 7. In line with this result, several studies have reported that improvements in material efficiency reduce environmental degradation (Chen et al. Citation2023; Flachenecker and Kornejew Citation2019; Mushafiq and Prusak Citation2023; Wang et al. Citation2016;). Furthermore, from foregoing analysis, present the graphical schematic of the findings based on Model 1 and Model 2 respectively.
Figure 3. DOLSMG schematic results for Model 1.
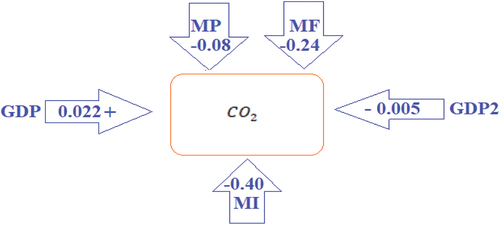
Figure 4. DOLSMG schematic results for Model 2.
The country-specific results are reported in , which shows that the EKC hypothesis for Models 1 and 2 is only valid for Germany and the United States. However, this finding is contrary to the findings of Balcilar et al. (Citation2020), which indicate reverse evidence of EKC in Canada, Germany, Japan, the United Kingdom and the United States. The EKC hypothesis has also been validated (Alola and Ozturk Citation2021, Pata Citation2021), invalidated (Dogan and Turkekul Citation2016) and conditioned on other salient factors (Aslan et al. Citation2022, Usman et al. Citation2021) in the case of the United States. The findings of both Iwata et al. (Citation2010) and Pata and Samour (Citation2022) contradict the evidence of the EKC hypothesis for France. Additionally, the EKC hypothesis has been validated in Germany (Pata et al. Citation2023, Alola and Adebayo Citation2023, Zambrano‐Monserrate and Fernandez, Citation2017), Japan (Liu et al. Citation2018, Rafindadi, Citation2016) and Canada (Olale et al. Citation2018). While partial validation of the EKC hypothesis was established for Canada by He and Richard (Citation2010), the evidence of EKC is supported by several studies conducted in the United Kingdom (Ben Amar Citation2021, Caglar Citation2023, Fosten et al. Citation2012), and partial evidence is reported for Italy by Mazzanti et al. (Citation2008).
Table 10. Country-specific long run coefficients results.
Moreover, the results reveal that an increase in material efficiency and intensity in the majority of countries promotes the reduction of environmental degradation, especially in terms of decreasing carbon and GHG emissions. Specifically, in the United States, the United Kingdom, Germany, Canada and (partially) France, the results show that material resource use is environmentally efficient, such that intensification of materials for production activities is not harmful to the environment. However, in Italy and Japan, environmental quality is especially harmed by material use.
In , robustness evidence through the Dumitrescu – Hurlin panel causality test results is presented in terms of lag length (k), where k = 1 and k = 2. These results show that there is no dramatic difference in lag lengths. When k = 1, a one-way causality relationship between GDP2 and MP was found. Another result proves the existence of a bidirectional causality relationship between MI and GDP2. When k = 2, there was bidirectional causality between and MF. There was also bidirectional causality between GDP and MI for both lag lengths. Additionally, the existence of a one-way causality relationship between MF and GHG was validated. Finally, when k = 1, one-way causality was found between MP and MI, and when k = 2, one-way causality was found between MP and MF.
Table 11. Dumitrescu and Hurlin (Citation2012) panel causality test results.
6. Conclusion and policy implementation
This study examined the roles of material productivity, material footprint, and material intensity within the EKC framework for G7 countries using the DOLSMG estimator. While this study produced valuable insights into the G7 economies in both panel and country-specific measures, it also compared the environmental impacts of carbon emissions with GHG emissions alongside the Granger causal relationships among the indicators over the 1970–2019 period. Importantly, the results validate EKC in the panel and only in the United States and Germany with carbon and GHG emissions as environmental indicators. Material productivity, footprint and intensity mitigate environmental degradation given their negative impact on carbon and GHG emissions in the panel. By contrast, the country-specific investigation revealed that material productivity and intensity are detrimental to environmental quality in Italy and Japan. Meanwhile, material productivity and intensity promote environmental quality in other countries, except France, where material productivity from the perspective of material (aggregate) footprint is environmentally devastating.
Although the above results are insightful, the study has clear limitations that should be considered in future investigations. For instance, future studies could focus on the specificity (components) of the material footprint and use more comprehensive environmental indicators, such as ecological footprints or biocapacity. Moreover, cross- and intra-sectoral analysis of this framework, especially for developed economies, would be interesting because it could further guide policymakers and industry actors.
The results of this study also suggest relevant policy recommendations. In particular, there is a need for France, Italy and Japan to further improve their sustainable consumption and production approaches, possibly through a multi-sectoral approach that promotes responsible behaviour among economic actors at the household, industry and national levels. However, for all the G7 countries – but especially for France, Italy and Japan – a review of environment-related taxes (energy, resource, pollution and transportation) could further guide the prioritising of this tax system. While the outcome of the current investigation is seen to provide guidance to relevant stakeholders, future studies can improve on the limitation of the study. For instance, future studies could also look at both consumption- and production-based aspects of the examined environmental indicators from the perspective of the explored explanatory variables. Moreover, within the current framework, the aspects of human behavior especially at the micro level such as culture, choice or preference, e.t.c., can also be the basis of investigation in the future investigation.
Disclosure statement
No potential conflict of interest was reported by the authors.
References
- Agnolucci P, Flachenecker F, Söderberg M. 2017. The causal impact of economic growth on material use in Europe. Journ Environ Econ Policy. 6(4):415–432. doi: 10.1080/21606544.2017.1325780.
- Akadırı SS, Alola AA, Usman O. 2021. Energy mix outlook and the EKC hypothesis in BRICS countries: a perspective of economic freedom vs. economic growth. Environ Sci Pollut Res. 28(7):8922–8926. doi: 10.1007/s11356-020-11964-w.
- Alataş S, Karakaya E, Sarı E. 2021. The potential of material productivity alongside energy productivity in climate mitigation: Evidence from convergence tests in the EU28. Res, Conserv Recyc. 167:105322. doi:10.1016/j.resconrec.2020.105322.
- Ali A, Usman M, Usman O, Sarkodie SA. 2021. Modeling the effects of agricultural innovation and biocapacity on carbon dioxide emissions in an agrarian-based economy: evidence from the dynamic ARDL simulations. Fron Ener Res. 8:592061. doi:10.3389/fenrg.2020.592061.
- Alola AA, Adebayo TS. 2023. Analysing the waste management, industrial and agriculture greenhouse gas emissions of biomass, fossil fuel, and metallic ores utilization in Iceland. Sci Total Environt. 1(4):1–15. doi: 10.1016/j.scitotenv.2023.164115.
- Alola AA, Akadiri SS, Usman O. 2021. Domestic material consumption and greenhouse gas emissions in the EU‐28 countries: Implications for environmental sustainability targets. Sus Dev. 29(2):388–397. doi: 10.1002/sd.2154.
- Alola AA, Ozturk I. 2021. Mirroring risk to investment within the EKC hypothesis in the United states. Journ Environ Manag. 293:112890. doi:10.1016/j.jenvman.2021.112890.
- Aslan A, Ocal O, Özsolak B. 2022. Testing the EKC hypothesis for the USA by avoiding aggregation bias: a microstudy by subsectors. Environ Sci Pollut Res. 29(27):41684–41694. doi: 10.1007/s11356-022-18897-6.
- Balcilar M, Ozdemir ZA, Tunçsiper B, Ozdemir H, Shahbaz M. 2020. On the nexus among carbon dioxide emissions, energy consumption and economic growth in G-7 countries: new insights from the historical decomposition approach. Envin Dev Sus. 22(8):8097–8134. doi: 10.1007/s10668-019-00563-6.
- Balcilar M, Usman O, Ike GN. 2023. Operational behaviours of multinational corporations, renewable energy transition, and environmental sustainability in Africa: Does the level of natural resource rents matter? Res Pol. 81:103344. doi:10.1016/j.resourpol.2023.103344.
- Behrens A, Giljum S, Kovanda J, Niza S. 2007. The material basis of the global economy: Worldwide patterns of natural resource extraction and their implications for sustainable resource use policies. Eco Econ. 64(2):444–453. doi: 10.1016/j.ecolecon.2007.02.034.
- Ben Amar A. 2021. Economic growth and environment in the United Kingdom: robust evidence using more than 250 years data. Environ Econ Pol Stud. 23(4):1–15. doi: 10.1007/s10018-020-00300-8.
- Breusch TS, Pagan AR. 1980. The lagrange multiplier test and its applications to model specification tests in econometrics. Rev Eco Stud. 47(1):239–253. doi: 10.2307/2297111.
- Caglar AE. 2023. Can nuclear energy technology budgets pave the way for a transition toward low‐carbon economy: insights from the United Kingdom. Sus Dev. 31(1):198–210. doi: 10.1002/sd.2383.
- Carson RT, Jeon Y, McCubbin DR. 1997. The relationship between air pollution emissions and income: US data. Environ Dev Econ. 2(4):433–450. doi: 10.1017/S1355770X97000235.
- Chen F, Ali S, Ma J, Arshad S, Ahmad S. 2023. Material productivity and environmental degradation: Moderating role of environment-related technologies in achieving carbon neutrality. Gond Res. 117:155–168. doi:10.1016/j.gr.2023.01.010.
- Dogan E, Turkekul B. 2016. CO2 emissions, real output, energy consumption, trade, urbanization and financial development: testing the EKC hypothesis for the USA. Environ Sci Pollut Res. 23(2):1203–1213. doi: 10.1007/s11356-015-5323-8.
- Dumitrescu EI, Hurlin C. 2012. Testing for Granger non-causality in heterogeneous panels. Econ Model. 29(4):1450–1460. doi: 10.1016/j.econmod.2012.02.014.
- Fischer-Kowalski M, Krausmann F, Pallua I. 2014. A sociometabolic reading of the Anthropocene: Modes of subsistence, population size and human impact on Earth. Anthrop Rev. 1(1):8–33. doi: 10.1177/2053019613518033.
- Flachenecker F, Kornejew M. 2019. The causal impact of material productivity on microeconomic competitiveness and environmental performance in the European Union. Environ Econ Pol Stud. 21(1):87–122. doi: 10.1007/s10018-018-0223-z.
- Fosten J, Morley B, Taylor T. 2012. Dynamic misspecification in the environmental Kuznets curve: evidence from CO2 and SO2 emissions in the United Kingdom. Ecol Econ. 76:25–33. doi:10.1016/j.ecolecon.2012.01.023.
- Gan Y, Zhang T, Liang S, Zhao Z, Li N. 2013. How to deal with resource productivity. J Indust Ecol. 17(3):440–451. doi: 10.1111/j.1530-9290.2012.00547.x.
- Giljum S, Behrens A, Hinterberger F, Lutz C, Meyer B. 2008. Modelling scenarios towards a sustainable use of natural resources in Europe. Environ Sci Pol. 11(3):204–431. doi: 10.1016/j.envsci.2007.07.005.
- Grossman GM, Krueger AB 1991. Environmental impacts of a North American free trade agreement. NBER working paper 3914. 10.3386/w3914.
- He J, Richard P. 2010. Environmental Kuznets curve for CO2 in Canada. Ecolo Econ. 69(5):1083–1093. doi: 10.1016/j.ecolecon.2009.11.030.
- Ike GN, Usman O, Alola AA, Sarkodie SA. 2020. Environmental quality effects of income, energy prices and trade: the role of renewable energy consumption in G-7 countries. Sci Total Environ. 721:137813. doi:10.1016/j.scitotenv.2020.137813.
- IPCC 2018. Summary for policymakers of IPCC special report on global warming of 1.5°C approved by governments. [Accessed May 2022]. https://www.ipcc.ch/2018/10/08/summary-for-policymakers-of-ipcc-special-reporton-global-warming-of-1-5c-approved-by-governments
- Iwata H, Okada K, Samreth S. 2010. Empirical study on the environmental Kuznets curve for CO2 in France: the role of nuclear energy. Energy Pol. 38(8):4057–4063. doi: 10.1016/j.enpol.2010.03.031.
- Kassouri Y, Alola AA, Savaş S. 2021. The dynamics of material consumption in phases of the economic cycle for selected emerging countries. Res Pol. 70:101918. doi:10.1016/j.resourpol.2020.101918.
- Kuznets S. 1955. Economic growth and income inequality. Ameri Econo Rev. 45(1):1–28.
- Liu H, Kim H, Liang S, Kwon OS. 2018. Export diversification and ecological footprint: a comparative study on EKC theory among Korea, Japan, and China. Sus. 10(10):3657. doi: 10.3390/su10103657.
- Magazzino C. 2012. On the relationship between disaggregated energy production and GDP in Italy. Ener Environ. 23(8):1191–1207. doi: 10.1260/0958-305X.23.8.1191.
- Magazzino C. 2023. Ecological footprint, electricity consumption, and economic growth in China: geopolitical risk and natural resources governance. Emp Econ. 1–25. doi: 10.1007/s00181-023-02460-4.
- Magazzino C, Adedoyin FF, Bilgili F, Shahzad U. 2023a. If tourism induces the EKC hypothesis, how does governance moderate its impact in the EU without the UK? Int J Sustainable Dev World Eco. 30(6):1–14. doi: 10.1080/13504509.2023.2189321.
- Magazzino C, Gallegati M, Giri F. 2023b. The environmental Kuznets curve in a long-term perspective: Parametric vs semi-parametric models. Environ Impact Assess Rev. 98:106973. doi:10.1016/j.eiar.2022.106973.
- Mazzanti M, Montini A, Zoboli R. 2008. Environmental Kuznets curves for air pollutant emissions in Italy: evidence from environmental accounts (NAMEA) panel data. Econ Sys Res. 20(3):277–301. doi: 10.1080/09535310802344356.
- Mushafiq M, Prusak B. 2023. Resource productivity and environmental degradation in EU-27 countries: context of material footprint. Environ Sci Pollut Res. 30(20):1–17. doi: 10.1007/s11356-023-26631-z.
- OECD. 2008. Measuring material flows and resource productivity, vol I. The OECD guide. Paris: OECD.
- Olale E, Ochuodho TO, Lantz V, El Armali J. 2018. The environmental Kuznets curve model for greenhouse gas emissions in Canada. Journ Clean Prod. 184:859–868. doi:10.1016/j.jclepro.2018.02.178.
- Ozturk I, Acaravci A. 2010. CO2 emissions, energy consumption and economic growth in Turkey. Ren Sus Energy Rev. 14(9):3220–3225. doi: 10.1016/j.rser.2010.07.005.
- Pata UK. 2021. Renewable and non-renewable energy consumption, economic complexity, CO 2 emissions, and ecological footprint in the USA: testing the EKC hypothesis with a structural break. Environ Sci Pollut Res. 28:846–861. doi:10.1007/s11356-020-10446-3.
- Pata UK, Kartal MT, Erdogan S, Sarkodie SA. 2023. The role of renewable and nuclear energy R&D expenditures and income on environmental quality in Germany: Scrutinizing the EKC and LCC hypotheses with smooth structural changes. Appl Ener. 342:121138. doi:10.1016/j.apenergy.2023.121138.
- Pata UK, Samour A. 2022. Do renewable and nuclear energy enhance environmental quality in France? A new EKC approach with the load capacity factor. Prog Nuc Ener. 149:104249. doi:10.1016/j.pnucene.2022.104249.
- Pesaran MH, 2004. General Diagnostic tests for cross Section dependence in panels, Cambridge Working Papers in Economics. 435. 10.2139/ssrn.572504.
- Pesaran MH. 2007. A simple panel unit root test in the presence of cross‐ Section dependence. Journ Appl Econo. 22(2):265–312. doi: 10.1002/jae.951.
- Pesaran MH, Yamagata T. 2008. Testing slope homogeneity in large panels. Journ Econo. 142(1):50–93. doi: 10.1016/j.jeconom.2007.05.010.
- Rafindadi AA. 2016. Revisiting the concept of environmental Kuznets curve in period of energy disaster and deteriorating income: Empirical evidence from Japan. Ener Pol. 94:274–284. doi:10.1016/j.enpol.2016.03.040.
- Schandl H, West J. 2010. Resource use and resource efficiency in the Asia-Pacific region. Glob Environ Chang. 20(4):636–647. doi: 10.1016/j.gloenvcha.2010.06.003.
- Schütz H, Steurer A. 2001. Economy-wide material flow accounts and derived indicators. A methodological guide. Luxembourg: Office for Official Publications of the European Communities.
- Selden TM, Song D. 1994. Environmental quality and development: is there a Kuznets curve for air pollution emissions? Journ Environ Econo Manag. 27(2):147–162. doi: 10.1006/jeem.1994.1031.
- Shahbaz M, Balsalobre D, Shahzad SJH. 2019. The influencing factors of CO 2 emissions and the role of biomass energy consumption: statistical experience from G-7 countries. Environ Mode Assess. 24(2):143–161. doi: 10.1007/s10666-018-9620-8.
- Shahbaz M, Khan S, Ali A, Bhattacharya M. 2017. The impact of globalization on CO2 emissions in China. Singa Econ Rev. 62(4):929–957. doi: 10.1142/S0217590817400331.
- Steger S, Bleischwitz R. 2011. Drivers for the use of materials across countries. Journ Clean Prod. 19(8):816–826. doi: 10.1016/j.jclepro.2010.08.016.
- Steinberger JK, Krausmann F. 2011. Material and energy productivity. Environ Sci Technol. 45(4):1169–1176. doi: 10.1021/es1028537.
- Suri V, Chapman D. 1998. Economic growth, trade and energy implications for the environmental Kuznets curve. Ecol Econ. 25(2):195–208. doi: 10.1016/S0921-8009(97)00180-8.
- Swamy PAVB. 1970. Efficient Inference in a Random coefficient Regregression. Mod Econo. 38(2):311–323. doi: 10.2307/1913012.
- Talmon-Gros L. 2014. Development patterns of material productivity. Springer Intern Publishing. doi: 10.1007/978-3-319-02538-4.
- Usman O. 2023. Renewable energy and CO2 emissions in G7 countries: does the level of expenditure on green energy technologies matter? Environ Sci Pollut Res. 30(10):26050–26062. doi: 10.1007/s11356-022-23907-8.
- Usman O, Alola AA. 2022. How do environmental taxes influence the effect of tourism on environmental performance? Evidence from EU countries. Curr Issu Tour. 1–18. doi: 10.1080/13683500.2022.2157706.
- Usman O, Alola AA, Ike GN. 2021. Modelling the effect of energy consumption on different environmental indicators in the United States: the role of financial development and renewable energy innovations. Nat Res Forum. 45(4):441–463. Oxford, UK: Blackwell Publishing Ltd. doi:10.1111/1477-8947.12242.
- Usman O, Alola AA, Saint Akadiri S. 2022. Effects of domestic material consumption, renewable energy, and financial development on environmental sustainability in the EU-28: Evidence from a GMM panel-VAR. Ren Ener. 184:239–251. doi:10.1016/j.renene.2021.11.086.
- Usman O, Iorember PT, Jelilov G, Isik A, Ike GN, Sarkodie SA. 2021. Towards mitigating ecological degradation in G-7 countries: accounting for economic effect dynamics, renewable energy consumption, and innovation. Heliyon. 7(12):e08592. doi: 10.1016/j.heliyon.2021.e08592.
- Wang T, Yu Y, Zhou W, Liu B, Chen D, Zhu B. 2016. Dynamics of material productivity and socioeconomic factors based on auto-regressive distributed lag model in China. J Clean Prod. 137:752–761. doi:10.1016/j.jclepro.2016.07.161.
- Westerlund J. 2008. Panel cointegration tests of the Fisher effect. J Appl Econ. 23(2):193–233. doi: 10.1002/jae.967.
- West J, Schandl H, Krausmann F, Kovanda J, Hak T. 2014. Patterns of change in material use and material efficiency in the successor states of the former Soviet Union. Ecol Econ. 105:211–219. doi:10.1016/j.ecolecon.2014.06.013.
- World Bank 2016. The cost of air pollution: Strengthening the economic case for action. The World Bank and Institute for Health Metrics and Evaluation University of Washington, Seattle; [Accessed December 2017]. https://openknowledge.worldbank.org/handle/10986
- Xin Y, Ajaz T, Shahzad M, Luo J. 2023. How productive capacities influence trade-adjusted resources consumption in China: Testing resource-based EKC. Res Pol. 81:103329. doi:10.1016/j.resourpol.2023.103329.
- Zambrano‐Monserrate MA, Fernandez MA. 2017. An environmental Kuznets curve for N2O emissions in Germany: an ARDL approach. Nat Res Forum. 41(2):119–127. Oxford, UK: Blackwell Publishing Ltd. doi:10.1111/1477-8947.12122.