
 ?Mathematical formulae have been encoded as MathML and are displayed in this HTML version using MathJax in order to improve their display. Uncheck the box to turn MathJax off. This feature requires Javascript. Click on a formula to zoom.
ABSTRACT
The evaluation of regional ecological status has far-reaching significance for understanding regional ecological conditions and promoting sustainable development. Herein, a geospatial ecological index (GEI) was developed on the basis of Landsat data and the principles of soil lines and spatial geometry. Specifically, the GEI integrates four remote sensing indicators: Perpendicular Vegetation Index (PVI) representing greenness, Modified Perpendicular Drought Index (MPDI) representing drought, Normalized Difference Built-up and Soil Index (NDSI) representing the dryness of land surface, and Land Surface Temperature (LST) representing the hotness of land surface. Two typical regions, Fuzhou City and Zijin mining area, in Fujian Province, China, were selected to evaluate regional ecological quality via the proposed GEI. The results show an improvement in the overall ecological quality of Fuzhou City, with an increase in the average GEI value from 0.49 in 2001 to 0.53 in 2020. In the case of the Zijin mining area, regions with poor ecological status are concentrated in the main mining areas. However, the average GEI value rose from 0.51 in 1992 to 0.57 in 2020, illustrating an improvement in its ecological conditions. The study demonstrates the robustness and effectiveness of GEI, objectively revealing the spatial distribution and ecological status.
1. Introduction
Since the 21st century, the process of urbanization has been rapidly accelerating (Zhang et al. Citation2018; Hu and Xu Citation2018; Wang et al. Citation2019; Kuang Citation2020; Choudhury et al. Citation2023). This has led to changes in the natural environment and an intensification of the conflict between human beings and land (Seifollahi-Aghmiuni et al. Citation2022). Additionally, ecological problems have become increasingly complex, with ecological damage gradually becoming region-specific. Regional ecology, as a crucial aspect of global ecology, not only directly impacts the ecological status of each region, but also influences the region’s socio-economic benefits and human settlements. Consequently, it has become imperative to address the urgent issue of how to evaluate ecological quality and status, diagnose existing ecological problems, and ultimately restore ecological health. However, it is important to note that ecological conditions vary across regions. The sub-ecosystems and factors impacting each region’s system differ, thereby resulting in distinct ecological issues and a continually changing ecological status within the region (Batunacun et al. Citation2019; Wei et al. Citation2020). Therefore, the construction of appropriate indicators and methods to evaluate regional ecology has emerged as a prominent research area (Gibbons et al. Citation2020; Haq et al. Citation2022; Yang and Li Citation2022).
So far, there is no standard method for ecological quality evaluation. The existing methods for ecological quality evaluation involve various disciplines and are becoming increasingly diverse, such as emergy analysis (Golshani et al. Citation2022), principal component analysis (Akakuru et al. Citation2023), indicator weight analysis (Li et al. Citation2020), fuzzy evaluation (Zhu Citation2022), among others. Of them, the preferred method involves constructing remote sensing ecological indices using multiple factors to evaluate ecology. This approach takes into account both the complexity of the ecological situation and the rationality and scientific basis of the selected indicators. Currently, many scholars opt for the use of comprehensive ecological indicators in their evaluations (Yan et al. Citation2017; Cui et al. Citation2019; Shan et al. Citation2019; Wu and Hu Citation2020).
From the perspective of research and the advantages of considering multiple factors, the Ministry of Environmental Protection of the People’s Republic of China issued the ‘Technical Criterion for Ecosystem Status Evaluation’ in the form of national standards in 2006. The Ecological index (EI) was proposed in this criterion and was later revised in 2015 (Ministry of Environmental Protection Citation2015). However, some indicators used in EI are difficult to acquire, and it is hard to effectively establish universally applicable normalization coefficients across diverse regions. In addition, the EI-assessed results of regional ecological status cannot be visualized. Some scholars used the weighted-sum calculation method to develop ecological indices (Huang and Peng Citation2015; Lu et al. Citation2018; Saedpanah and Amanollahi Citation2019; Park et al. Citation2020; Zhou Citation2022), but the subjective assignment of weights made the indices difficult to apply universally. Xu (Citation2013a) and Xu et al. (Citation2018) proposed the Remote Sensing-based Ecological Index (RSEI), which relies solely on remote sensing data, does not need to subjectively determine weights, and can be visually represented. RSEI enables quick, visual, quantitative, and objective evaluation of regional ecological status and therefore, has been widely used in evaluating ecological quality in cities, vulnerable areas, and protected areas (Hu and Xu Citation2018; Yue et al. Citation2019; Qureshi et al. Citation2020; Yang et al. Citation2022; Naseri and Mostafazadeh Citation2023; Halder and Bose Citation2023). RSEI uses the first principal component (PC1) to transform the four components of greenness, humidity, dryness, and heat to generate the index. However, when the contribution of PC1 to the whole dataset is low, RSEI may not fully reflect the regional ecological quality. Amani et al. (Citation2017) developed the Temperature-Vegetation-soil Moisture Dryness Index (TVMDI) to measure the dryness of land surface based on a 3-dimensional (D) geometric space and a red-NIR spectral space. According to the principle of spatial geometry of Amani et al. (Citation2017), Zhou et al. (Citation2020) further developed the dryness index of Amani et al. into an ecological index, Vegetation-Moisture-Temperature Ecological Index (VMTEI), for evaluating regional ecological status with the 3D geometric space. However, either TVMDI or VMTEI has a limited number of indicators (only three), making it difficult to comprehensively depict regional ecological conditions.
In light of the existing issues and challenges mentioned above, while considering more comprehensive information, this study explores the role of the ‘soil line’ formed by the red and near-infrared bands in ecological quality assessment and builds a comprehensive ecological index with appropriate number of indicators. This study aims to: (1) explore multi-dimensional indicators suitable for assessing regional ecological conditions, (2) create a comprehensive ecological quality assessment index that can well express regional ecological quality and provide visualized time-space differentiation, and (3) promote the application of remote sensing techniques in the evaluation of regional ecological quality and provide a more scientific and reasonable theoretical basis for the construction of ecological indices.
Accordingly, a Geospatial ecological index (GEI) was proposed in this study. It is assumed that the index constructed in this index has a strong correlation with the ecological status and can effectively reflect the regional ecological quality. GEI was developed with a four-dimensional coordinate system following the principle of space geometry (Amani et al. Citation2017). The four coordinate axes of the system are represented by four indicators: Perpendicular Vegetation Index (PVI) to represent greenness (Richardson and CLJP Citation1977), Modified Perpendicular Drought Index (MDPI) to represent moisture (Ghulam et al. Citation2007), Normalized Difference Built-up and Soil Index (NDSI) to represent land surface dryness (Xu Citation2013a), and Land Surface Temperature (LST) to represent surface hotness. The GEI was applied in two typical regions in Fujian, southeastern China, to analyze long-term spatiotemporal changes in regional ecological qualities. This study would enhance the utilization of remote sensing techniques in assessing regional ecological quality and establish a more reasonable framework for the development of regional ecological indices.
2. Study area and data source
2.1. Study area
Fujian Province, located on the southeast coast of China at 23°33’-28°20’N, 115°50’-120°40’E, is recognized as the core area of the 21st Century Maritime Silk Road. Its land coastline is tortuous with a length of around 3751.5 km. The total land area of the province is 12.4 × 10⁴ km2 (Bao and Chen Citation2018).
Fujian Province belongs to the subtropical monsoon climate zone, characterized by a mild climate, and is surrounded by mountains and rivers. Its terrain is high in the northwest, with the highest elevation reaching 2158 m, and low in the southeast, with the elevation generally below 1000 m. The topography predominantly consists of mountains and hills which account for over 80% of the total provincial area. Additionally, Fujian Province benefits from a warm climate, abundant sunlight, and ample rainfall. It has an annual average temperature of 20 to 25°C, an annual average sunshine duration of 1700 to 1980 hours, and an annual average precipitation of 900 to 2100 mm (http://fj.weather.com.cn/zxfw/qhgb/04/3614148.shtml). These favorable conditions have contributed to a forest coverage rate of 66.8% throughout the province. Fujian Province has an excellent ecological environment with clean rivers and air quality. It features a dense network of rivers and streams across its territory. Nevertheless, in recent years, the province has experienced continuous migration of residents from mountainous regions to coastal cities, resulting in a concentration of population in developed urban areas like Fuzhou and Xiamen cities. The development of built-up areas, mining sites, factories, and the reclamation of hillsides have all contributed to the reduction of green spaces and intensified soil erosion. Moreover, the coastal areas of Fujian Province frequently face natural disasters such as typhoons and floods. This further impacts the regional ecological environment. Therefore, this study selected two representative regions in Fujian for investigation, which are Fuzhou City and the Zijin mining area.
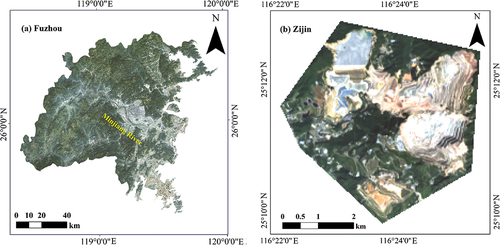
Fuzhou, as the provincial capital, serves as a prime example to showcase the application of GEI in developed coastal urban areas. In recent years, research on Fuzhou ecology mainly focused on ecological environmental vulnerability, ecosystem services, land use change, landscape risk (Xu et al. Citation2021), etc. Additionally, several researchers assessed Fuzhou’s ecological state using RSEI and RSEI-based indices (Hu and Xu Citation2018; Lin Citation2018; Shi et al. Citation2023). Their results showed that RSEI experienced a downward trend from 2000 to 2016. On the other hand, Zijin is a large mining area, which is mainly for copper and gold mining (https://www.zjky.cn/). The mine was explored by the Zijin Mining Group starting in 1993 and has experienced mining exploration, soil erosion, and subsequent ecological restoration. Most of the research on the Zijin mining area focused on local geology, mining, heavy metal risk assessment, and soil and water conservation. Consequently, the selection of these two regions in Fujian holds crucial strategic and practical importance for this research. This will facilitate the validation of the applicability and practicality of the new index, GEI, while also contributing to regional ecological conservation and sustainable development. The two research areas are shown in .
Figure 1. The natural color image showing the study areas of Fuzhou’s main urban area (a) and the zijin mining area (b).
2.2. Research data
This study used remote sensing data from Landsat 8 OLI/TRIS and Landsat 5 TM images as main data sources. In order to mitigate the influence of seasonal variations on remote sensing images, the images were acquired during the month of October when cloud cover was minimal. The remote sensing images selected for this study comprise Fuzhou images in the autumns of 2001, 2013, and 2020 and the images of the Zijin mining area in the autumns of 1992, 2014, 2018, and 2020. The coordinate system for each image data is WGS_1984/UTM_Zone_50N. All images were downloaded from the United States Geological Survey website (https://earthexplorer.usgs.gov) and have undergone a series of preprocessing, including atmospheric correction and geometric correction. provides the acquisition dates of each image and the average meteorological data for the five days preceding each acquisition date. The data shows that the weather conditions in each study year were similar in either of the two study areas.
Table 1. The acquisition dates of each image and the average meteorological data for the five days preceding each acquisition date.
Field investigations were carried out to gain a comprehensive understanding of the topography, hydrological environment, vegetation distribution, and ecological status of the study area. Fuzhou City was surveyed in September and October 2020, while the Zijin mining area investigations took place in early 2021. Representative sites with distinctive characteristics were selected for the investigation, employing fixed-point photography. Recorded information encompassed location details, feature type, and preliminary ecological condition judgments. A total of 137 sites were visited.
3. Research method
3.1. Indicators selected for GEI
Ecological quality refers to the overall health and condition of an ecosystem (Paetzold et al. Citation2010; Sturbois et al. Citation2023). The ecological quality of an ecosystem is influenced by a range of natural and anthropogenic factors (Bastos et al. Citation2023). However, a single indicator is limited in its ability to represent the entirety of regional ecological conditions, as it can only capture a specific aspect. Consequently, relying solely on a single indicator makes it challenging to obtain a comprehensive understanding of the overall ecological quality across the entire region. To overcome this limitation, it is crucial to consider multiple indicators comprehensively when conducting an evaluation, as they collectively provide a more holistic picture of the regional ecological status. Therefore, this paper chooses four indicators to synthesize the GEI.
It is impossible to consider all ecological impact factors for ecological assessment. Only indicators that have important ecological significance and are widely applied can be selected. Among various remote sensing indicators, greenness, drought, surface dryness, and surface hotness are the four indicators that represent natural and anthropogenic factors and have been widely used to evaluate ecological status (Nichol Citation2005; Gupta et al. Citation2012; Xu Citation2013b). Researchers commonly use these four indicators to evaluate ecological quality (Amani et al. Citation2017; Kamran and Yamamoto Citation2023). Through statistical analysis, it is also found that vegetation, land use, surface water, and temperature are also the four keywords in the literature in which index-based ecological evaluation was involved. Therefore, greenness, drought, surface dryness, and surface hotness are the four indicators chosen for GEI.
The vegetation index often serves as an indicator of regional greenness, reflecting regional vegetation coverage and vitality. The drought index signifies land’s drought status, with soil moisture levels indirectly reflecting the regional ecological vitality and livability. When soil moisture declines to a certain level, it can have a detrimental impact on vegetation health, subsequently influencing the overall ecological quality. The surface dryness index includes two components: the impervious surface index and the bare soil index. Impervious surfaces typically refer to artificial surfaces such as buildings and paved roads that have low permeability (Xu Citation2010). Generally, cities have a high proportion of impervious surfaces. The intensification of urbanization has caused a significant increase in the proportion of impervious surfaces, leading to the ‘drying’ of land surfaces. Bare soil refers to the land surfaces devoid of vegetation, which is a typical manifestation of soil erosion (Xu Citation2013b). Therefore, bare soil also signifies the ‘drying’ of the surface. The degree of surface dryness has a strong influence on the regional ecology. Fujian has experienced a significant rise in temperature in recent years, leading Fuzhou to become one of the ‘new four major furnaces’ in China. As such, temperature conditions represent an important factor in measuring ecological quality. To sum up, the four indicators, greenness, drought, surface drying degree, and heat, selected for constructing the new ecological index in this study are representative and reasonable.
3.2. Construction of GEI
Amani et al. (Citation2017) used a 3-D geometric space to develop TVMDI for detecting land surface dryness. The 3-D space was constructed using three indicators, PVI, LST, and SM (soil moisture) as three variables. Based on this spatial geometry principle, a 4-D coordinate system was constructed in this study for GEI, which was composed of four indicators and thus can be expressed as a function of the following:
In this work, G, D1, D2, and T refer to four remote sensing indices: PVI, MPDI, NDSI, and LST, respectively. A literature review found that PVI and MPDI have been applied in estimating ground vegetation cover (Amani et al. Citation2017; Asadi et al. Citation2019; Zhou et al. Citation2019) and monitoring soil’s water content and land surface drought conditions (Amani et al. Citation2017; Zormand et al. Citation2017; Wang et al. Citation2020; Yue et al. Citation2021), respectively. NDSI was the main index used for surface dryness measurement (Xu Citation2013a; Yang et al. Citation2022). Moreover, LST has been extensively used to evaluate the urban heat island effect (Estoque et al. Citation2017; Yin et al. Citation2018; Zhou et al. Citation2019). Therefore, the four indices can well represent the four indicators: greenness, drought, surface drying degree, and heat.
By incorporating the four remote sensing indices, the four-dimensional space of ecological quality can be captured, and the remote sensing definition of GEI can be expressed as:
These four indicators-generated GEI allows for a visual representation of the regional ecological status.
First, the PVI and MPDI are calculated with the assistance of the soil line equation. The soil line is a linear relationship between red (x) and near-infrared (y) bands. This line represents the distribution of different soil types having distinct characteristics. The soil line holds significant importance in understanding various ecological characteristics, such as soil energy change, water cycle, and vegetation growth and development (Qin et al. Citation2012). The soil line in remote sensing images can be extracted based on the three-dimensional drought index (Amani et al. Citation2017), soil-line equation (Qin et al. Citation2012), and the VTMEI index (Zhou et al. Citation2020).
Richardson and CLJP (Citation1977) proposed the PVI based on the vertical distance from any point in the spectral feature space to the soil line to indicate the vegetation coverage in an area. To achieve high accuracy, the influence of soil background was taken into account and incorporated into the calculation of the PVI. This was done due to the variations in reflectance between bare soil and different types of vegetation, which can affect the accuracy of the index. The PVI is expressed as:
where ρNIR and ρRed represent the surface reflectance in the near-infrared and red bands respectively, and M and I represent the slope and intercept of the soil line, respectively.
The ecological significance of PVI is to characterize the greenness and vitality of vegetation, which plays an important role in monitoring the ecological environment of vegetation. PVI is a dimensionless index, with the value ranging mostly between [−1,1].
Zhan et al. (Citation2006) proposed the Perpendicular Drought Index (PDI) as a means to characterize soil drought status by measuring the distance from any point in the feature space of red and near-infrared bands to the soil baseline. PDI ignores the strong scattering characteristics of surface vegetation on red light and near-infrared lights and is suitable for large areas of bare soil or desert areas but not for areas covered by vegetation. To overcome this problem, Ghulam et al. (Citation2007) developed the Modified Perpendicular Drought Index (MPDI) by deconvoluting the mixed pixels in remote sensing imagery, which reduced the influence of vegetation coverage on the scattering of red and near-infrared lights and obtained the pixel reflectance of soils. Comparing MPDI with PDI calculated using Landsat images, it was found that the results of the two were similar on bare soil surfaces, but better results for MPDI were achieved on surfaces with greater vegetation coverage (Ghulam et al. Citation2007). MPDI can be expressed as:
where ρS,Red represents the reflectance of bare soil in the red light, while ρS,NIR represents the reflectance of bare soil in the near-infrared light. MPDI is also a dimensionless index, with the value ranging mostly between [−1,1]. Its ecological significance is to characterize soil moisture and drought conditions.
The key improvement achieved by MPDI lies in dealing with the influence of vegetation coverage. During the calculation process, the influence of vegetation coverage in the mixed pixel is removed. Assuming that the pixel consists of two end-members (bare soil and vegetation), then the reflectance of the mixed pixel is the linear combination of the proportion of soil to vegetation. As such, the MPDI can be further derived as:
According to Ghulam et al. (Citation2007), ρV,Red and ρV,NIR can be set as 0.05 and 0.5, respectively. fv is the vegetation coverage index, which was calculated based on the equation of Baret et al. (Citation1995):
where NDVIMAX and NDVIMIN correspond to areas with 100% vegetation cover and bare soil, i.e. 0% vegetation cover, respectively. The NDVI (Huang et al. Citation2021) can be computed as follows:
NDVI s a dimensionless index, with its value ranging between [−1,1].
The value of MPDI is determined by two factors: vegetation coverage and soil drought. The larger the MPDI, the drier the surface. On the bare soil surface, water content has a great influence on MPDI, while on the surfaces covered by vegetation, MPDI is determined by the vegetation coverage. An increase in either water content or vegetation coverage will decrease MPDI.
The dryness indicator is represented by the Normalized Difference built-up and Soil Index (NDSI), which consists of the Index-based Built-up Index (IBI) (Xu Citation2008) and the Soil Index (SI) (Rikimaru et al. Citation2002). The NDSI can be computed as follows:
where SI represents bare soil and is expressed as:
IBI stands for the built-up lands and is expressed as:
NDSI is also a dimensionless index, with its value ranging between [−1,1]. It represents the dryness of land surfaces caused by bare soils and built-up lands (Xu Citation2013a).
The names of the dryness indicator and the drought indicators sound quite similar. However, there are clear differences between the two indicators. As can be seen from the equations used to construct them, the dryness indicator (represented by NDSI) is derived from the combination of the building index (IBI) and the bare soil index (SI), mainly examining the dryness of the land surface caused by construction and exposure, without considering vegetation cover. On the other hand, the drought indicator (represented by MDPI) includes the parameter M derived from the soil line, as well as variables related to vegetation, such as ρV,Red, ρV,NIR, and fv, which are helpful in reflecting the level of drought in vegetated areas, something that NDSI cannot reflect.
The heat indicator is represented by land surface temperature (LST), an important metric used to evaluate regional thermal conditions. It refers to the effective temperature of energy exchange between the surface and the atmosphere. LST is closely related to regional ecological conditions (Zhu et al. Citation2019; Siddique et al. Citation2021; Xu et al. Citation2021; Liang et al. Citation2022). The calculation of the LST is based on the mono-window algorithm of Qin et al. (Citation2001). Due to the complexity of the algorithm, it is not detailed here. The unit of LST is oC.
LST can affect the ecological quality as there is a close relationship between LST and ecological quality. For example, the increase or decrease of LST can affect the growth and development of plants. Excessive or insufficient temperatures may cause stress to plants, resulting in slowed growth or leaf fall. This can have an impact on the structure and dynamics of plant communities and subsequently affect the ecological quality (Rahaman et al. Citation2022; Ding et al. Citation2023). Changes in LST can affect the distribution and supply of water resources. High-LST conditions may increase the rate of water evaporation, worsen the problem of drought, and thus affect the ecological quality.
The LST (temperature) indicator has been found to have a correlation with the vegetation (greenness) indicator (Rahaman et al. Citation2022; Ding et al. Citation2023). However, the correlation between the two is negative rather than positive (Wang et al. Citation2023; Yang et al. Citation2023). This indicates that the two indicators represent two opposing factors that affect the ecology and hence cannot be substituted for each other. Having both greenness and temperature as indicators in GEI helps to assess both positive and negative aspects of an area’s ecology.
Finally, the four indices were combined to calculate the index GEI. Based on the Red-NIR spectral space, a two-dimensional feature space was constructed with M point serving as the origin, PVI as the x-axis, and MPDI as the y-axis. LST and NDSI were then added into this two-dimensional space as the z-axis and t-axis, respectively, to complete the construction of the four-dimensional feature space. On the PVI-MPDI plane, each point represents the vegetation and soil drought characteristics of that pixel. The higher the PVI, the higher the vegetation coverage and the better the vegetation growth. On the other hand, the greater the MPDI, the lower the soil moisture content and the higher the drought degree. On the LST-NDSI plane, the higher the LST, the higher the surface temperature. Also, the higher the NDSI, the higher the degree of surface drying.
In order to eliminate the absolute difference caused by measurements in different periods and the difference in the data range of each indicator, it is necessary to normalize each indicator to the range of [0,0.5] before constructing GEI. Among them, the contribution of greenness to ecological status is positive, so the PVI was positively normalized, while LST, MPDI, and NDSI have a negative impact on ecological status, hence the LST, MPDI, and NDSI were reversely normalized. This ensures that all metrics are scaled within the data range of [0,0.5] for calculating the GEI. The forward and reverse normalization formulas are expressed as follows:
where Ni is the value after normalization; i is the value of index i.
illustrates the four-dimensional space. In this space, the pixels containing the highest desiccation level, highest temperature, minimum vegetation coverage, and maximum soil dryness represent the poorest ecological quality. The other end of the line segment represents the optimal ecological quality.
Figure 2. Feature spaces showing the principles for the construction of GEI.
Accordingly, GEI can be calculated with the four normalized indicators:
GEI has a data range between 0 and 1. A higher value of GEI, closer to 1, indicates a better ecological status, while a lower value indicates a poorer ecological status. Among the four indicators used in calculating GEI, PVI, MPDI, and NDSI have a resolution of 30 m, while the LST indicator has a resolution of 100 m. When these four indicators are calculated using EquationEquation (13)(13)
(13) to generate GEI, they actually have a fusion effect, and therefore, the resolution of the resulting GEI image remains at 30 m.
4. Results and discussion
Fuzhou City and the Zijin mining area in Fujian Province were selected as test locations to assess the effectiveness of the new index. These two areas possess distinct landforms, which in turn result in varied ecological conditions. This deliberate selection enables a more comprehensive and accurate evaluation of the rationality and practicality of GEI.
4.1. GEI application in Fuzhou city
4.1.1. Soil line fitting
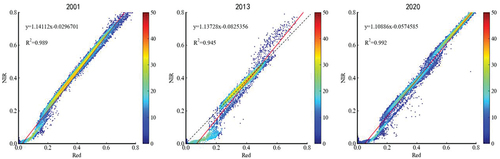
The soil lines for each study year (2001, 2013, and 2020) were calculated using the red band and the near-infrared band from Landsat TM/OLI images. The equations for the soil lines were derived as follows: y = 1.1411×-0.0297 (2001), y = 1.1373×-0.0825 (2013), and y = 1.1089×-0.0575 (2020), The R2 values for all three equations were greater than 0.9, indicating a strong fitness for the models (). This provides an excellent foundation for computing PVI and MPDI.
Figure 3. Fitted soil lines of Fuzhou city in 2001, 2013, and 2020.
4.1.2. Analysis of four indicators
Based on EquationEquation (3)(3)
(3) and the slope and intercept of the soil lines mentioned above, the PVIs of Fuzhou City were calculated for each of the three years ().
Figure 4. PVI images of Fuzhou City in 2001, 2013, and 2020.
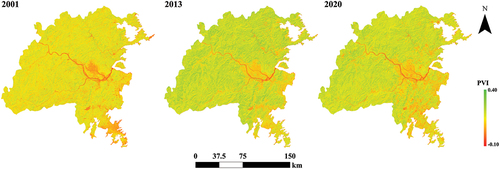
It can be observed that in the year 2001, the PVI values were relatively low, with an average of 0.1439. In contrast, the PVI values in 2013 showed an increase with an average of 0.1932. Consequently, the PVI image for 2013 appears much greener compared to the PVI image for 2001 (). The average PVI in 2020 decreased to 0.1777, resulting in a slight fading in green tone when compared to 2013. Although the PVI values in 2020 were slightly lower than those observed in 2013, the general increase of PVI values from 2001 to 2020 suggests a rise in vegetation abundance over time.
The MPDI values for Fuzhou City were calculated for the three study years using EquationEquations (4)(4)
(4) and (Equation5
(5)
(5) ), along with the slope and intercept of the soil lines ().
Figure 5. MPDI images of Fuzhou city in 2001, 2013, and 2020.
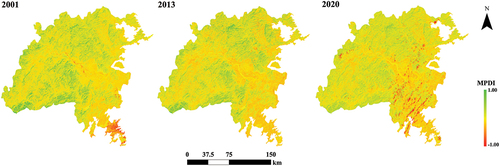
The MPDI analysis of Fuzhou City for the three years revealed a progressive increase in overall drought severity from 2001 to 2020 as the MDPI image in 2020 is more brownish in color compared to the previous years. The corresponding MPDI values for the three years are −0.0432, −0.0238, and −0.0051, respectively, showing an increasing trend. Notably, the mountainous areas surrounding the urban area of Fuzhou experienced an aggravated level of drought. However, the main urban areas situated along the banks of the Minjiang River displayed relatively stable drought severity. The contrast between high and low MPDI values across Fuzhou City highlights the varying degrees of drought experienced in different areas.
The NDSI for Fuzhou City was calculated by integrating the soil index (SI) and the built-up index (IBI), as shown in .
Figure 6. NDSI images of Fuzhou city in 2001, 2013, and 2020.
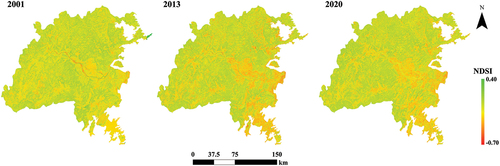
It is evident that the changes in surface dryness from 2001 to 2020 were predominantly concentrated in the main urban areas along the banks of the Minjiang River, as well as the eastern and southern regions of the city. In these areas, the areas with high surface dryness values gradually expanded. The remaining areas generally experienced minimal change. The average NDSI value was −0.2484 in 2001, −0.2287 in 2013, and −0.2346 in 2020, showing an overall stable state during the twenty-year period.
The LST in Fuzhou City was retrieved for the three years using the algorithm of (Qin et al. Citation2001). illustrates the LST images.
Figure 7. LST images of Fuzhou city in 2001, 2013, and 2020.
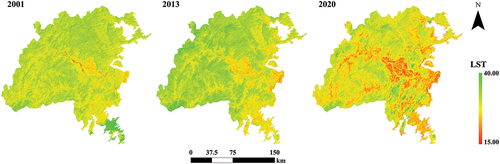
The LST images exhibit a noticeable increase in surface hotness in the areas impacted by urban expansions from 2001 to 2020. In the 2020 LST image, the green tone noticeably decreased, and urban areas exhibited large areas of brownish-red high-temperature zones.
4.1.3. GEI analysis
Following the computation of PVI, MPDI, NDSI, and LST and the normalization of the four indicators, GEI can be derived using EquationEquation (13)(13)
(13) and depicted in . The average GEI value for Fuzhou City was 0.4900 in 2001, 0.4948 in 2013, and 0.5321 in 2020, exhibiting an overall upward trend over the 20-year study period.
Figure 8. GEI analysis results of Fuzhou City in 2001, 2013, and 2020.
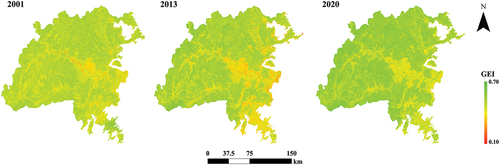
From , it can be observed that GEI exhibits a spatial pattern generally consistent with those of PVI, MPDI, LST, and NDSI ().
In terms of temporal variations, the expansion of the main urban areas has resulted in a significant increase in areas with poorer ecological quality, as shown by the blown-to-red patches, particularly along the banks of the Minjiang River. This is due to the expansion of the main urban area. The urban sprawl has led to a decrease in vegetation covers and surface soil moisture, an increase in surface dryness, and the continuous rise of surface temperature, resulting in a significant increase in areas with poor ecological quality. Despite this, compared to 2001 and 2013, the greenness level in 2020 was relatively higher in the areas surrounding the central city area. The overall trend suggests a marked improvement in ecological quality, highlighting Fuzhou City’s prioritization of ecological development alongside urban and industrial expansion.
Regarding spatial distribution, regions with lower ecological quality are primarily concentrated in urban areas, including residential and commercial zones. These regions tend to display lower vegetation coverage, higher building density, higher land surface temperatures, and lower soil moisture. Conversely, areas with better ecological conditions are mainly found in surrounding mountainous regions with higher vegetation coverage, abundant forest cover, greater soil moisture, lower surface temperatures, and thus higher GEI values. These spatial patterns correspond well with real-world ecological dynamics.
The case of Fuzhou demonstrates that the GEI effectively captures and depicts the ecological conditions across different years and regions. Its utilization provides a valuable assessment of ecological quality, highlighting the impacts of urbanization while underscoring the importance of ecological conservation in Fuzhou City.
Finally, the calculation results were verified, the specific results are shown in . The GEI results were validated through on-site ground truth. It is observed that regions characterized by favorable ecological environments tend to possess higher GEI values, thus affirming the applicability and relevance of GEI in assessing ecological conditions.
Table 2. Typical field inspection sites in Fuzhou City with their corresponding GEI values.
The results of GEI were compared with those of RSEI to further understand the rationality of the index ().
Figure 9. The 2020 image of Fuzhou (left) and its corresponding GEI (center) and RSEI (right) images.
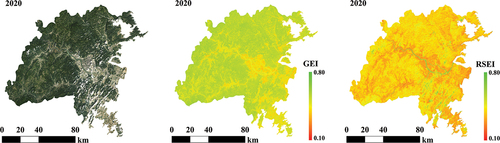
illustrates that both GEI and RSEI demonstrate a spatial distribution of ecological conditions that is highly consistent with the original image. Nevertheless, GEI can more effectively differentiate regions with good and poor ecological status. These differentiation in the RSEI result, however, is less pronounced. Therefore, GEI outperforms RSEI in characterizing the ecological status of different ecosystems in Fuzhou and more accurately reflects spatial distribution changes.
4.2. GEI application in the zijin mining areas
4.2.1. Soil line fitting
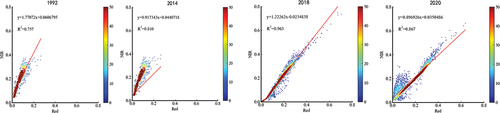
The soil lines in the Zijin mining area were determined using Landsat TM/OLI data for the study years 1992, 2014, 2018, and 2020. The linear equations representing the soil lines for each year are as follows: y = 1.77072× + 0.0606795 (1992), y = 0.9173× + 0.0441 (2014), y = 1.2226× − 0.0235 (2018), and y = 0.8969× + 0.0350 (2020), with R2 values greater than 0.80, except for the year 1992, which is 0.757 (). This indicates a good fit between the data points and the soil line equations.
Figure 10. Fitted soil lines of the zijin mining area in 1992, 2014, 2018, and 2020.
4.2.2. Analysis of four indicators
The PVI values of the Zijin mining area were calculated based on EquationEquation (3)(3)
(3) and the slope and intercept of the soil lines. The resultant PVI images are displayed in .
Figure 11. PVI images of the zijin mining area in 1992, 2014, 2018, and 2020.
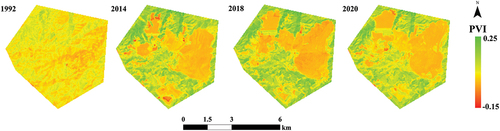
The PVI image in 1992 displayed a yellowish tone, suggesting relatively low PVI values in the Zijin area despite no mining activities in the area at that time. However, the subsequent PVI images from 2014 to 2020 reveal the influence of mining exploration, exhibiting distinct spatial patterns. In the eastern regions, lower PVI values are observed, characterized by brownish hues, while the western areas display higher PVI values with dominant green tones. This stark contrast indicates the impact of mining operations on vegetation cover. The average PVI values of the Zijin mining area varied from 0.0379 in 1992 to 0.0719 in 2018. The standard deviation has risen from 0.0279 in 1992 to 0.0759 in 2018, indicating more heterogeneous PVI patterns. In spite of the decline of the average PVI value to 0.0638 in 2020, the trend of the PVI demonstrates an overall increase over the 28-year study period, suggesting a general progressive greening phenomenon in the area.
Based on EquationEquations (4)(4)
(4) and (Equation5
(5)
(5) ) along with the slope and intercept of the soil lines, the MPDI values for the study years were obtained. The MPDI value was 0.0074 in 1992, 0.1192 in 2014, decreased slightly to 0.0984 in 2018, and increased to 0.1647 in 2020, indicating a general increase in drought conditions. is the MPDI images of each study year.
Figure 12. MPDI images of the zijin mining area in 1992, 2014, 2018, and 2020.
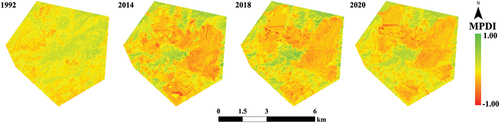
The color difference in also shows that from 1992 to 2014, the mining area experienced an escalation in drought conditions, while the surrounding areas exhibited a decrease in drought conditions. From 2014 to 2018, the mining area expanded in the northeastern area, while the areas remained relatively unchanged. From 2018 to 2020, there was a slight alleviation of drought conditions in the central parts of the mining area, accompanied by an increase in drought severity in the surrounding areas.
The NDSI values of the Zijin mining area were derived based on the SI and IBI, as shown in .
Figure 13. NDSI images of the zijin mining area in 1992, 2014, 2018, and 2020.
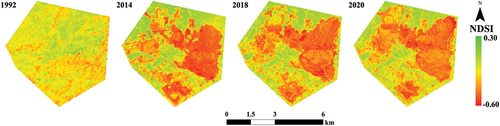
The NDSI results show a similar trend to the PVI and MPDI. In 1992, the surface aridity level in the Zijin mining area was relatively low, with an average of −0.1562 and a highest value of 0.1753. By 2014, the highest value increased to 0.3196, with an average of −0.0546, indicating an increase in surface aridity. In 2018, the degree of aridity continued to rise, reaching a highest value of 0.3454 and an average of −0.0503. In 2020, the highest level of surface aridity remained relatively stable at 0.3421 but the average value continues to rise to −0.0463. The development of the Zijin mining area has led to a 70% increase in aridity severity from 1992 to 2020 in terms of average NDSI values. However, during the period of mining development from 2014 to 2020, the aridity severity remained relatively stable, with only a 15% increase. This indicates that the development of the mining area still emphasizes ecological conservation.
The calculated LST results are provided in .
Figure 14. LST images of the zijin mining area in 1992, 2014, 2018, and 2020.
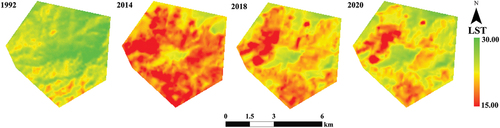
In 1992, the average land surface temperature (LST) in the Zijin mining area was relatively low at 19.64°C, which was lower than in subsequent study years. A few high-temperature areas can only be seen in the southern and northwestern parts of the region. By 2014, the LST increased due to mining activities, with an average reaching 26.86°C. However, by 2018, as the Zijin Mining Company prioritized ecological conservation and implemented certain measures, the average temperature decreased to 24.69°C. In 2020, the trend of decline continued, and the average temperature dropped further to 23.06°C.
Generally, the four indicators exhibited similar spatial change patterns from 2014 to 2020.
4.2.3. GEI analysis
To obtain a comprehensive assessment, the four indicators, PVI, MPDI, NDSI, and LST, were normalized to calculate GEI. illustrates the spatial distribution patterns of the calculated GEIs in the Zijin mining area from 1992 to 2020.
Figure 15. GEI images of the zijin mining area in 1992, 2014, 2018, and 2020.
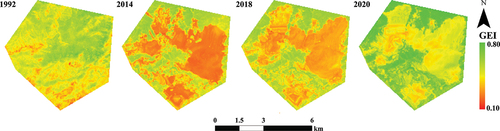
provides an overview of how the ecological conditions have evolved over time in the mining area based on the spatial distribution patterns of GEI.
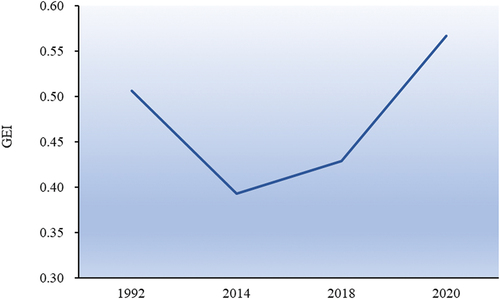
From a temporal perspective, it is apparent that the mining area has experienced ongoing expansion. The time-series study presented in this paper clearly reveals the ecological changes caused by the development of the Zijin mine (). Before the development of the mine in 1992, the value of GEI was 0.5065, with yellowish and brownish tones dominating the southern and northwestern areas (). The mining explorations have caused a decline in ecological quality in the region, leading to a drop in the GEI value to 0.3929 by 2014, a decline of 22% over these 12 years. This indicates that the development of the Zijin mine had caused serious ecological damage. Nevertheless, the region showed signs of improvement in ecological quality from 2014 to 2020, indicated by a pronounced increment in GEI values from 0.3929 in 2014 to 0.4289 in 2018 and further to 0.5672 in 2020, as depicted by intensified green hues and the diminishing of red and brown tones in the corresponding GEI images (). Therefore, despite the high-intensity mineral exploration in the region, the ecological conditions gradually recovered after an initial decline and even exceeded those of 1992, the year without mining activities. This is mainly due to the Zijin Mining Company’s emphasis on ecological restoration while mining and the establishment of a national-level mining park based on this foundation.
Figure 16. Change of GEI values over the study years in the zijin mining area.
It is important to recognize that the ecological improvements in 2020, surpassing the conditions of 1992, can be partially attributed to the initially low GEI value recorded for the area in 1992, which was merely 0.5065. This lower baseline is a reflection of suboptimal vegetation growth in the mountainous areas during that year, coupled with the presence of extensive patches of bare land despite no mining activities. This can be examined from the 1992 PVI and NDSI images ( and ), showing relatively low PVI and high NDSI values in the area. Consequently, the relatively modest ecological benchmark set in 1992 makes it more feasible to achieve and exceed in subsequent years.
Field inspections were carried out to substantiate the performance of GEI. presents some visited sites with their photographs and corresponding GEI values. It is noteworthy that forested mountain areas tend to exhibit GEI values exceeding 0.5, indicating a healthier ecological condition, whereas mining areas tend to display lower values below 0.3, indicating a more compromised ecological state. By juxtaposing the photographs and the GEI values, we can gain valuable insights into the correlation between the real-world ecological conditions and the quantitative GEI values. This helps to further reinforce the reliability and credibility of the GEI methodology utilized in this study.
Table 3. Typical field inspection sites in the zijin mining area and their corresponding GEI values.
Apart from the field inspections, we also conducted a validation via higher-resolution imagery. The Gaofen-1 image was used as a reference for the validation as the Gaofen-1 image’s 16 m resolution is higher than Landsat’s 30 m resolution.
The entire area-based comparison shows that the GEI result agrees well with the Gaofen-1 image (), indicating consistency with the actual ecological situation.
Figure 17. Comparison of the standard false-color synthesized gaofen-1 16m-resolution images with the GEI 30m-resolution image. (a) Entire area validation, left: gaofen-1 image, right: GEI image; (b) local area validation (area 1); and (c) local area validation (area 2).
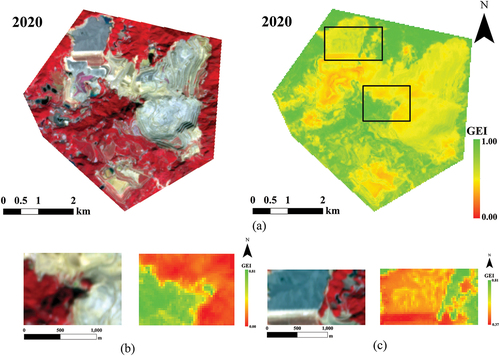
Area 1 in is situated at the heart of the Zijin mining area. It is evident that the area characterized by abundant vegetation coverage (red tone in Gaofen-1 image) has higher ecological quality (green tone in GEI image), whereas the mining area dominated by barren land (gray color) exhibits poor ecological quality (reddish color). The consistency between the Gaofen-1 and GEI images highlights the superior representation effect of GEI.
Area 2 is situated to the north of the Zijin Mining area. The resulting GEI image clearly illustrates the contrast between the impervious surface in the west of the area and the vegetation-covered area in the east, which aligns with the actual situation as depicted in the Gaofen-1 image.
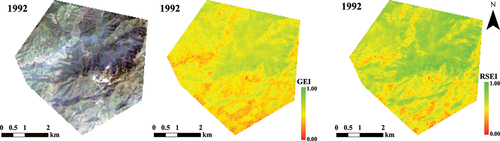
In order to further understand the rationality of GEI, RSEI of Xu (Citation2013a) was selected for comparison. is the images showing the ecological status of the Zijin mining area retrieved by these two different remote sensing ecological indices as well as the original natural color image. GEI again GEI once again demonstrates a better ability than RSEI to distinguish the spatial characteristics of ecology conditions.
Figure 18. Original image (left), GEI image (centre), and RSEI image (right) of the zijin mining area in 1992.
5. Conclusions
In this work, a novel geospatial ecological index (GEI) was proposed for remote sensing-based evaluation of regional ecological qualities based on the principles of soil lines and spatial geometry. Additionally, it was applied to reveal the ecological change and trend in Fuzhou and the Zijin mining area. The main findings of this study are as follows:
The GEI is a comprehensive four-dimensional remote sensing ecological index. It uses perpendicular vegetation index, perpendicular drought index, surface temperature, and desiccation index to represent four ecological indicators: greenness, aridity, surface dryness, and surface heat. By integrating these indices, the GEI can effectively capture the significant factors influencing ecological qualities. The GEI index has the following advantages:
It leverages remote sensing technology to rapidly, objectively, and comprehensively acquire regional ecological information, avoiding the time delay and incompleteness associated with traditional statistical data.
It comprehensively considers four factors influencing the ecological environment, thereby fully reflecting the regional ecological status and trend of change.
By employing standardized processing and spatial geometry construction methods, a four-dimensional coordinate system was established. This enables the comparison of ecological conditions across various regions under a unified dimension, thereby enhancing data interpretability and comparability without any loss of information.
The application of GEI in two representative regions in Fujian Province demonstrated the effectiveness of the index. GEI can find the spatial ecological differences that were closely related to land cover changes (urban expansion, mine exploration, etc.). In the case of Fuzhou City, the average GEI values increased from 0.49 to 0.53 during the study period, indicating a slight improvement in ecological conditions. The time series GEI images successfully revealed the spatiotemporal changes in the city’s ecological status. In contrast, the Zijin mining area experienced an expansion of mining zones, resulting in an increase in areas with poor ecological quality in the mining zone. However, the areas outside the mining zone exhibited a gradual improvement in ecological status. Therefore, the GEI values of the entire area increased from 0.51 to 0.57. The time series GEI images effectively captured the spatial variation in regional ecological conditions before and after mining explorations.
GEI was tested in subtropical areas characterized by abundant vegetation coverage. It may need to be further tested in different geographical areas with diverse climates, biomes, and disturbance regimes to ensure its applicability and robustness. Furthermore, each of the four indices used for GEI may have its alternatives. Therefore, in future research, it is necessary to select different indices for comparison to determine if there are more appropriate indices available. In the current methodology, the weight of each indicator was equally allocated based on the spatial geometry principle. The reasonableness of this weight allocation may need further evaluation.
Abbreviations
| GEI | = | Geospatial Ecological Index |
| PVI | = | Perpendicular vegetation index |
| NDSI | = | Normalized difference built-up and soil index |
| MPDI | = | Modified perpendicular drought index |
| LST | = | Land surface temperature |
Acknowledgments
We also thank for the help from Dr. Yu Ding from Wuhan University during works.
Disclosure statement
No potential conflict of interest was reported by the author(s).
Additional information
Funding
References
- Akakuru OC, Adakwa CB, Ikoro DO, Eyankware MO, Opara AI, Njoku AO, Iheme KO, Usman A. 2023. Application of artificial neural network and multi-linear regression techniques in groundwater quality and health risk assessment around egbema, southeastern Nigeria. Environ Earth Sci. 82(3):77. doi: 10.1007/s12665-023-10753-1.
- Amani M, Salehi B, Mahdavi S, Masjedi A, Dehnavi S. 2017. Temperature-Vegetation-soil Moisture Dryness Index (TVMDI). Remote sens. Environ. 197:1–14. doi: 10.1016/j.rse.2017.05.026.
- Asadi S, Bannayan M, Jahan M, Hosseini AF. 2019. Using the red-near infrared spectral to estimate ground cover based on vegetative indices. Int J Remote Sens. 40(18):7153–7168. doi: 10.1080/01431161.2019.1601282.
- Bao C, Chen S. 2018. Research on spatial difference of urban land use performance in fujian province based on “social-economic-ecological model”. Bull Soil Water Conserv. 38:279–285.
- Baret F, JGPW C, Steven MD. 1995. The robustness of canopy gap fraction estimates from red and near-infrared reflectances: a comparison of approaches. Remote Sens Environ. 54(2):141–151. doi: 10.1016/0034-4257(95)00136-O.
- Bastos A, Sippel S, Frank D, Mahecha MD, Zaehle S, Zscheischler J, Reichstein M. 2023. A joint framework for studying compound ecoclimatic events. Nat Rev Earth Environ. 4(5):333–350. doi: 10.1038/s43017-023-00410-3.
- Batunacun WR, Lakes T, Hu YF, Nendel C, Nendel C. 2019. Identifying drivers of land degradation in xilingol, China, between 1975 and 2015. Land Use Policy. 83:543–559. doi: 10.1016/j.landusepol.2019.02.013.
- Choudhury U, Singh S, Kumar A, Meraj G, Kumar P, Kanga S. 2023. Assessing land use/land cover changes and urban heat island intensification: a case study of kamrup metropolitan district, northeast India (2000-2032). Earth. 4(3):503–521. doi: 10.3390/earth4030026.
- Cui XG, Liu HM FC, Liu XF, Liu X. 2019. Assessing sustainability of urbanization by a coordinated development index for an urbanization-resources-environment complex system: a case study of jing-jin-ji region, China. Ecol Indic. 96:383–391. doi: 10.1016/j.ecolind.2018.09.009.
- Ding C, Meng Y, Huang W, Xie Q. 2023. Varying effects of tree cover on relationships between satellite-observed vegetation greenup date and Spring temperature across Eurasian boreal forests. Sci Total Environ. 899:165650. doi: 10.1016/j.scitotenv.2023.165650.
- Estoque RC, Murayama Y, Myint SW. 2017. Effects of landscape composition and pattern on land surface temperature: an urban heat island study in the megacities of southeast Asia. Sci Total Environ. 577:349–359. doi: 10.1016/j.scitotenv.2016.10.195.
- Ghulam A, Qin Q, Teyip T, Li ZL. 2007. Modified Perpendicular Drought Index (MPDI): a real-time drought monitoring method. ISPRS J Photogramm. 62(2):150–164. doi: 10.1016/j.isprsjprs.2007.03.002.
- Gibbons LV, Pearthree G, Cloutier SA, Ehlenz M. 2020. The development, application, and refinement of a regenerative development evaluation tool and indicators. Ecol Indic. 108:1105698. doi: 10.1016/j.ecolind.2019.105698.
- Golshani F, Asgharipour MR, Ghanbari A, Seyedabadi E. 2022. Environmental accounting for croplands, livestock husbandry, and integrated systems based on energetic indicators. Energ Ecol Environ. 8(1):28–49. doi: 10.1007/s40974-022-00262-5.
- Gupta K, Kumar P, Pathan SK, Sharma KP. 2012. Urban neighborhood green index – a measure of green spaces in urban areas. Landscape Urban Plan. 105(3):325–335. doi: 10.1016/j.landurbplan.2012.01.003.
- Halder S, Bose S. 2023. Ecological quality assessment of five smart cities in India: a remote sensing index-based analysis. Int J Environ Sci Technol. 21(4):4101–4118. doi: 10.1007/s13762-023-05270-4.
- Haq SM, Amjad MS, Waheed M, Bussmann RW, Prockow J. 2022. The floristic quality assessment index as ecological health indicator for forest vegetation: a case study from zabarwan mountain range, himalayas. Ecol Indic. 145:109670. doi: 10.1016/j.ecolind.2022.109670.
- Hu XS, Xu HQ. 2018. A new remote sensing index for assessing the spatial heterogeneity in urban ecological quality: a case from Fuzhou city, China. Ecol Indic. 89:11–21. doi: 10.1016/j.ecolind.2018.02.006.
- Huang HP, Peng XL. 2015. Evaluation of ecological and economic index in Poyang Lake ecological economic zone. Asian Agric Res. 7(2):56–61.
- Huang S, Tang LN, Hupy JP, Wang Y, Shao GF. 2021. A commentary review on the use of normalized difference vegetation index (NDVI) in the era of popular remote sensing. J Forestry Res. 32(1):1–6. doi: 10.1007/s11676-020-01155-1.
- Kamran M, Yamamoto K. 2023. Evolution and use of remote sensing in ecological vulnerability assessment: a review. Ecol Indic. 148:110099. doi: 10.1016/j.ecolind.2023.110099.
- Kuang WH. 2020. National urban land-use/cover change since the Beginning of the 21st Century and its policy implications in China. Land Use Policy. 97:104747. doi: 10.1016/j.landusepol.2020.104747.
- Li S, Zhao Y, Xiao W, Zhang H. 2020. Spatial and temporal differentiation of landscape ecological quality in Chaohu river basin. Trans Chin Soc Agric Mach. 51:203–213.
- Liang HW, Kasimu A, Ma HT, Zhao YY, Zhang XL, Wei BH. 2022. Exploring the variations and influencing factors of land surface temperature in the urban agglomeration on the northern slope of the tianshan mountains. Sustain. Sustainability. 14(7):10663. doi: 10.3390/su141710663.
- Lin Z. 2018. Study on the change of ecological status in Fuzhou city based on new remote sensing ecological index. Hai Xia Ke Xue. 6:33–36.
- Lu Y, Li X, Yang Z. 2018. Evaluation on eco-environmental quality change of Wujiang river basin in Guizhou province from 1990 to 2015. Bull Soil Water Conserv. 38(2):140–147.
- Ministry of Environmental Protection. 2015. Technical criterion for ecosystem status evaluation. Beijing, China: China Environmental Science Press.
- Naseri N, Mostafazadeh R. 2023. Spatial relationship of remote sensing ecological indicator (RSEI) and landscape metrics under urban development intensification. Earth Sci Inform. 16(4):3797–3810. doi: 10.1007/s12145-023-01119-z.
- Nichol J. 2005. Remote sensing of urban heat islands by day and night. Photogramm Eng Remote Sens. 71(5):613–621. doi: 10.14358/PERS.71.5.613.
- Paetzold A, Warren PH, Maltby LL. 2010. A framework for assessing ecological quality based on ecosystem services. Ecol Complex. 7(3):273–281. doi: 10.1016/j.ecocom.2009.11.003.
- Park Y, Lee SW, Lee J. 2020. Comparison of Fuzzy AHP and AHP in multicriteria inventory classification while planning green infrastructure for resilient stream ecosystems. Sustain. 12(21):9035. doi: 10.3390/su12219035.
- Qin Q, You L, Zhao Y, Zhao S, Yao Y. 2012. Soil line automatic identification algorithm based on two-dimensional feature space. TCSAE. 28:167–171.
- Qin ZH, Zhang MH, Karnieli A, Berliner P. 2001. Mono-window algorithm for retrieving land surface temperature from Landsat TM6 data. Acta Geogr Sin. 56:456–466.
- Qureshi S, Alavipanah SK, Konyushkova M, Mijani N, Fathololomi S, Firozjaei MK, Homaee M, Hamzeh S, Kakroodi AA. 2020. A remotely sensed assessment of surface ecological change over the gomishan wetland, Iran. Remote Sens. 12(18):2989. doi: 10.3390/rs12182989.
- Rahaman ZA, Kafy AA, Saha M, Rahim AA, Almulhim AI, Rahaman SN, Fattah MA, MTSK R, Faisal AA, Al Rakib A. 2022. Assessing the impacts of vegetation cover loss on surface temperature, urban heat island and carbon emission in Penang City, Malaysia. Build Environ. 222:109335. doi: 10.1016/j.buildenv.2022.109335.
- Richardson AJ, CLJP W. 1977. Distinguishing vegetation from soil background information. Photogramm Eng Remote Sens. 43:1541–1552.
- Rikimaru A, Roy PS, Miyatake S. 2002. Tropical forest cover density mapping. Trop Ecol. 43:39–47.
- Saedpanah S, Amanollahi J. 2019. Environmental pollution and geo-ecological risk assessment of the qhorveh mining area in western Iran. Environ Pollut. 253:811–820. doi: 10.1016/j.envpol.2019.07.049.
- Seifollahi-Aghmiuni S, Kalantari Z, Egidi G, Gaburova L, Salvati L. 2022. Urbanisation-driven land degradation and socioeconomic challenges in peri-urban areas: insights from southern Europe. AMBIO. 51(6):1446–1458. doi: 10.1007/s13280-022-01701-7.
- Shan W, Jin XB, Ren J, Wang YC, Xu ZG, Fan YT, Gu ZM, Hong CQ, Lin JH, Zhou YK. 2019. Ecological environment quality assessment based on remote sensing data for land consolidation. J Clean Prod. 239:118126. doi: 10.1016/j.jclepro.2019.118126.
- Shi Z, Hu X, Xie H, Liu X. 2023. Eco-environmental quality assessment and driving force analysis based on rsei: a case study of the minjiang river basin (Fuzhou section). Bull Surv Mapp. 2:28–33.
- Siddique MA, Wang Y, Xu NH, Ullah N, Zeng P. 2021. The spatiotemporal implications of urbanization for urban heat Islands in Beijing: a predictive approach based on CA-Markov modeling (2004-2050). Remote Sens. 13(22):4697. doi: 10.3390/rs13224697.
- Sturbois A, De Caceres M, Bifolchi A, Bioret F, Boyé A, Gauthier O, Grall J, Grémare A, Labrune C, Robert A, et al. 2023. Ecological quality assessment: a framework to report ecosystems quality and their dynamics from reference conditions. Ecosphere. 14(12):e4726.
- Wang H, He N, Zhao R, Ma X. 2020. Soil water content monitoring using joint application of PDI and TVDI drought indices. Remote Sens Lett. 11(5):455–464. doi: 10.1080/2150704X.2020.1730469.
- Wang S, Liu Z, Zhang T, Wei J, Huang F. 2019. The coupling relationship between multi-dimensional urbanization and the service industry: a case study of Guangzhou. Trop Geogr. 39(3):450–460.
- Wang YR, Samset BH, Stordal F, Bryn A, Hessen DO. 2023. Past and future trends of diurnal temperature range and their correlation with vegetation assessed by MODIS and CMIP6. Sci Total Environ. 904:166727. doi: 10.1016/j.scitotenv.2023.166727.
- Wei S XX, Liu LY, Z LL, Wang JH, Chen Y, Chen Y. 2020. Comparative analysis on the evolution of ecological carrying capacity between provinces during urbanization process in China. Ecol Indic. 112:106179. doi: 10.1016/j.ecolind.2020.106179.
- Wu XL, Hu F. 2020. Analysis of ecological carrying capacity using a fuzzy comprehensive evaluation method. Ecol Indic. 113:106243. doi: 10.1016/j.ecolind.2020.106243.
- Xu H. 2008. A new index for delineating built‐up land features in satellite imagery. Int J Remote Sens. 29(14):4269–4276. doi: 10.1080/01431160802039957.
- Xu H. 2010. Analysis of impervious surface and its impact on urban heat environment using the Normalized Difference impervious surface Index (NDISI). Photogramm Eng Remote Sens. 76(5):557–565. doi: 10.14358/PERS.76.5.557.
- Xu HQ. 2013a. A remote sensing urban ecological index and its application. Acta Ecol Sin. 33:7853–7862.
- Xu HQ. 2013b. Spatiotemporal dynamics of the bare soil cover in the hetian basinal area of county changting, China, during the past 35 years. Acta Ecol Sin. 33(10):2946–2953. doi: 10.5846/stxb201204210575.
- Xu HQ, Wang MY, Shi TT, Guan HD, Fang CY, Lin ZL. 2018. Prediction of ecological effects of potential population and impervious surface increases using a remote sensing based ecological index (RSEI). Ecol Indic. 93:730–740. doi: 10.1016/j.ecolind.2018.05.055.
- Xu JH, Zhao Y, Sun CG, Liang HB, Yang J, Zhong KW, Li Y, Liu XL. 2021. Exploring the variation trend of urban expansion, land surface temperature, and ecological quality and their interrelationships in Guangzhou, China, from 1987 to 2019. Remote Sens. 13(5):1019. doi: 10.3390/rs13051019.
- Xu Y, Dai W, Huang W, Huang K, Hu H. 2021. Spatiotemporal evolution and correlation analysis of ecosystem service values and ecological risk in Fuzhou central city. Ecol Sci. 40(4):92–101.
- Yan CD, Dai HJ, Guo W. 2017. Evaluation of ecological environmental quality in a coal mining area by modelling approach. Sus. 9(8):1265. doi: 10.3390/su9081265.
- Yang Q, Jiang C, Ding T. 2023. Impacts of extreme-high-temperature events on vegetation in North China. Remote Sens. 15(18):4542. doi: 10.3390/rs15184542.
- Yang WP, Li D. 2022. Spatio-temporal evolution of ecological environment quality in China from a concept of strong sustainability. Environ Sci Pollut R. 29(19):28769–28787. doi: 10.1007/s11356-021-17156-4.
- Yang X, Meng F, Fu P, Wang Y, Liu Y. 2022. Time-frequency optimization of RSEI: a case study of Yangtze river basin. Ecol Indic. 141:109080. doi: 10.1016/j.ecolind.2022.109080.
- Yin CH, Yuan M, Lu YP, Huang YP, Liu YF. 2018. Effects of urban form on the urban heat island effect based on spatial regression model. Sci Total Environ. 634:696–704. doi: 10.1016/j.scitotenv.2018.03.350.
- Yue H, Liu Y, Li Y, Lu Y. 2019. Eco-environmental quality assessment in China’s 35 major cities based on remote sensing ecological index. IEEE Access. 7:51295–51311. doi: 10.1109/ACCESS.2019.2911627.
- Yue H, Liu Y, Qian JX. 2021. Comparative assessment of drought monitoring index susceptibility using geospatial techniques. Environ Sci Pollut R. 28(29):38880–38900. doi: 10.1007/s11356-021-13275-0.
- Zhan Z, Qin Q, Ghulam A. 2006. A new method of soil moisture monitoring based on NIR-RED spectral space. Sci China Ser D Earth Sci. 36:1020–1026.
- Zhang H, Ning X, Wang H, Shao Z. 2018. High accuracy urban expansion monitoring and analysis of china’s provincial capitals from 2000 to 2015 based on high-resolution remote sensing imagery. Acta Geo Sin. 73(12):2345–2363.
- Zhou DC, Xiao JF, Bonafoni S, Berger C, Deilami K, Zhou YY, Frolking S, Yao R, Qiao Z, Sobrino JA. 2019. Satellite remote sensing of surface urban heat islands: progress, challenges, and perspectives. Remote Sens. 11(1):48. doi: 10.3390/rs11010048.
- Zhou L. 2022. Assessment of ecological environment quality for urban sustainable development based on AHP. Comput Intel Neurosc. 4056713. doi: 10.1155/2022/4056713.
- Zhou Z, Wang X, Ding Z, Chen Y, Wang C. 2020. Remote sensing analysis of ecological quality change in Xinjiang. 生态学报. 40(9):2907–2919. doi: 10.5846/stxb201904280871.
- Zhu Q. 2022. Retraction notice to “construction of ecological environment landscape evaluation system of small towns along the huaihe river area based on fuzzy cloud model. Sustain. Comput Inform Syst. 35:100772. doi: 10.1016/j.suscom.2022.100772.
- Zhu XM, Wang XH, Yan DJ, Liu Z, Zhou YF. 2019. Analysis of remotely-sensed ecological indexes’ influence on urban thermal environment dynamic using an integrated ecological index: a case study of Xi’an, China. Int J Remote Sens. 40(9):3421–3447. doi: 10.1080/01431161.2018.1547448.
- Zormand S, Jafari R, Koupaei SS. 2017. Assessment of PDI, MPDI and TVDI drought indices derived from MODIS aqua/terra level 1B data in natural lands. Nat Hazards. 86(2):757–777. doi: 10.1007/s11069-016-2715-0.