
Abstract
Low levels of concern about anthropogenic climate change have been attributed to a range of factors, some of which relate to education. These include people’s lack of understanding and engagement with the multifaceted nature and extent of the problem that it presents to current and future generations. Limited knowledge is also known to be an obstacle to individual behaviour change, with important implications for young people’s perceptions of the urgency to act and awareness of the consequences of their own behaviours. In this study, we explored ways to address low levels of understanding about ocean science dimensions to climate change phenomena, cognisant of a growing awareness that formal education curricula do not adequately engage young people with developing ocean literacy. Participants were a sample of secondary school students (11 to 14 years) in Portugal and the UK. Using a gamified mobile application, it was examined relationships between the use of different game elements such as points, badges and leaderboards, and learning outcomes. Systematic evaluation of each element shows how different game features affected the participants’ learning experience and learning outcomes. Implications for formal and informal marine education, climate education, and how to improve ocean literacy efforts, are also discussed.
Introduction
There is an increasing emphasis on environmental education. The interest in marine education has roots in the environmental movement of consciousness since the 1960s (Marrero and Mensah Citation2010; Charlier and Charlier Citation1971), as an answer to the new conditions of industrialism: “a process which involves, crucially, internalising the notion of limits” (Foster Citation2001, p. 156). One of the major consequences of this lacking notion of limits affects the ocean. A common denominator of all the issues that have a detrimental effect on the ocean and on climate change is the waste we produce. A “crusade against climate change science stands as a defence of consumption: it stands for our right to consume” (Falasca-Zamponi Citation2010, p. 3), and waste is a consequence of consumption.
In the last two decades, there has been a growing acknowledgement of the ocean’s vital importance for the well-being of the planet and the current problems threatening its health, such as climate change, evidenced by many news articles and headlines (O’Donnell and Thorne Citation2020; Boudet et al. Citation2020; Cowburn, Samoilys, and Obura Citation2018; McGrath Citation2018; Trenberth et al. Citation2018). Despite its intrinsic and extrinsic values, the ocean is now presenting significant signs of change as a consequence of human activities (Winks et al. Citation2020; Guest, Lotze, and Wallace Citation2015).
The grassroots for Ocean Literacy started in 2002 (Costa et al. Citation2020; Santoro et al. Citation2017). Integrated into the educational practice, it is believed that better public understanding of the ocean plays an important part in resolving complex critical issues like decades of pollution, habitat degradation, overfishing, and now climate change and ocean acidification (Ocean Literacy Network, 2013; Cava et al. Citation2005). An ocean literate person understands the ocean’s influence on us and our influence on the ocean (Ocean Literacy Network, 2013).
Presently, the protection of the ocean has become one of the most urgent issues in the world environmental agenda. Several studies on marine education and related topics have been addressed by numerous surveys carried out among students (Lin et al. Citation2020; Tsai Citation2019; Guest, Lotze, and Wallace Citation2015; Plankis and Marrero Citation2012) and teachers (Hartley et al. Citation2018; Dromgool-Regan, Burke, and McClouglin Citation2017). The literature has revealed a knowledge gap about ocean science-related topics in several countries (Winks et al. Citation2020; Ankamah-Yeboah et al. Citation2020; Fauville et al. Citation2019; Leitão et al. Citation2018; Costa and Caldeira Citation2018; Papathanassiou et al. Citation2017; Guest, Lotze, and Wallace Citation2015; Corner, Capstick, and Pidgeon Citation2014). Yet many people are not aware of the impact of the ocean on their lives (Pantò Citation2019; Frick, Kaiser, and Wilson Citation2004) and there is little understanding of marine environmental issues and protection (Fauville et al. Citation2019). The literature also shows that ocean topics are largely missing from national school curricula in Portugal (Costa et al. Citation2020; Barracosa et al. Citation2019) and the UK (Winks et al. Citation2020).
The Essential Principles and fundamental concepts of Ocean Sciences can be addressed in the different science subjects of the Portuguese and UK curricula education systems (National Curriculum in England: Science Programmes of Study Citation2015;Ciências Naturais. Documentos curriculares de referência Citation2018). Although there are overlaps in science and geography about the climate and environmental issues, in the national curricula in both countries, there are no explicit standards focusing on the ocean and related maritime topics at Key Stage 3, 7th to 9th grades (aged 11-14 years). The lack of these scientific concepts prevents people from making conscious personal and societal decisions about environmental issues (Goodale Citation2020; Marrero and Mensah Citation2010). Furthermore, an ocean literate person not only holds an understanding of the ocean but is also able to make informed and responsible decisions regarding the ocean and its resources. Therefore, engaging learners in experiences related to the ocean could not only improve their literacy but also motivate them to act for the ocean’s well-being United States Commission on Ocean Policy Citation2004; Daigle Citation2003).
Education plays a crucial role in improving ocean literacy, ensuring critical thinking, citizenship skills and democratic attitudes and values (Mercer et al. Citation2017; Cotton and Winter Citation2010). According to Mercer et al. (Citation2017) to reach effective education in order to influence sustainable behaviour requires the inclusion of more interactive methods, supporting a move towards more practical and learner-centred approaches. Environmental protection and sustainable development lie with a public that is not only informed but also engaged (Daigle Citation2003) and therefore, more suitable pedagogies based on more interactive approaches are needed (Mercer et al. Citation2017). Visbeck (Citation2018) stressed that more engagement at secondary school levels to promote ocean literacy was urgently needed. Interactive learning experiences, including multimedia platforms, have been shown to improve active student learning and affect the learning process positively (Cherner, Wu, and Fegely Citation2019; Haßler, Major, and Hennessy Citation2016). The motivating and immersive nature of educational games, with actions, challenges, rewards, and the central layer called ‘fun’, have enhanced the use and interest in them (Cheng Citation2017; Dicheva et al. Citation2015).
Games have been used to change behaviour and attitudes, improve learning and motivation outcomes in the areas of health, public policy as well as education, training, environmental behaviour and ocean literacy (Veronica and Calvano Citation2020; Pantò Citation2019; Kelley et al. Citation2017; Huynh, Zuo, and Iida Citation2016; Rebolledo-Mendez et al. Citation2009; Dieleman and Huisingh Citation2006). They can promote a better acquisition of knowledge through exploration, action and experimentation (Prensky Citation2001). This has motivated their application beyond entertainment. One of the widely adopted strategies in this area is gamification. Most scholarly sources agree that gamification is generally defined as including game elements in non-game contexts to improve the user experience and motivation (Dicheva et al. Citation2015; Werbach and Hunter Citation2012; Deterding et al. Citation2011a). The most common strategy used for designing gamified experiences is to use ‘game elements’. In the growing number of educational systems that incorporate game elements to improve the learning experience, points, badges, and leaderboards are some of the most commonly used (Warmelink et al. Citation2020; Kirillov et al. Citation2018; Dicheva, Irwin, and Dichev Citation2018b; Werbach and Hunter Citation2012; Zichermann and Cunningham Citation2011). For this reason, a gamification approach was chosen for this study due to its engaging and motivating features, which could enhance the learning experience (Dicheva, Dichev, and Irwin Citation2018a; Çakıroğlu et al. Citation2017; Werbach and Hunter Citation2012), assist the cognitive domain of learning (Kapp Citation2012) and, consequently, improve the learning outcomes. Through the experience with a gamified application, pupils can learn by doing and by failing, without negative consequences, which is often absent in traditional classroom approaches. When consequences of actions are negative, one learns what not to do and plan alternative strategies and goals (Dieleman and Huisingh Citation2006). Therefore, students can play, manipulate, experiment and experience what the consequences are or what they might be (Dieleman and Huisingh Citation2006; Prensky Citation2001).
Within this context, gamified applications can create new opportunities and challenges inside the education context. Although teachers are core agents of implementing these technologies in classrooms, it is also essential to address factors that could benefit or obstruct their use: school factors (e.g. availability and support of technologies, professional development), student factors (class sizes and student skills) and teacher factors (attitudes, beliefs and teaching experience) (Drossel, Eickelmann, and Gerick Citation2017). A further requirement is a need for information and communication technologies (ICTs) integration into curriculum providing reasonable goals, content and methods and, at a higher level, the management of the ICT innovation of a school, district, state and national level. The integration of ICT in the classroom is directly related to teaching practices and methods that the teacher wants to apply. Teachers are viewed as both subjects and agents of change and, at this integration level, marine science concepts also face influences in the curricular adoption (Goodale Citation2020).
Research by Mercer et al. (Citation2017) shows much criticism of the secondary school system for not providing robust education on topics related to climate change and sustainability. The reasons pointed to are that teachers do not feel prepared to teach these topics and “can find the prospect both daunting and challenging due to the subject complexity and perceived controversial nature of the topic as well as its interdisciplinary nature” (Mercer et al. Citation2017, p. 360). Furthermore, Gotensparre et al. (Citation2017) identified several barriers to ocean literacy when teaching 12-19-year-olds about the ocean in Portugal and the UK. The authors highlight an inability to recognise the importance and value of teaching students about the ocean in the UK. This aggravates other present barriers such as lack of confidence when taking students out of the classroom (regarding health and safety, logistics), competition and lack of clarity/coordination between providers. The Portuguese education system displays barriers of lack of interest from the ministry of education to implement ocean literacy in the national curriculum, lack of a national strategic plan to implement ocean literacy and, lack of obvious connections with the school curricula (Barracosa et al. Citation2019).
Several resources are available to promote the integration between the education system and the environment. A platform called Digital explorer (Digital Explorer Citation2018) offers immersive learning experiences related to the ocean to provide the students with the necessary understanding and skillsets to tackle the world’s most pressing issues. People and Planet and Sustainability Exchange (People and Planet Citation2019; EAUC Citation2019) are two projects that incorporated Green leaderboards and Green Gown awards to increase participation and interest from educational institutions in sustainability. The Sea Change project aimed to empower ocean literate citizens to take direct and sustainable action towards a healthy ocean, communities and consequently the planet. The project targeted its intervention at three main societal groups: the general public, formal educators, and policymakers. In the UK, the main focus was developing resources for educators and students to introduce ocean literacy topics into curricula (Winks et al. Citation2020). The ResponSEAble project aimed to raise awareness about the ocean reciprocal influence between humans and the sea. This project developed several communication tools to address the identified ocean literacy gap in the European population. A mobile application was designed and made available online based on the assumption that games can effectively change behaviours (Pantò Citation2019).
As a growing number of education systems are incorporating game elements to improve the learning experience, this raises the research question: can different game elements impact the learning outcomes and, if so, how? Therefore, this study was conducted to understand if there is any relationship between different game elements, such as points, badges, leaderboards (also known as the PBL triad), and learning outcomes of ocean literacy.
Method
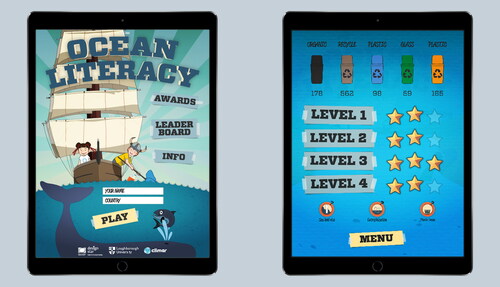
Through a participatory design approach, a gamified Ocean Literacy mobile application was developed combining the findings from previous studies: platforms and skills (Leitão, Turner, and Maguire Citation2017), learning outcomes (Leitão et al. Citation2018), learner-centred (Leitão, Maguire, and Turner Citation2019b), and game effects on different levels of motivation (Leitão, Turner, and Maguire Citation2019c). The research tool application consisted of a recycling game where the player recycles items falling from the top of the screen into the appropriate recycling bin. On the lower part of the screen, water was shown flowing with healthy fish in it. Failing to throw an item into the correct bin resulted in the water becoming darker, the fish dying, at which point the game ends. To conduct a systematic evaluation, four versions of the application were used to be able to understand the effect of the different game elements on the students’ acquired knowledge about ocean topics. Three versions used of the techniques: points, badges and a leaderboard to give success feedback while the fourth used all three techniques.
The study adopted a mixed methods approach which involved user testing of the app with observation. As well as playing the game, a multiple-choice test was employed for data collection and asking for pupils’ comments concerning their learning experience. The questionnaire was developed based on the topics: eutrophication, sea-level rise and plastic pollution in the ocean (the intended learning outcomes).
The survey was carried out to school children within the age group 11-14 years, corresponding to 7th to 9th grades (Portugal) and Key stage three (KS3), i.e. the first three years of secondary school in the UK. The sample consisted of students from a local comprehensive secondary school in the UK (East Midlands) and secondary school students attending classes during a holiday science programme at the Junior University Summer School, Porto University. A total of 69 students participated in the study in Portugal, and 29 students in the UK, randomly selected. The data were collected in July 2019 in both countries.
The sessions were administered in five different classes, each one with a different condition (see ). Normally, the gamified application would be used as a support tool to complement traditional teaching and not be solely used as a learning tool. Therefore, initially, in all the sessions, a class presentation was given on the three ocean literacy topics, with PowerPoint slides as support. This initial 15-minutes presentation, as well as the design of the slideshow, in both countries, were made by experienced science educators. There were five different session conditions: (1) presentation with game (points), (2) presentation with game (badges), (3) presentation with game (leaderboard), (4) presentation with game (all game elements), (5) presentation only. For each of the sessions, pupils were observed by two researchers who recorded behaviour cues and took notes of indicators of engagement, such as comments or positive body language, as well as signs of lack of enjoyment and frustration. Pupils’ behavioural cues may be more reliable than their responses to direct questions about whether they liked something (Hanna, Risden, and Alexander Citation1997). The questionnaires were anonymous, and permission was obtained from students and parents regarding participation in the study to comply with the research ethics requirements in both countries. In the UK, ethical approval was obtained through the Loughborough University Ethics Committee for research with human participants. In Portugal, ethical approval was obtained from the Ministry of Education with the registration number 0582600003.
Table 1. Session planning.
As pupils progressed through the game, potentially being motivated by particular game elements, they were shown more information about the ocean, which increased their knowledge. At the end of each session, to evaluate the learning gained during the five sessions, participants answered a series six of multiple-choice questions concerning ocean literacy (). The questionnaire was developed in cooperation with the Interdisciplinary Centre of Marine and Environmental Research (CIIMAR, University of Porto) (correct answers are shown in boldface):
Table 2. Ocean literacy answers obtained for Points as a game element. Over 80% of correct answers are in bold font, and less than 20% are in red.
What is eutrophication? (An ocean current that runs along the Atlantic Ocean; The process of formation of calcareous structures of shells; An ecological process caused by excess nutrients in a mass of water; A molecular process associated to photosynthesis; Don’t know);
The nutrients that originate eutrophication come from… (Industrial waste; Industrial waste and agriculture run-off; Urban and industrial waste; Agriculture run-off, industrial and urban waste; Don’t know);
Among the causes that most contribute to the rising sea level are: (River currents caused by heavy rainfall; The movement and rotation of the Earth; Large discharges of water that we make in our homes; Melting of glaciers and of the Antarctic and Greenland ice sheets; Don’t know);
One of the major sources of greenhouse gas emissions and consequently the rising sea level is: (Methane emissions generated by the decomposition of paper in landfills; Oxygen emissions produced by plants through photosynthesis; Emissions of carbon dioxide from human breathing; Methane emissions generated by the decomposition of algae in the seas; Don’t know);
Where does the plastic that contaminates the ocean come from? (From the waste that we put in the wrong bins and therefore is not recycled; From the garbage that is left on the street and that is carried by wind and rain; From the plastics that, because they are so lightweight, fly from the landfills where they are unduly deposited; All previous options; Don’t know);
According to a United Nations report, what is the percentage of fish that is currently contaminated by plastic? (5%, 10%, 20%, 30%, Don’t know)
A model I factorial (orthogonal) analysis of variance (ANOVA) was carried out to investigate differences in the pupils’ learning scores elicited by the various game elements tested, in relation to the country of origin. For this, we calculated the overall score of each student in the learning assessment questionnaire: the number of questions answered correctly divided by the total number of questions in the questionnaire, i.e. six. This score was entered as the dependent variable in the model I factorial ANOVA. The independent variables, i.e. main factors entered in the analysis, were the country (with two categories; UK and PT) and the session (with five categories, i.e. four game element sessions and the classical oral explanation). The variance homogeneity and normality of the dependent variable were checked using the Levene’s test and the Shapiro-Wilk test, respectively. To fulfil the normality assumption, the dependent variable was transformed using the arcsine square root transformation, indicated for proportion variables. The Dunnett test was used in the post-hoc analysis of the test session main factor, to compare the scores in each game element category (Points, Badges, Leaderboard and the PBL triad) against the traditional teaching session, which was taken as the control category. The significance level was set at 0.05. All analyses were carried out with the Statistical Package for the Social Sciences (SPSS v27).
Results
The findings are first presented separately for the different game elements (i.e. Points, Badges, Leaderboard, PBL triad) and the control group, and then analysed globally in a two-way ANOVA design.
Session 1. Game element: Points
Throughout the observation of the tests during all the sessions, it was noticeable that the students did not need help to start interacting with the app and that they quickly learnt how to use it. The multiple-choice test findings (see ) showed that UK pupils had more difficulty with the questions related to the origin of nutrients causing eutrophication, the eutrophication process and the greenhouse gas emissions, with only 16.6% and 50.0% of correct answers, respectively (). The questions with the highest percentage of correct responses were related to the sea-level rise (100%) and fish contaminated by plastic (>80%). The Portuguese students showed more difficulty with the questions related to greenhouse gas emissions and the percentage of fish contaminated by plastic, with around half of the correct answers. Almost all the students answered correctly the questions related to sea-level rise, the origin of ocean plastic contamination and eutrophication.
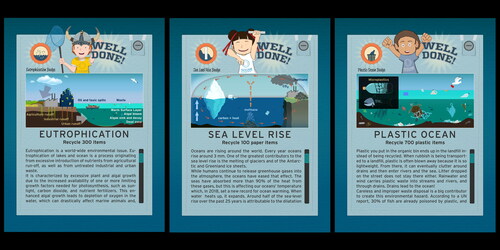
In both countries, students reached the screen where the points obtained were the awards displayed, and through this option explored the screens corresponding to the topics of eutrophication, ocean level rise, and plastic ocean (). It was observed that students from both countries were curious to read all or most of the information. Some participants made some comments regarding their learning experience: ‘It teaches you how to recycle’; It tells you what goes to the bin’[United Kingdom pupils]; ‘Who doesn’t know can learn about recycling’[Portuguese student]. Pupils showed enjoyment during the experience: ‘Throwing the trash was fun’[PT student] and also regarding the challenge: ‘I liked the different levels and how it got harder’[UK student].
Figure 1. Ocean Literacy application (Leitão, Maguire, and Turner Citation2019a).
Session 2. Game element: Badges
The findings exposed more difficulty among the UK students in the questions related to greenhouse gas emissions and eutrophication (). The questions about the sea level rise and the origin of plastic in the ocean had the highest percentages of correct answers. Most of the Portuguese students answered all the questions correctly, with the lowest rate of correct answers over 60%. They had the highest percentage of correct answers about ocean plastic contamination.
Table 3. Ocean literacy answers obtained for Badges as a game element. Legend as in .
Every time they reached a different badge, students in both countries read the information about the ocean topics that appeared on the screen ‘congratulations’. In this way, the information came to them not only through the exploration of the different screens where it was made available - the awards screen () but also through this game element. This could be the reason why the learning results were so high in this session. Even when children did not reach the screens with this information, that content popped up to them.
Figure 2. Ocean literacy application screens.
At the end of the application experience, the students stated they understood the educational content well and learned from the interaction with the application: ‘Learned not to leave plastic lying around’; ‘Good and easy to understand’[UK students]; ‘Good way to learn about the topic’[PT student]. Some pupils also made comments about background sounds and the game graphics: ‘Different levels should have different songs’; It should have more levels and more themes’[PT students]. Although one pupil stated ‘Levels are a bit repetitive’[PT student], most of them demonstrated enjoyment and considered they had learnt while interacting with the application. Concluding, the use of badges as the main game element, with the reinforcement of the topic contents, appeared to have a good effect on the learning outcomes.
Session 3. Game element: Leaderboard
When pupils became aware that the leaderboard was the central game element, it was possible to observe some arousal in their behaviour. From all the sessions, this was the one in which the students showed the most excitement. Nevertheless, compared with the other groups, they obtained the worst results regarding the learning outcomes. The UK students revealed more difficulties regarding the questions about the origin of nutrients and ocean plastic, both with less than 20% of correct answers. The highest percentage of correct answers was related to the plastic contamination in fish. Portuguese students had the highest percentage of correct answers to the questions about sea-level rise and plastic contamination in fish. Their lowest percentage of correct answers was 50% ().
Table 4. Ocean literacy answers for Leaderboard. Legend as in .
In this session, students were more animated and interacted well. Both verbal and corporal behaviours were much more active but more focused on the others’ results.
Students did not comment on the learning but the experience. ‘Very, very fun. I would like to be able to go in at any level’; ‘Fun. I would like more levels’[UK students]. ‘Good’ was the most commented among the UK students. The experience among the Portuguese pupils was very similar. ‘What I liked most was when I could hit the right bin’[PT students] was a common statement among Portuguese children. ‘It was addictive’[PT student]. Although most of the pupils reported that the application appeared to be very good in terms of a learning tool, when asked what they liked most about the game, they made no reference to this topic, unlike in the other sessions. In sum, what students enjoyed most was getting a high place on the leaderboard.
Session 4. All three elements: PBL triad
In Session four, students interacted with the full application and demonstrated enjoyment during the experience. Most of the students in both countries explored the ocean topics screens, expressed interest in them and demonstrated to be reading the information related to the ocean topics. The UK students showed lower and highest knowledge levels in the questions related to the origin of nutrients in eutrophication (<20% correct answers) and plastic contamination in fish (>80%) (). The vast majority of Portuguese students answered the questions correctly.
Table 5. Ocean literacy answers for the PBL triad. Legend as in .
As a learning tool, most students rated it as very good in both countries. They felt they had learnt new recycling information and consequently the effects on the ocean: ‘Very interesting to understand why the environment is being harmed’; ‘Useful recycling information’; ‘A more fun way to learn’[PT students]; ‘Tests your mind power’[UK student]. Additionally, they commented also on the application experience: ‘I liked the sliding action to recycle’; ‘Fun. I wanted to keep going’; ‘Quite good. I liked the shooting items into the bins’[UK students].
In the UK sample, one of the playing platforms sounded relatively higher than the others. Whenever the student with this tablet missed a bin, the consequent negative feedback sound was noticeable to all classmates. This sound provoked a strange reaction in the student, who always responded with discomfort. While negative feedback could enable the user to learn quickly and adjust, in this circumstance, it provoked a loss in the interaction with the system. Although among the UK students, the learning outcomes were not so high as among the Portuguese students, the overall experience showed wide acceptance and enjoyment by children in both countries.
Session 5. Oral explanations: Control group
This fifth session worked as a control group with only the constant condition: presentation on the ocean literacy topics plus slideshow presentation as teaching support (see ). Consequently, students did not interact with the application. In both groups learning take-up was reduced seemingly due to lack of interaction with the application. In the UK, only 20% of the students answered the question about the origin of nutrients correctly, and none answered correctly the questions about the greenhouse gas emissions and ocean plastic (). Although the total of Portuguese students performed very well in the eutrophication and sea-level rise questions and less well in questions about the nutrients origin, greenhouse gas emissions and ocean plastic. In both countries, engagement decreased as well as students’ participation in the session. It was not possible to observe the enthusiasm of the previous sections conducted with the Ocean Literacy application.
Table 6. Ocean literacy answers given after the oral explanations. Legend as in .
Overall results
The statistical analysis of the data by factorial ANOVA, using the pupils’ overall score in the knowledge test as a dependent variable, revealed significant differences between the two countries and among the game elements tested (). Interestingly, no statistical significance of the interaction term was found, indicating a similar response to the different game elements from pupils of both countries (). The PT pupils scored significantly higher (∼62%) in the test than those from the UK (p < 0.001, ), as suggested by the descriptive analysis. Because the PT control group also showed higher classification scores than the UK one, this suggests that Portuguese pupils were generally more knowledgeable about the topics under analysis than their UK counterparts. As to the game elements, the post-hoc analysis by the Dunnett test revealed that Points, Badges and the PBL triad all increased the learning outcome significantly by about 30%, compared to the control group (p < 0.05, ).
Figure 3. Scores obtained by the 98 pupils in the assessment questionnaire passed after the five testing sessions. Scores are presented according to the results of the model I factorial ANOVA carried out to investigated possible knowledge differences elicited by the game elements, i.e. by significant main factor: country (left) and test session (right). For the test session, the classical teaching session was taken as the control category against which the scores in each game element category (Points, Badges, Leaderboard and the PBL triad) were compared. ** indicates significant differences at p < 0.001; * indicates significant differences at p < 0.05 relative to the control, according to the results of the post-hoc Dunnett test.
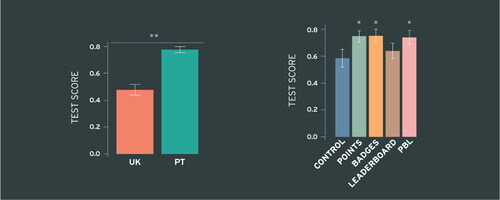
Table 7. Results of the model I factorial (orthogonal) ANOVA carried out to investigate differences in the pupils’ learning scores obtained in the knowledge test (dependent variable) elicited by the various game elements tested in relation to the country of origin.
In contrast, no statistically significant differences were found between the leaderboard and the control groups (). Altogether, the findings indicate the leaderboard was fun for the pupils but not useful to improve the learning outcomes, compared to the other three elements that were both fun and efficient in improving pupils’ knowledge. The competitive effect as a central role in the application was thus shown to have a negative effect on the learning outcomes.
Discussion
Gamification is commonly described as the use of game elements and game design techniques in non-playing contexts, that is, in situations whose objective goes beyond merely winning the game (Deterding et al. Citation2011a). This approach has been applied to several fields to improve the user experience, motivation and engagement (Warmelink et al. Citation2020; Dichev et al. Citation2015; Werbach and Hunter Citation2012; Deterding et al. Citation2011b, Citation2011a). The most common strategy used for designing gamified experiences is to use game elements. In the growing number of educational systems that are incorporating game elements to improve the learning experience, points, badges, and leaderboards are some of the most commonly used (Warmelink et al. Citation2020; Kirillov et al. Citation2018; Dicheva, Irwin, and Dichev Citation2018b; Werbach and Hunter Citation2012; Zichermann and Cunningham Citation2011). The junction of these three elements is known as the PBL triad, and the extensive focus on these elements has given rise to a large part of the criticisms of gamified applications. The perspective of merely adding different game elements to an application without understanding the meaning behind them has raised a lot of criticism. Several authors have stressed that a gamified application is more than just points, badges and leaderboards (Kornevs, Baalsrud Hauge, and Meijer Citation2019; Liu, Santhanam, and Webster Citation2017; Chou Citation2016; Werbach and Hunter Citation2012). “The least exciting element of any game is the points, badges or leaderboards. People don’t play a game just for points, they play for mastery, to overcome challenges and to socialise with others. The most effective gamification efforts include more than points and badges — they contain elements of a story, challenge and continual feedback as well as a high level of interactivity” (Kapp Citation2012, p. 46).
The underlying features of the interaction process within the application, such as the sensation of progression or completion, challenge, the aesthetic experience, the sounds and the tangible interactions, can transmit fun emotions. These features called ‘playability’ can enable enjoyable experiences, which are fundamental to the creation of intrinsically motivating learning environments. However, it is crucial to have a balanced association between learning content and enjoyment for a gamified app to be appealing and effective in learning and not purely fun.
Learning to use the application
Students did not need to learn about the gamified application before the sessions were held. They understood the rules of the application and knew how to use it without being instructed. At the first level, brief instructions on the very basic rules of the application were given, and with this knowledge, students started playing and learnt more about it. Therefore, the technology integration level regarding the necessary skills of students and teachers to use the application seems to be present, showing that the results that are aligned with the previous study findings (Leitão, Turner, and Maguire Citation2017). Moreover, the further requirement of an ICT integration in order to support technologies such as educational tutorials explaining how to use the software could be much more simplified through a gamified approach.
Unlike other software that often needs the user to learn about it before use, in games, a user usually goes directly into the software. When they are confronted with a new item, they need to learn to adapt it with their existing schema by trial and error or mental reflection. Following this, students learnt by making mistakes (e.g. in this game, in bin selection) and by exploring directly during the application experience. This enhancement of the user experience through the constant and instant feedback from user actions to inform him/her about the steps that need to be performed could turn these apps into useful educational tools.
Effect of different game elements
The purpose of the study was to understand if different game elements (PBL triad) could affect the learning outcomes differently. Findings show that the inclusion of the game-like application with different game elements seems to influence the learning outcomes positively. At least, as far as the overall results are concerned, there appears to exist a close correspondence between the different game elements and the learning outcomes.
The learning benefits in the use of points, badges and the PBL triad seems to be consistent among the two countries. It is essential to highlight that badges can be used as different motivational stimuli according to different rewards. Type of rewards can go from extrinsic motivators, such as monetary or status rewards, towards intrinsic motivators. A previous study showed that games have a greater effect on intrinsic motivation than on extrinsic motivation (Leitão, Turner, and Maguire Citation2019c). However, the prototype version with the leaderboard as the main game element was shown to have a substantial effect on the least autonomous motivation level (external regulation). In the recycling context, this could represent only recycling to satisfy an external demand or to receive some reward (Leitão et al. Citation2021). Given this, badges were not used as a contingent reward but rather as a tool for raising the awareness of some of the environmental problems we face and how they arise. In summary, at least under these conditions in both countries, the use of points, badges and the PBL triad seemed to improve the learning outcomes.
Implications of the leaderboard
Despite the innate human desire to learn, overcome obstacles, improve ourselves and win, which can be achieved through fun and engaging tasks, the willingness to win in direct competition with participants can undermine learning outcomes. The comparison between different performances made the pupils not concentrate on their own learning development. The concern with staying ahead of colleagues did not allow them time to read the information about the ocean, nor did it allow them to explore the application and all its features. Therefore, this could have influenced the decrease in the learning outcomes results since students did not pay much attention to the information contained in the app and did not read it. The leaderboard as the main element of the game provoked competition among the students, which seemed to be the main reason that led to the decrease in learning outcomes. However, results presented an increase of 5% of correct answers compared with the session with no game elements.
These findings are aligned with the literature, which reported that competition came to the forefront as a negative element (Çakıroğlu et al. Citation2017; Ibáñez & Delgado-kloos, 2014). This study revealed that the students’ focus was so strong on their competition that it did not allow them to value the experience and context of the game. They were seen to skip or quickly passed the learning text to see their rank on the leaderboard. Thus, when questioned on the educational content, they showed a greater lack of knowledge about the topics and performed worse in answering the questions. Since the leaderboard is one of the most widely used game element among the gamification approaches, it is essential to stress that the use of this game design element in the learning context could provoke a negative effect on the students’ learning process and, thus, a decrease in the attainment of the intended learning outcomes. Nevertheless, Lister (Citation2015) suggests that, due to the immediate feedback provided by these game elements and the possibility to improve their place, the leaderboard can be very motivating for competitive students while less competitive students can demotivate and decrease their performance.
As the game gets used more and more and certain players accumulate many points, it will become harder for new players to get onto the leaderboard. One way to minimise the stress could be to show the player’s name, position and the best score on the board along with the leaders. They can then measure their improvement and see how far they are behind the leaders.
Differences between UK and Portugal results
The PBL triad in the UK shows almost the same effect on the learning outcomes as the leaderboard element. But, on the contrary, this did not happen in the case of the Portuguese students, who obtained the best results. These findings may have been caused by contamination of the leaderboard, since it was also included in this prototype, while among the Portuguese students, it may have gone unnoticed. A possible reason for this effect may be the negative feedback sound of having failed. The sound was too loud on some platforms in the UK, and everyone in the classroom knew when another student failed, creating anxiety in some students. This could have undermined the learning experience and, consequently, the learning outcomes. The UK group was smaller than in Portugal, so this could have created an extra pressure for students; the Portuguese students were a bigger group, and the leaderboard went unnoticed. Another possible reason for this decrease in learning outcomes among the UK students may be that these latter are more vulnerable to this game element than the Portuguese students. Moreover, according to the flow theory (Csikszentmihalyi Citation2014), anxiety or boredom seem to influence the learning process. More studies are needed, as well as a larger sample, to understand this effect on the results better. However, when looking at the results individually, the PBL triad effect was higher in the UK than in Portugal. The main difference between both countries is not high regarding the effect but regarding the intensity of it. Although the Portuguese students presented higher learning outcomes, it seems like that the effect of the mobile gamified application was stronger among the UK students.
Are the game elements useful in learning?
According to Bogost (Citation2015), even though most of the gamified applications follow patterns of feedback loops and rewards mechanisms to improve the most desired experiences, these systems pay no attention to what makes games powerful and reduce them to meaningless points, levels, and badges. To respond to this point, these game elements were used in a narrative context and also over a game mechanic that a previous study showed to be engaging for the children (Leitão, Maguire, and Turner Citation2019b). These elements could explain the improvement of the learning outcomes results with the support of the Ocean Literacy application.
Looking at the overall results, the Ocean literacy mobile application integration as a learning resource seemed to improve the acquisition of knowledge, compared with the oral explanations group. The overall results show the average of correct answers was over 70% with the mobile application (all conditions), while only with oral explanation and the slide show sessions, the average was less than 60%. These overall results show that knowledge acquisition through exploration, action and experimentation is more engaging and learning is more effective.
Future research
This research project included pupils 11-14 years old, so some results may not apply to younger children or older teenagers, although the general guidelines on educational games design on fun and playability are likely to be relevant. Research projects which include empirical evaluation in different grades could help to present a broader picture of the use of these technologies in the learning context. Further research is necessary to understand whether gamified applications have different effects on pupils in different grades.
Schools are not the only places where learning occurs, especially in the case of mobile learning applications. Learning takes place in many different contexts, including in terms of flexibility of time and location. Research is needed on how gamified applications can affect learning in contexts involving, for example, after-school programs, homework or outside of educational activities.
Although people’s poor understanding of marine science and ocean issues is identified as an obstacle to personal behaviour changes, behaviour outcomes were not investigated. Future research could be conducted to investigate whether this knowledge and awareness of the consequences of our behaviours can translate into urgency to act and support public policies.
Study limitations
Some limitations of the study should be addressed. The sample was rather small, and there is a risk of participant variables (individual differences between participants) affecting the results between conditions. Additionally, even though two almost equal-sized gender groups participated in the study, the size group in the UK was smaller and could explain some of the differences between the two countries. The study evaluated the effect of different game elements on ocean literacy outcomes. With this sample, it was not possible to find evidence to argue that the use of badges, points or the PBL triad is more effective than any others. Thus, further studies should be carried out with a larger sample to understand better if there are differences in its application or if gamification results from an overall experience with the system.
Due to the restricted availability of the schools to take part in the study, the pupils’ knowledge was not evaluated before they interacted with the research tool. Therefore, it is not possible to identify if the pupils’ ocean knowledge happened during the sessions or not. The differences in students’ prior knowledge may have led to the differences in the answers. To reduce this limitation, a control group session was included, which showed the results without using the game. Additionally, although a random selection of students was made, the selected sample came from a local secondary school in the UK (East Midlands), while in Portugal, the sample was made up of secondary school pupils attending classes at Junior University Summer School, Porto University. The Portuguese sample may have a more substantial science background than the UK students due to their academic aspirations, economic resources, and their closer geographical location to the sea. The metropolitan Porto area has a strong connection to the coastal area, extending through various economic and social activities, which may make students more aware of the ocean and its importance. Given the results described herein and the interest of the app to improve ocean knowledge, additional studies carried out with a larger, more heterogeneous and representative sample, will be helpful to better understand the differences in learning outcomes exhibited by UK and PT pupils.
Lastly, the sound was too loud on some platforms creating anxiety in some students. Therefore, some attention must be paid to the sound volume of the platforms, particularly in small groups, in order to reduce the pressure among the students. The solution in the future would be to place the sound volume under the pupils’ control so they could turn it down or off if they wished.
Conclusion
Considering the introduction of different game elements in the educational context, creating a rich gamified experience is much more than merely adding various game elements to existing products. Moreover, one solution cannot fit all contexts; it is an approach that requires a significant amount of analysis, game design thinking, testing and adjusting. Although digital technologies cannot replace authentic interactions with the ocean, the immersive features of these platforms can have the potential to involve and engage the students with the ocean. Furthermore, they are particularly relevant to address ocean literacy with students living far away from coastal areas, to whom live contact with the sea is seldom possible. Game features such as fun, beautiful and relevant aspects about the ocean, interactions, immediate feedback and the kinds of rewards seem to be the heart of gamified applications.
This study aimed to establish if there is any relationship between the use of different game elements, such as points, badges, leaderboards and the PBL triad, and learning outcomes. Although the samples sizes are not large, the study shows that different game elements can have different effects on the learning outcomes. To answer the research question: can different game elements impact the learning outcomes and the learning experience and, if so, how? Findings revealed that the use of points, badges and the PBL triad can positively affect the learning outcomes and the leaderboards as the main game element seemed to undermine them. Rather than focusing on rewards for motivation students’ learning, it is essential to focus more on how to develop more interesting and engaging learning activities, more autonomy and choice, ensuring that activities are optimally challenging. Stimuli should be sought that favoured collaboration over competition.
The analysis pointed to the same results in both countries regarding the interaction with the game elements, although the Portuguese students exhibited higher learning outcomes, and the effect was stronger on the UK students. This shows that the country did not influence the gamification effect, and the application helped to improve ocean literacy in both countries. Although care is needed when using leaderboards because of the type of competition that these can generate, gamified applications as a learning tool seem to successfully drive engagement, interaction, and the acquisition of knowledge is more effective, at least under these conditions. Many students stated that they felt they had learned a lot about the ocean during the test sessions. However, the Ocean literacy application itself is only part of the learning experience. Involving students and teachers during the class sessions to learn about the ocean environment generally would enhance the quality of the learning.
Acknowledgements
The authors are thankful to the student participants who took part in the study as well as the schools involved. We would also like to thank the Interdisciplinary Centre of Marine and Environmental Research (CIIMAR) for their help.
Disclosure statement
No potential conflict of interest was reported by the author(s).
Funding
This research was supported by the Arts and Humanities Research Council Design Star CDT (AH/L503770/1). The research was also supported by project OceanClass - Do oceano para a sala de aula funded by the Blue Growth Programme of EEA Grants Portugal (EEA.BG.SGS3.022.2019), (2021-2023) and by national funds through FCT (Foundation for the Science and Technology) within the scope of UIDB/04423/2020 and UIDP/04423/2020.
References
- Ankamah-Yeboah, I., B. B. Xuan, S. Hynes, and C. W. Armstrong. 2020. “Public Perceptions of Deep-Sea Environment: Evidence from Scotland and Norway.” Frontiers in Marine Science 7, 137. doi:https://doi.org/10.3389/fmars.2020.00137.
- Barracosa, H., C. B. de los Santos, M. Martins, C. Freitas, and R. Santos. 2019. “Ocean Literacy to Mainstream Ecosystem Services Concept in Formal and Informal Education: The Example of Coastal Ecosystems of Southern Portugal.” Frontiers in Marine Science 6, 626. doi:https://doi.org/10.3389/fmars.2019.00626.
- Bogost, I. 2015. “Why Gamification is Bullshit.” In The Gameful World: Approaches, Issues, Applications, 65–79. Cambridge: The MIT press.
- Boudet, H., L. Giordono, C. Zanocco, H. Satein, and H. Whitley. 2020. “Event Attribution and Partisanship Shape Local Discussion of Climate Change after Extreme Weather.” Nature Climate Change 10 (1): 69–76. doi:https://doi.org/10.1038/s41558-019-0641-3.
- Çakıroğlu, Ü., B. Başıbüyük, M. Güler, M. Atabay, and B. Yılmaz Memiş. 2017. “Gamifying an ICT Course: Influences on Engagement and Academic Performance.” Computers in Human Behavior 69: 98–107. doi:https://doi.org/10.1016/j.chb.2016.12.018.
- Cava, F., S. Schoedinger, C. Strang, and P. Tuddenham. 2005. Science Content and Standards for Ocean Literacy: A Report on Ocean Literacy. Retrieved September 30, 2021.
- Charlier, P. S., and R. H. Charlier. 1971. “A Case for Oceanography at the Inland School.” Science Education 55 (1): 15–20. doi:https://doi.org/10.1002/sce.3730550105.
- Cheng, K.-H. 2017. “Exploring Parents’ Conceptions of Augmented Reality Learning and Approaches to Learning by Augmented Reality with Their Children.” Journal of Educational Computing Research 55 (6): 820–843. doi:https://doi.org/10.1177/0735633116686082.
- Cherner, T. S., D. Wu, and A. G. Fegely. 2019. A Systematic Exploration of Language Learning Technologies: Insights for developers and educators. Opening Up Education for Inclusivity Across Digital Economies and Societies. Hershey, PA: IGI Global, pp. 137–155. doi:https://doi.org/10.4018/978-1-5225-7473-6.ch007.
- Chou, Y.-K. 2016. Actionable Gamification: Beyond Points, Badges, and Leaderboards. Fremont, CA: Octalysis Media. doi:https://doi.org/10.1017/CBO9781107415324.004.
- Ciências Naturais. Documentos curriculares de referência. 2018. Direção Geral Da Educação. https://www.dge.mec.pt/programas-e-metas-curriculares/ciencias-naturais
- Corner, A., S. Capstick, and N. Pidgeon. 2014. “Public Perceptions of Ocean Acidification: Summary Findings of Two Nationally Representative Surveys of the British Public Conducted during September 2013 and May 2014.” Understanding Risk Research Group Working Paper 14-01, 1–26.
- Costa, S., and R. Caldeira. 2018. “Bibliometric Analysis of Ocean Literacy: An Underrated Term in the Scientific Literature.” Marine Policy 87: 149–157. doi:https://doi.org/10.1016/j.marpol.2017.10.022.
- Costa, R. L., B. Mata, F. Silva, P. Conceição, and L. Guimarães. 2020. “Fostering Ocean Literate Generations: The Portuguese Blue School.” In Ocean Literacy: 21st Century Challenges. Book Series Key Challenges in Geography, edited by K. Koutsopoulos, R. M. González, and D. Schmeinck. Springer. Accepted for publication.
- Cotton, D., and J. Winter. 2010. “It’s Not Just Bits of Paper and Light Bulbs’: A Review of Sustainability Pedagogies and Their Potential for Use in Higher Education.” In Sustainability Education: Perspectives and Practice Across Higher Education, edited by S. Sterling. London: Earthscan. pp. 39–54. https://books.google.co.uk/books?hl=en&lr=&id=JP1V7OtBk7YC&oi=fnd&pg=PA38&dq=Cotton+and+Winter,+2010&ots=XKvW6wLWfu&sig=8JVZmmfJtqI4mM8VZ6cVLhcflLo&redir_esc=y#v=onepage&q=CottonandWinter%2C2010&f=false
- Cowburn, B., M. A. Samoilys, and D. Obura. 2018. “The Current Status of Coral Reefs and Their Vulnerability to Climate Change and Multiple Human Stresses in the Comoros Archipelago, Western Indian Ocean.” Marine Pollution Bulletin 133: 956–969. doi:https://doi.org/10.1016/j.marpolbul.2018.04.065.
- Csikszentmihalyi, M. 2014. “Toward a Psychology of Optimal Experience.” In Flow and the Foundations of Positive Psychology, 209–226. Netherlands: Springer. doi:https://doi.org/10.1007/978-94-017-9088-8_14.
- Daigle, D. 2003. Involving the Public in Coastal Conservation (E. D. Dallmeyer (Ed.)). Athens, GA: University of Georgia Press.
- Deterding, S., D. Dixon, R. Khaled, and L. Nacke. 2011a. “From Game Design Elements to Gamefulness: Defining Gamification.” Proceedings of the 15th International Academic MindTrek Conference on Envisioning Future Media Environments – MindTrek 11: 9–15. doi:https://doi.org/10.1145/2181037.2181040.
- Deterding, S., M. Sicart, L. Nacke, K. O’Hara, and D. Dixon. 2011b. “Gamification. using Game-Design Elements in Non-Gaming Contexts.” Proceedings of the 2011 Annual Conference Extended Abstracts on Human Factors in Computing Systems - CHI EA 11: 2425. doi:https://doi.org/10.1145/1979742.1979575.
- Dichev, C., D. Dicheva, G. Angelova, and G. Agre. 2015. “From Gamification to Gameful Design and Gameful Experience in Learning.” Cybernetics and Information Technologies 14 (4): 80–100. doi:https://doi.org/10.1515/cait-2014-0007.
- Dicheva, D., C. Dichev, and K. Irwin. 2018a. “Motivating and Engaging Students through Gamification.” International Conference on Advanced Learning Technologies, July. https://www.researchgate.net/publication/327002888_Motivational_Factors_in_Educational_Gamification.
- Dicheva, D., C. Dichev, G. Agre, and G. Angelova. 2015. “Gamification in Education: A Systematic Mapping Study.” Educational Technology & Society 18 (June): 75–88.
- Dicheva, D., K. Irwin, and C. Dichev. 2018b. “Motivational Factors in Educational Gamification.” 2018 IEEE 18th International Conference on Advanced Learning Technologies (ICALT), 408–410. doi:https://doi.org/10.1109/ICALT.2018.00102.
- Dieleman, H., and D. Huisingh. 2006. “Games by Which to Learn and Teach about Sustainable Development: Exploring the Relevance of Games and Experiential Learning for Sustainability.” Journal of Cleaner Production 14 (9-11): 837–847. doi:https://doi.org/10.1016/j.jclepro.2005.11.031.
- Digital Explorer. 2018. Encounter Edu. https://encounteredu.com
- Dromgool-Regan, C., N. Burke, and T. J. J. McClouglin. 2017. “Marine Deficit Disorder: Marine Literacy in Primary Student Teachers.” Proceedings of the ESERA 2017 Conference, Dublin.
- Drossel, K., B. Eickelmann, and J. Gerick. 2017. “Predictors of Teachers’ Use of ICT in School – the Relevance of School Characteristics, Teachers’ Attitudes and Teacher Collaboration.” Education and Information Technologies 22 (2): 551–573. doi:https://doi.org/10.1007/s10639-016-9476-y.
- EAUC. 2019. Green Gown Awards. https://www.greengownawards.org/enter
- Falasca-Zamponi, S. 2010. “Waste and Consumption.” In Waste and Consumption. New York: Routledge. doi:https://doi.org/10.4324/9780203834275.
- Fauville, G., C. Strang, M. A. Cannady, and Y.-F. Chen. 2019. “Development of the International Ocean Literacy Survey: Measuring Knowledge across the World.” Environmental Education Research 25 (2): 238–263. doi:https://doi.org/10.1080/13504622.2018.1440381.
- Foster, J. 2001. “Education as Sustainability.” Environmental Education Research 7 (2): 153–165. doi:https://doi.org/10.1080/13504620120043162.
- Frick, J., F. G. Kaiser, and M. Wilson. 2004. “Environmental Knowledge and Conservation Behavior: Exploring Prevalence and Structure in a Representative Sample.” Personality and Individual Differences 37 (8): 1597–1613. doi:https://doi.org/10.1016/j.paid.2004.02.015.
- Goodale, T. A. 2020. “Factors That Influence Curricular Adoption in a Sustainability Focused Marine Science Professional Development for in-Service Teachers.” Journal of Education for Sustainable Development 14 (1): 5–19. doi:https://doi.org/10.1177/0973408220934645.
- Gotensparre, S., G. Fauville, P. McHugh, C. Domegan, Å. Mäkitalo, and F. Crouch. 2017. Meta-Analysis of the Consultation Reports.
- Guest, H., H. K. Lotze, and D. Wallace. 2015. “Youth and the Sea: Ocean Literacy in Nova Scotia, Canada.” Marine Policy 58: 98–107. doi:https://doi.org/10.1016/j.marpol.2015.04.007.
- Hanna, L., K. Risden, and K. Alexander. 1997. “Guidelines for Usability Testing with Children.” Interactions 4 (5): 9–14. doi:https://doi.org/10.1145/264044.264045.
- Hartley, B. L., S. Pahl, M. Holland, I. Alampei, J. M. Veiga, and R. C. Thompson. 2018. “Turning the Tide on Trash: Empowering European Educators and School Students to Tackle Marine Litter.” Marine Policy 96: 227–234. doi:https://doi.org/10.1016/j.marpol.2018.02.002.
- Haßler, B., L. Major, and S. Hennessy. 2016. “Tablet Use in Schools: A Critical Review of the Evidence for Learning Outcomes.” Journal of Computer Assisted Learning 32 (2): 139–156. doi:https://doi.org/10.1111/jcal.12123.
- Huynh, D., L. Zuo, and H. Iida. 2016. Analyzing Gamification of “Duolingo” with Focus on Its Course Structure. Lecture Notes in Computer Science. Cham: Springer, 268–277. doi:https://doi.org/10.1007/978-3-319-50182-6_24.
- Kapp, K. M. 2012. The Gamification of Learning and Instruction: game-Based Methods and Strategies for Training and Education. San Francisco: John Wiley & Sons.
- Kelley, C., L. Wilcox, W. Ng, J. Schiffer, and J. Hammer. 2017. Design Features in Games for Health: Disciplinary and Interdisciplinary Expert Perspectives. Proceedings of the 2017 Conference on Designing Interactive Systems. Edinburgh: ACM, 69–81. doi:https://doi.org/10.1145/3064663.3064721.
- Kirillov, A. V., A. V. Melnichuk, V. V. Bondaletov, N. P. Li, and M. A. Lvova. 2018. “Gamification for the Motivation of Scientific and Pedagogical Staff.” Turkish Online Journal of Design Art and Communication 8 (SEPT): 1044–1056. doi:https://doi.org/10.7456/1080SSE/144.
- Kornevs, M., J. Baalsrud Hauge, and S. Meijer. 2019. “Gamification of a Procurement Process for Professional Training of Public Servants.” International Journal of Serious Games 6 (2): 23–37. doi:https://doi.org/10.17083/ijsg.v6i2.293.
- Leitão, R., M. Maguire, and S. Turner. 2019a. Ocean Literacy App (6.5). https://play.google.com/store/apps/details?id=org.rvleitao.oceanliteracy
- Leitão, R., M. Maguire, and S. Turner. 2019b. “Students’ Participation in the Design Process: A Study on User Experience of an Educational Game-like Application.” 11th Annual International Conference on Education and New Learning Technologies, 5381–5390. doi:https://doi.org/10.21125/edulearn.2019.1322.
- Leitão, R., M. Maguire, S. Turner, and L. Guimarães. 2021. “A Systematic Evaluation of Game Elements Effects on Students’ Motivation.” Education and Information Technologies. doi:https://doi.org/10.1007/s10639-021-10651-8.
- Leitão, R., M. Maguire, S. Turner, L. Guimarães, and F. Arenas. 2018. “Ocean Literacy and Information Sources: Comparison between Pupils in Portugal and the UK.” 12th Annual International Technology, Education and Development Conference, March, 5058–5067. doi:https://doi.org/10.21125/inted.2018.0998.
- Leitão, R., S. Turner, and M. Maguire. 2017. “The Use of Mobile Platforms in Science Learning: A Comparative Study between Portugal and the UK.” In ICERI2017 Proceedings, edited by L. Gómez Chova, A. López Martínez, and I. Candel Torres, pp. 5156–5165. IATED Academy. doi:https://doi.org/10.21125/iceri.2017.1357.
- Leitão, R., S. Turner, and M. Maguire. 2019c. “Gamification and Education: A Study of the Effects on Students Situational Motivation.” 11th Annual International Conference on Education and New Learning Technologies, 3110–3118. doi:https://doi.org/10.21125/edulearn.2019.0841.
- Lin, Y.-L., L.-Y. Wu, L.-T. Tsai, and C.-C. Chang. 2020. “The Beginning of Marine Sustainability: Preliminary Results of Measuring Students’ Marine Knowledge and Ocean Literacy.” Sustainability 12 (17): 7115. doi:https://doi.org/10.3390/su12177115.
- Lister, M. 2015. “Gamification: The Effect on Student Motivation and Performance at the Post-Secondary Level.” Issues and Trends in Educational Technology 3 (2), 22. https://www.learntechlib.org/p/171075/. doi:https://doi.org/10.2458/azu_itet_v3i2_lister.
- Liu, D., R. Santhanam, and J. Webster. 2017. “Toward Meaningful Engagement: A Framework for Design and Research of Gamified Information Systems.” MIS Quarterly 41 (4): 1011–1034. doi:https://doi.org/10.25300/MISQ/2017/41.4.01.
- Marrero, M. E., and F. M. M. Mensah. 2010. “Socioscientific Decision Making and the Ocean: A Case Study of 7th Grade Life Science Students.” The Electronic Journal for Research in Science & Mathematics Education 1 (14), 27.
- McGrath, M. 2018. Slowing Gulf Stream Current to Boost Warming for 20 Years. BBC News. https://www.bbc.co.uk/news/science-environment-44875508?intlink
- Mercer, T. G., A. P. Kythreotis, Z. P. Robinson, T. Stolte, S. M. George, and S. K. Haywood. 2017. “The Use of Educational Game Design and Play in Higher Education to Influence Sustainable Behaviour.” International Journal of Sustainability in Higher Education 18 (3): 359–384. doi:https://doi.org/10.1108/IJSHE-03-2015-0064.
- National Curriculum in England: Science Programmes of Study. 2015. Department for Education. https://www.gov.uk/government/publications/national-curriculum-in-england-science-programmes-of-study/national-curriculum-in-england-science-programmes-of-study
- Ocean Literacy Network. 2013. Ocean Literacy : The Essential Principles of Ocean Sciences for Learners of All Ages, Version 2. http://www.coexploration.org/oceanliteracy/documents/OceanLitChart.pdf
- O’Donnell, E. C., and C. R. Thorne. 2020. “Drivers of Future Urban Flood Risk.” Philosophical Transactions. Series A, Mathematical, Physical, and Engineering Sciences 378 (2168): 20190216. doi:https://doi.org/10.1098/rsta.2019.0216.
- Pantò, E. 2019. “A Game for Learning Ocean Literacy: The ResponSEAble Project.” International Information & Library Review 51 (3): 247–252. doi:https://doi.org/10.1080/10572317.2019.1629067.
- Papathanassiou, M., McHugh C., Domegan S., Gotensparre G., Fauville, and J. Parr. 2017. “Barriers to Teaching Ocean Science in Greek Schools.” EGU General Assembly Conference Abstracts, p. 13965.
- People and Planet. 2019. https://peopleandplanet.org/university-league
- Plankis, B., and M. E. Marrero. 2012. “Recent Ocean Literacy Research in United States Public Schools: Results and Implications.” International Electronic Journal of Environmental Education 1 (1), 27.
- Prensky, M. 2001. “Fun, Play and Games: What Makes Games Engaging.” Digital Game-Based Learning (Chapter 5). New York: McGraw-Hill.
- Rebolledo-Mendez, G., K. Avramides, S. De Freitas, and K. Memarzia. 2009. “Societal Impact of a Serious Game on Raising Public Awareness: The Case of FloodSim.” Proceedings of the 2009 ACM SIGGRAPH Symposium on Video Games, Sandbox 9: 15–22. doi:https://doi.org/10.1145/1581073.1581076.
- Santoro, F., G. Scowcroft, S. Selvaggia, and P. Tuddenham. 2017. Ocean Literacy for All - A Toolkit (F. Santoro, G. Scowcroft, S. Selvaggia, and P. Tuddenham (Eds.)). Paris: IOC/UNESCO & UNESCO Venice Office.
- Trenberth, K. E., L. Cheng, P. Jacobs, Y. Zhang, and J. Fasullo. 2018. “Hurricane Harvey Links to Ocean Heat Content and Climate Change Adaptation.” Earth’s Future 6 (5): 730–744. doi:https://doi.org/10.1029/2018EF000825.
- Tsai, L.-T. 2019. “Multilevel Effects of Student and School Factors on Senior High School Students’ Ocean Literacy.” Sustainability 11 (20): 5810. doi:https://doi.org/10.3390/su11205810.
- United States Commission on Ocean Policy. 2004. An Ocean Blueprint for the 21st Century. Washington DC: U.S. Commission on Ocean Policy. Final report.
- Veronica, R., and G. Calvano. 2020. “Promoting Sustainable Behavior Using Serious Games: SeAdventure for Ocean Literacy.” IEEE Access 8: 196931–196939. doi:https://doi.org/10.1109/ACCESS.2020.3034438.
- Visbeck, M. 2018. “Ocean Science Research is Key for a Sustainable Future.” Nature Communications 9 (1): 690. doi:https://doi.org/10.1038/s41467-018-03158-3.
- Warmelink, H., J. Koivisto, I. Mayer, M. Vesa, and J. Hamari. 2020. “Gamification of Production and Logistics Operations: Status Quo and Future Directions.” Journal of Business Research 106: 331–340. doi:https://doi.org/10.1016/j.jbusres.2018.09.011.
- Werbach, K., and D. Hunter. 2012. For the Win: How Game Thinking Can Revolutionize Your Business. Philadelphia: Wharton Digital Press.
- Winks, L., M. Ward, J. Zilch, and E. Woodley. 2020. “Residential Marine Field-Course Impacts on Ocean Literacy.” Environmental Education Research 26 (7): 969. doi:https://doi.org/10.1080/13504622.2020.1758631.
- Zichermann, G., and C. Cunningham. 2011. Gamification by Design: Implementing Game Mechanics in Web and Mobile Apps. Sebastopol, CA: O’Reilly Media.