
 ?Mathematical formulae have been encoded as MathML and are displayed in this HTML version using MathJax in order to improve their display. Uncheck the box to turn MathJax off. This feature requires Javascript. Click on a formula to zoom.
Abstract
Environmental education (EE) has received more and more attention worldwide. In Korea, there is a national consensus on the importance of EE; however, it is not as much of a priority as other education subjects or themes, based on annual survey results. This study asks how much value Korean citizens place on EE, revealing its value more objectively than the opinion survey. This study estimates citizens’ benefits from EE using the contingent valuation method (CVM) to elicit willingness to pay (WTP). The survey scenario detailed information about the Green Movable EE Classroom program managed by the South Korean Ministry of Environment, and its 1,004 participants comprised a representative sample of Korea. The results are as follows. If the average household’s annual WTP (KRW 17,575; USD 14.85) were expanded to the total number of Korean households, the total benefit would be about KRW 367.2 billion (USD 310 million) per year. This result can be interpreted as citizens being willing to pay that amount for EE. This study estimated the economic value and is the first empirical attempt to reveal the value of EE nationwide. This study expands the theoretical discussion of the value of EE and provides evidence for policy revision.
Introduction
This is an era of climate crisis. According to the Intergovernmental Panel on Climate Change (IPCC Citation2021), climate change is caused by human activity, and global temperatures are increasing at an unprecedented rate. In 2019, over 11,000 scientists from 153 countries declared a climate emergency, emphasizing the need for transformative climate action (Ripple et al. Citation2020). Ripple et al. (Citation2020) asserted that education is a prerequisite for action and that climate change education should be included as a core curriculum in schools worldwide.
Environmental education (EE) has received more and more attention worldwide because of the current climate crisis. EE is emphasized because everyone’s lives rely on the environment, which is the premise and condition of human existence (Kang et al. Citation2021) and is impacted by climate change. Among the three pillars of sustainable development—environment, society, and economy—the environment is the foundation for the other two (WWF Citation2018). As environmental problems become more tangible during the climate crisis, EE is receiving more attention as fundamental to addressing these problems.
The Organisation for Economic Cooperation and Development (OECD Citation2018) stated that the environmental challenge is one of the most important challenges that should be considered as part of future education. This reminds us that environmental issues are no longer external to education but are on the agenda of what education should consider. South Korea is attempting to reflect this. Its Ministry of Education stated that the 2022 revised national curriculum should include sustainable development, the climate crisis, and ecological transition using a whole-curriculum approach that goes beyond individual subjects (Ministry of Education Citation2021). At the same time, there is increasing social consensus on the importance of EE in South Korea. The 2020 annual survey of public attitudes toward the environment showed that 89.4% of citizens agreed with the necessity of EE and 82% of citizens agreed with making it a compulsory course in the public education system (Kim, Jeon, and Lee Citation2020). However, there is also conflicting data. The annual public opinion poll on education asked which academic subjects should be strengthened. EE was chosen by 2.3% at the elementary school level, 2.5% at the middle school level, and 2.9% at the high school level (Im et al. Citation2020). In other words, EE is a lower priority than other subjects. These survey results on EE are contradictory.Footnote1
Given these survey results, this study estimates the economic value that Korean citizens assign to EE. It reveals the value more objectively than opinion surveys and presents it in a comparable and communicable unit: monetized value, following the economic valuation method. It is crucial to consider the characteristics of EE when attempting to monetize its value. An essential feature of EE is its capacity to generate positive externalities, which include both direct and indirect pro-environmental effects. These externalities are reinforced by the fact that EE deals with the environment, which is a type of public good, and its effects can spill over beyond the individual. While private individuals incur costs for EE in terms of time, investment, and other resources, the benefits and outcomes of EE extend beyond the private realm, highlighting its public good characteristics (Lee Citation2016).
This characteristic is linked to another feature of EE, its nonmarket nature. The market mechanism is not appropriate for managing EE, and a market price cannot accurately reflect the value of EE. This inadequacy arises because market prices seldom incorporate nonuse values, even when EE has such values. Consequently, the market price may provide some indication of the true value of EE, but it is likely to underestimate it. The limitations of the market mechanism underscore the role of the public sector as the primary provider of EE (Lee Citation2016).
While previous research has focused on the meaning and importance of EE, rather than its value, this study establishes a theoretical foundation for determining the concrete value of EE using a specific unit of measurement. It thus provides evidence for policymakers to consider when making decisions about EE. This approach is necessary to distinguish the significance and characteristics of EE from its actual value and to provide a foundation for future discussions about the value of EE.
Valuing public goods can efficiently allocate resources (Haab and McConnell Citation2002). However, public goods have externalities and ambiguous property rights, so they are not managed by the market. Economic methods can estimate the value of nonmarket goods, which are not traded in the market and have unique characteristics (Freeman, Herriges, and Kling Citation2014). This type of valuation is known as nonmarket valuation. In this study, we estimate the value of environmental education using the nonmarket valuation method. The contingent valuation method (CVM) is a nonmarket valuation method that uses survey data to inquire into citizens’ willingness to pay (WTP) for specific goods or services under hypothetical scenarios. CVM can reveal the value of nonmarket goods, such as EE, with a monetized number and a countable index.
Previous studies on EE policy have focused on educational or environmental policies. However, these studies do not directly reflect the properties of EE (Zachariou and Korfiatis Citation2021). They have considered education or the environment instead of EE itself. This study specifies EE’s unique properties to estimate its value. This is the first empirical attempt to reveal the economic value of EE nationwide. EE has been considered to be in opposition to the economy because the economy and the environment are often viewed in a dichotomous manner (Kang and Hong Citation2021). However, this attempt is necessary for creating a communicable index and confirming social consensus using monetary terms. Additionally, it has academic meaning by giving shape to an ignored value.
The literature review section provides the economic meaning of value and links the characteristics of EE with its value. The methods section explains the research design using CVM as a valuation method. The results section presents the elicited value as WTP. Finally, the discussion section analyzes the meaning of this study.
Literature review
Value classification and total economic value
Value classification can help determine the scope of valuation and compare the range of different values, even if they are somewhat arbitrary (National Research Council Citation2005). This study reviews the scope of valuation and divides it into different categories to estimate value. While the market generally reflects the value of goods, relying on market prices alone may underestimate their true value. This is because the market price of goods or services that create social benefits does not always reflect the external benefits they provide (Blomquist et al. Citation2014). Moreover, it can be challenging to determine the value of goods or services that are not traded in the market. This is a critical point to consider when differentiating between market price and economic value: economic value typically covers a broader scope than market price (National Research Council Citation2005). The difference between market price and value becomes particularly apparent when externalities are not factored into market transactions (Freeman, Herriges, and Kling Citation2014).
One question that arises is how to divide economic value for valuation. Before delving into economic value, it is worth considering the scope of value more generally. Brown (Citation1984) categorized value into held value and assigned value. Held value refers to the value of the final state or characteristics of goods or services themselves (Rokeach Citation1973). Assigned value is more relative and is not dependent on the goods’ inherent characteristics (Brown Citation1984). Economic valuation, strictly speaking, is a form of assigned value. Research into value is aimed at identifying and measuring the relationship between held value and assigned value (Schroeder Citation2013). While held value can influence assigned value (Kenter et al. Citation2019), the concepts are not interchangeable. Brown (Citation1984) made a significant contribution by distinguishing value based on preferences from value that is not based on preferences (Schroeder Citation2013).
Economic valuation reveals the assigned value, and the economic value can be divided theoretically. Economic valuation uses total economic value (TEV), composed of use value and nonuse value (Segerson Citation2017). Nonuse value (also called passive use value) corresponds to cases when the goods or services are not directly used (Carson, Flores, and Meade Citation2001). Use value is related to present and future usage availability, but nonuse value is based on existence regardless of usage, including existence value and bequest value (Bastien-Olvera and Moore Citation2020). Goods with public good characteristics often have nonuse value because they contain a value for others, such as altruistic value or bequest value for future generations. Providing education to the local community can be seen as an altruistic value, and enabling future attendance can be seen as a bequest value. Nonuse value is becoming more critical in economic valuations as public goods are more emphasized in society (Carson Citation2012). An example of nonuse value is existence value (Arrow et al. Citation1993), which reflects the desire to conserve existence regardless of usage now and in the future (Segerson Citation2017). Nonuse value is related to existence value, and the terms existence, nonuse, and passive use are used interchangeably in research (National Research Council Citation2005).
The distinction between use and nonuse value may appear arbitrary because they are not well defined and generally overlap (Carson Citation2012; More, Averill, and Stevens Citation1996). Theoretically, value can be divided into subvalues, making it possible to understand them. In summary, economic valuation reveals a value assigned by an individual (Segerson Citation2017), while total economic value—the basis of this study’s estimates of value—encompasses both use value and nonuse value.
Characteristics of EE and economic value
Market prices cannot capture the value of EE in many cases. One reason is the public goods characteristics of EE (Lee Citation2016). The market cannot correctly manage goods that have public goods characteristics. Education is perceived as a public good when provided by the public sector. However, it is quasi-public or a merit good in a strict sense, as it exhibits some private good attributes even when the public sector provides it (Ostrom and Ostrom Citation1977). Therefore, while EE is not exactly a full public good like education, it is quasi-public good that has the characteristics of a public good.
Public goods are defined theoretically as nonexcludable and nonrivalrous. Quasi-public goods, including education, have one or both of these attributes to an imperfect degree. shows the classification of goods based on the two attributes (Ostrom and Ostrom Citation1977; Perman et al. Citation2011). EE, like all education, has characteristics of public goods, which makes it challenging to estimate its economic value. Moreover, EE deals directly with the environment—a public good—making it even more challenging to directly estimate value. As a result, EE has a significant amount of nonuse value, making it hard to directly estimate its economic value (Blomquist et al. Citation2014).
Table 1. Classification of goods (Ostrom and Ostrom Citation1977; Perman et al. Citation2011).
Table 2. Result of the estimation.
The classification of values and the characteristics of EE help explain the range of value EE can provide. While EE can have a direct positive effect on the environment, it can also have a range of outcomes. Krasny (Citation2020) divides EE outcomes into technological, structural, and cognitive fixes, showing that EE can have both direct and indirect effects on the environment.
EE outcomes are often discussed over a broader range, including their personal, societal, and ecological aspects (Ardoin, Bowers, and Gaillard Citation2020). Several meta-analyses have synthesized the outcomes of EE, showing that EE focuses not only on ecological impacts but also on knowledge, attitudes, and behaviors (Ardoin, Bowers, and Gaillard Citation2020; Monroe et al. Citation2019). Other research includes dispositions, competencies, and personal characteristics (Ardoin et al. Citation2018) or arranges outcomes into categories such as knowledge, awareness, skills, attitudes, intentions, behaviors, and enjoyment (Stern, Powell, and Hill Citation2014). These trends reflect EE’s goal of developing environmental literacy by focusing on multidomain outcomes (Hollweg et al. Citation2011). Overall, while the direct ecological impact is an important outcome of EE, it is crucial to recognize the broader range of outcomes that EE can achieve, including its personal and societal benefits.
One goal of EE can be to directly impact the environment, but educational outcomes can also be a primary goal of EE. We emphasize both perspectives and argue intermediate outcomes have meaning (Krasny Citation2020). EE focuses on intermediate outcomes by considering educational meaning. EE also concentrates on the possibility that small-scale experiences and participation can impact other domains or lead to large-scale participation. For example, daily pro-environmental behavior connects to citizen participation, such as the acceptance of wind power installation (Thøgersen and Noblet Citation2012), and participation in environmental campaigns predicts participation in other environmental activities (Thøgersen and Crompton Citation2009).
The outcomes or benefits of EE can be understood from the perspective of the environment or of education. EE deals with the direct environmental effect as a use value from the environmental perspective. Nonuse value can also exist in this area. Cultivating knowledge and disposition is a use value from an educational perspective. There is also a nonuse value in outcomes within the educational area, including altruistic or existence value.
In summary, the economic value of EE covers the range from use value to nonuse value. The value classification differs according to the focus and perspective of EE. Following this, the value of EE can be classified, but it is not realistic to estimate classified value given that the values overlap. That is why this study and nonmarket valuations estimate the total economic value. At this point, nonmarket valuation is the proper way to estimate the value of EE, including its use and nonuse value. This study includes two domains: use and nonuse value. This study estimates the value of EE under the definition of total economic value.
Nonmarket valuation
Numerous studies have developed nonmarket valuation for goods that are not traded in competitive markets, such as EE.Footnote2 The true value of these goods is weakly revealed in transactions (Lee et al. Citation2009). There are two primary approaches to valuation, one based on revealed behavior and the other on hypothetical scenarios and questions (Haab and McConnell Citation2002). The first approach is called the revealed preference method, while the second is known as the stated preference method. Revealed preference can be identified in observed data, such as the travel cost method and the hedonic price method (Segerson Citation2017). The travel cost method uses an individual’s price for the utility (Parsons Citation2017), while the hedonic price method uses factors that impact market prices, such as landscape (Taylor Citation2017).
Two commonly employed methods for stated preference valuation are the contingent valuation method (CVM) and choice experiment (CE). CVM is used for the overall valuation of goods or services, whereas CE focuses on specific factors representing the goods or services (Holmes, Adamowicz, and Carlsson Citation2017; Segerson Citation2017). CVM usually concentrates on the provision of goods, while CE delves into the individual components or attributes of the goods. The choice of which method to use depends on the specific purpose of the analysis.
Stated preference uses surveys to estimate both use and nonuse values, with CVM being the most widely employed approach for estimating total economic value, including nonuse value (Carson, Flores, and Meade Citation2001; Wang, Gong, and Mao Citation2018). Nonuse value is inherently challenging to observe in the market, which underscores the need for stated preference methods to capture it. In contrast, revealed preference methods, such as travel cost and hedonic price analyses, are best suited for estimating the benefits derived solely from use value (Shah, Hoag, and Loomis Citation2017).
The stated preference survey incorporates a tradeoff ratio. Goods that are traded in the market reveal the tradeoff ratio through their market price (Freeman, Herriges, and Kling Citation2014). This is because the market price represents the relationship between increasing utility from consuming goods and decreasing utility from consuming them. Stated preference introduces this relationship into the survey through willingness to pay and the quality or quantity of goods. For example, a survey may ask how much an individual is willing to pay for higher quality nonmarket goods. That question seeks to determine how much the individual is willing to give up for the increased quality, thereby revealing the tradeoff ratio (Segerson Citation2017). The result can efficiently allocate public goods, as the survey adheres to general economic theory (Haab and McConnell Citation2002).
The stated preference method is used when data are not available through revealed preference. Revealed preference should identify behavioral data relating to goods in the market, but this is challenging for environmental goods such as biodiversity (Pham et al. Citation2018; Wang, Gong, and Mao Citation2018), ecosystem services (Chu et al. Citation2020; Naime et al. Citation2020), and carbon (Choi Citation2015; Yang et al. Citation2014). This is why the field of nonmarket valuation has been developed specifically for environmental goods.
CVM has faced criticism from various disciplines for its shortcomings. However, a U.S. National Oceanic and Atmospheric Administration (NOAA) blue ribbon panel cochaired by two Nobel laureates concluded that CVM can offer reliable estimations that capture nonmarket value (Jones et al. Citation2017). Subsequently, a range of guidelines has been developed, beginning with the NOAA panel report by Arrow et al. (Citation1993). More recently, Johnston et al. (Citation2017) synthesized a comprehensive set of guidelines from peer-reviewed literature (Rotaris and Danielis Citation2019).Footnote3
The development of CVM has significantly expanded the field of nonmarket valuation. Numerous domains, including education, culture, welfare, transportation, health, and marketing, have adopted CVM for valuation purposes. Contemporary research increasingly focuses on intangible benefits, which has led to the broader utilization of the stated preference method across various sectors (Eom & Hong Citation2009; Johnston et al. Citation2017).
Many research studies have explored nonmarket valuation within the education sector, which is considered a quasi-public good. The sector has attracted valuation studies in areas like higher education (Blomquist et al. Citation2014), physical activity (Cha et al. Citation2019), and counseling (Choi et al. Citation2013). CVM has also been used to assess the value of cultural services as a type of ecosystem service that focuses on education (Cheng et al. Citation2019). The value of interpretative birdwatching services that could be a kind of EE has also been studied (Lee et al. Citation2009).
The revealed preference method is based on actual data relating to the market, but it is rarely used for nonmarket goods. Stated preference overcomes these limitations and has the benefit of covering nonuse value. CVM is used for overall valuation, and this study employs CVM in consideration of the scope of valuation and the purpose of the study.
Methods
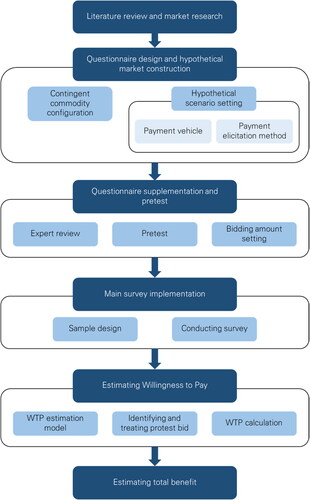
CVM for nonmarket valuation is conducted in many studies following a standardized process. This study designed CVM following the process and guidelines suggested in the literature (Arrow et al. Citation1993; Boyle Citation2017; Eom, Kwon, and Shin Citation2011; Haab and McConnell Citation2002; Johnston et al. Citation2017). CVM can be broken into three parts: constructing a contingent market, pretesting and conducting the main survey, and estimating WTP and conducting analysis.
To begin, a contingent market with a specified target needs to be constructed to estimate WTP, and CVM uses a survey to reveal stated preferences. The contingent market contains information about contingent commodities, payment vehicle, and the WTP elicitation method. The next step is pretesting, which makes the survey more relevant and determines the range of bidding for the primary survey. The econometric model estimates WTP using the data collected in the main survey. Finally, the economic value of EE can be estimated by expanding the estimated WTP per household to the whole nation. The CVM process is illustrated in .
Figure 1. CVM Process.
Constructing contingent market with CV scenario
CVM uses a hypothetical scenario in a sample survey to elicit a response (Portney Citation1994). The scenario includes contingent commodities, which are a vital component of eliciting WTP (Eom & Hong Citation2009). The scenario is a hypothetical condition that changes the respondent’s expected utility (Johnston et al. Citation2017). To estimate the value of EE, its scope must be concretely specified. This study selected a contingent commodity based on Korean citizens’ EE value. The Green Movable EE ClassroomFootnote4 program was selected because it is a standardized program maintained for more than 15 years that has a systematic curriculum and EE teachers (Appendix 1). The program, operated by the Ministry of Environment, provides an experiential mobile environment classroom that visits schools and other learning locations in large, remodeled buses. In 2019, the program operated 900 classes, and 22,000 students participated.
This contingent commodity targets the future generation. Almost every EE program in Korea targets future generations, including adolescents. This study considers the actual EE programs in the field. The future generation includes the unborn generation and children under 16 (Seo et al. Citation2011), indicating that this study’s value estimation includes nonuse value, specifically bequest value.
The hypothetical scenario presented to respondents in the CVM asked about their willingness to pay. The question could have used WTP or willingness to accept (WTA), but we used WTP because of WTA’s endowment effect and uncertain results. Guidelines also suggest using WTP (Arrow et al. Citation1993; Johnston et al. Citation2017). Another essential component of the hypothetical scenario is the payment vehicle, which can affect repulsion and willingness to pay (Carneiro and Carvalho Citation2014; Ivehammar Citation2009). Tax, funds, and usage fees are commonly used payment vehicles; this study uses funds because it estimates the value citizens assign to EE with characteristics of public goods and because funds decrease repulsion compared to taxes (Shah, Hoag, and Loomis Citation2017). Respondents answered the question as a household representative, and the survey emphasized this point.
The second part of the CV scenario is to select the WTP elicitation method. The dichotomous choice method was used for elicitation. Respondents were asked to answer either ‘Yes’ or ‘No’ to a question, which is the same format as a consumer’s decision in the market (Arrow et al. Citation1993). The dichotomous choice method is divided into single-bound and double-bound dichotomous choices, depending on the number of questions asked. The double-bound dichotomous choice (DBDC) asks a second question based on the respondent’s answer to the first question. After a ‘Yes’ answer, DBDC asks for a larger amount of money, while after a ‘No’ answer, it suggests a smaller amount of money. DBDC can yield more data from a single survey than single-bound dichotomous choice (SBDC) (Hanemann, Loomis, and Kanninen Citation1991; Johnston et al. Citation2017). However, the repeated question might lead to strategic answers, which could result in bias. Recent CVM guidelines suggest asking double-bound questions and estimating WTP using the single-bound data (Johnston et al. Citation2017). This study used DBDC to ask questions but only used single-bound data in the analysis.
Expert review, pretest, and the main survey
The survey materials were revised following expert reviews and pretesting. The review process involved eight experts (three females, five males), both before and after the pretest. Prior to the pretest, three experts with backgrounds in environmental education, environmental policy, and valuation assessed the appropriateness of constructing a contingent market and utilizing CVM methods to estimate the value of EE. After the pretest, three reviewers—one with expertise in environmental education and two with expertise in valuation—examined the scope of bidding amounts based on pretest results and discussed considerations for interpreting WTP. Additionally, the survey materials’ suitability, including sentence structure and content, were validated by a reliable survey firm and by two school teachers who specialized in EE.
The pretest was conducted using the reviewed survey material for two purposes. First, the pretest confirmed whether the survey questionnaires were properly understood. Second, it elicited the range of bid amounts for WTP through open-ended questions such as ‘How much will you pay for it?’ The pretest used the same contingent commodity as the primary survey, but open-ended questions were used for WTP elicitation, unlike in the primary survey.
The target sample was the entire nation, selected randomly. The pretest observed 278 households, of which 48.56% (n = 135) gave a positive answer for WTP. The range of WTP was from 0 to KRW 1,000,000 (USD 845),Footnote5 with the most frequent answer being KRW 10,000 (n = 42, USD 8.45), followed by KRW 100,000 (n = 18, USD 84.5) and KRW 50,000 (n = 17, USD 42.23). The mean WTP was KRW 22,848 (USD 19.30), including a negative WTP answer. The bid amounts were chosen based on the range of WTP from the pretest, generally as 15% to 85% of the range. However, the pretest results showed a much wider range. Therefore, this study set three bid amounts: KRW 10,000 (USD 8.45), KRW 30,000 (USD 25.34), and KRW 50,000 (USD 42.23). The bid amounts were also reviewed during the expert review session.
CVM estimates WTP using a sample survey, with a representative sample revealing the WTP of citizens. The economic value of EE can be estimated through representative sampling (Eom & Hong Citation2009). The target sample was based on the number of households in Korea by region, and a reliable platform with extensive experience in CVM surveys conducted the survey. The target respondents were adults over 19 years of age who could be household representatives. The survey was conducted online for 18 days, from September 21, 2020, to October 9, 2020; 1,004 people participated.Footnote6
This study utilized an online survey because of COVID-19 and because it was more cost-effective than a face-to-face survey (Boyle Citation2017). Online surveys also help mitigate unintended interviewer effects, such as social desirability. Previous research has shown that online surveys provide almost the same results as other formats (Johnston et al. Citation2017). The survey contained three sections of questions: the first part checked for general cognitive awareness of EE, the second elicited WTP, and the third gathered demographic information. The questionnaire for eliciting WTP is provided in Appendix 1.
Data analysis
The data analysis stage was divided into two parts. In the first part, the householder’s preferences were estimated using the discrete choice model. In the second part, WTP was calculated. The dichotomous choice can be interpreted using a discrete choice model, which should be explained based on utility theory (Freeman, Herriges, and Kling Citation2014). Hanemann (Citation1984) used a random utility model (RUM) that McFadden (Citation1974) developed. RUM can explain the economic theory of utility maximization under a budget constraint. This study used RUM for estimation.
Haab and McConnell (Citation2002) estimated preference and calculated WTP using RUM and a linear utility function. The function below shows the process of estimating and calculating WTP theoretically. The subscript 1 represents the utility after consuming the commodity, and the subscript 0 represents the utility before consuming the commodity. is the income of the household j, and
is the demographic factor.
is the stochastic part that cannot be observed in the survey. This study assumed that
follows a normal distribution.
(1)
(1)
(2)
(2)
(3)
(3)
One challenge in the estimation process is distinguishing and handling protest bidders. Protest bidders are respondents who provide negative responses and should be classified as either zero bidders or protest bidders. Zero bidders indicate that respondents reveal a zero value for the commodity, whereas protest bidders suggest that their responses do not reveal their true value because of repulsion from hypothetical scenarios like a commodity or payment vehicle.
It is difficult to determine whether protest bidders attribute a positive or zero value to a commodity; several studies have explored the challenge of handling them (Eom & Hong Citation2009; Gyrd-Hansen Citation2016; Jones et al. Citation2017; Strazzera et al. Citation2003). Moreover, a high rate of negative responses can result in a negative WTP estimate, which underscores the importance of distinguishing and addressing protest bidders. Unfortunately, there is no universally accepted best practice for dealing with this issue (Johnston et al. Citation2017).
The most straightforward way to address protest bidders is to exclude them from the analysis process (Gyrd-Hansen Citation2016). However, this method raises concerns because it may lead to a lack of representativeness in the CVM sample. Protest bidders may exhibit different demographic characteristics than other respondents (Eom & Hong Citation2009); excluding persons with distinct attributes could introduce sample selection bias.
This study distinguished protest bidders by using follow-up questions, following Eom and Hong (Citation2009). Examples of answers chosen by protest bidders include ‘EE should be provided by already paid tax’ and ‘I am not sure that the funds are used only for EE.’ In this study, protest bidders were treated as zero bidders, and their responses were calculated as zero WTP. The analysis proceeded using positive responses in the estimating stage. WTP was then calculated using positive and negative responses, including protest bidders with a weighted average (Eom, Kwon, and Shin Citation2011; Yang et al. Citation2014). The final WTP value was determined by calculating the mean of responses and considering the nonzero bid proportion in the entire sample, following Equationequation (4)(4)
(4) (Yang et al. Citation2014).
(4)
(4)
Estimating preferences without considering protest bidders may result in an overestimation of WTP. Therefore, this study adopted a conservative approach by treating protest bidders as having a zero WTP. This may have led to an underestimation of WTP because some protest bidders may indeed hold a positive value (Cooper, Burton, and Crase Citation2019). We estimated WTP from 408 observations using the discrete choice model in the first part and calculated WTP to reflect a zero WTP ratio (408/1,004) in the second part.
Results
WTP response
WTP was calculated based on the householder’s preferences and represents the estimated mean value of WTP. Covariates, such as demographic factors, do not affect the representative value. Estimates of mean WTP usually do not consider covariates (Cameron and Quiggin Citation1994; Johnston et al. Citation2017). The model with covariates is typically used to check sample characteristics and whether the survey was conducted correctly. Descriptive statistics of demographic factors are in Appendix 2.Footnote7
The focus of this study is the householder’s WTP, which was calculated by reflecting the bid amounts and the answer to the dichotomous choice question. This section reviews the WTP response based on the bid amounts. summarizes 408 sample responses, excluding protest bidders and zero bidders.
Figure 2. Bidding amount and yes ratio.
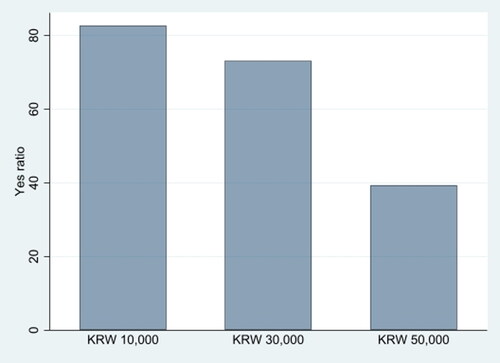
This study used single-bound answers for data analysis, and the survey was conducted with double-bound dichotomous choices.Footnote8 The first bid amounts were KRW 10,000 (USD 8.45), KRW 30,000 (USD 25.34), and KRW 50,000 (USD 42.23). The bid amount was randomly assigned to respondents from one of three bid levels. shows the relationship between the ‘Yes’ response and the bid amounts. Increasing bid amounts decreased the ‘Yes’ response on the bid amounts. It can be said that the survey was conducted suitably in a fundamental economic manner. The ‘Yes’ ratio based on the first amount exceeded 70% at KRW 10,000 (82.73%), KRW 30,000 (73.08%), and KRW 50,000 (39.39%). Based on the ‘Yes’ answer ratios, it can be assumed that the bid amount was adequately presented in the survey.
WTP estimation
This study estimated WTP using the probit model, assuming a normal distribution. A linear WTP model was used for the analysis, with two models in this study. Model I used only the bid amount, while Model II added demographic factors to the covariates. Model I was used to estimate the mean WTP, as covariates do not significantly affect the representative value (Cameron and Quiggin Citation1994; Johnston et al. Citation2017). Meanwhile, Model II checked the validity of the models and examined the relationship between covariates. Based on the estimation result and weighted averages, the representative WTP of this study was calculated.
Both Model I and Model II show that bid amounts significantly and adversely affected WTP. Higher prices resulted in lower ‘Yes’ response rates, which aligns with general economic assumptions. While Model I estimated mean WTP using bid amounts only, Model II included demographic factors and environmental concerns to examine their potential influence. Similar to Model I, the bid amounts also significantly affected WTP in Model II; the coefficient of the bid amounts was nearly identical between the models. Among the covariates, only household income had a significant positive effect on WTP, meaning that higher income leads to greater WTP ().Footnote9
presents the calculated WTP based on the estimated results. Model I calculated WTP using bid amounts and a constant value, while Model II incorporated the coefficients of covariates in the calculation. The weighted average (408/1,004) was applied in both models. Model I estimated the annual household’s WTP for EE at KRW 17,575.44 (USD 14.85), while Model II estimated it at KRW 17,255.02 (USD 14.57). As previous research has indicated, the difference between the two models is negligible. This study used the representative value based on Model I based on its suitability for estimation and calculation purposes. In summary, this study suggests that a typical Korean household has an annual WTP of KRW 17,575.44 (USD 14.85) for EE.
Table 3. Mean WTP.
Table 4. Annual total benefit.
This study utilized sample data that were representative of the entire country, meaning the calculated WTP for one household can be extrapolated to estimate the total benefit for the entire population (Yoo and Kwak Citation2009). The total benefit is a general outcome of the WTP for a communicable unit (Arrow et al. Citation1993). To estimate the total benefit, the WTP value from Model I was multiplied by the total number of households in the country, which Statistics Korea (Citation2019) estimates at approximately 20.9 million. The total annual benefit of the EE program was estimated as approximately KRW 367.2 billion (USD 310 million) ().Footnote10
Discussion
Summary and implications
The primary objective of this study was to ascertain the economic value of environmental education and thus shed light on the worth citizens assign to it. The research delved into pertinent economics literature on total economic value and classified values to determine a way to extract the economic value of EE. We considered total economic value, both use and nonuse value, given EE’s inherent public good characteristics. The findings indicate an annual household willingness to pay of approximately KRW 17,575 (USD 14.85) and a total social benefit of around KRW 367.2 billion (USD 310 million).
Social consensus on the necessity of EE is being formed, yet there is an inadequate supply of EE in society. This study reveals the social consensus using a countable and comparable index, providing clarity to the often-ambiguous value discussion. By classifying value based on the theoretical economic dimension, this study presents a communicable economic value and suggests an alternative way discuss the value of EE using economic principles. This study is the first empirical attempt to reveal the value of EE nationwide, and it highlights the vast social benefit of EE program from an economic perspective. Although EE has been evaluated based on its effects, outcomes, and other factors, the assigned value differs depending on the theoretical value discussion. This study monetizes the assigned value and presents it in a communicable unit, which can be useful in policy design. Therefore, this study expands the value discussion in the theoretical dimension and serves as base data for policy design.
This study also has significance for policy research. The CVM used in this study was based on the characteristics of EE itself, which is a departure from studies that have approached EE from either an environmental policy or educational policy perspective (Zachariou and Korfiatis Citation2021). Through its evaluation of citizens’ willingness to pay, our study furnishes valuable evidence that policymakers can leverage to judiciously allocate limited economic resources, enabling them to prioritize and expand EE projects. The estimated economic value of EE—accounting for both direct and indirect benefits to citizens across environmental and educational dimensions and encompassing both use and nonuse values—underscores the need for policies that foster the qualitative growth of EE. This study equips policymakers with evidence-based economic recommendations for designing and implementing policies that strategically promote the expansion and development of EE.
Overall, this study makes a valuable contribution to the discussion of the value of EE. While the value of EE has traditionally been discussed in terms of normative thinking and proxy indicators, this study offers an alternative benchmark that is grounded in economic theory and based on citizens’ willingness to pay. By providing a countable, comparable index of the value of EE, this study helps clarify the value discussion and provides policymakers with evidence to support the expansion and qualitative growth of EE programs. Furthermore, this study focuses directly on the value of EE itself, rather than approaching it from an environmental or educational policy perspective. This study has both theoretical and policy implications and can serve as a valuable resource for future research and policy design in the field of EE.
Limitations and suggestions
The implications of this study are limited by its scope and design. This section explains the study’s limitations for using the results and suggests future research directions that would expand on this study.
First, it should be noted that EE has diverse meanings, as do EE policies and programs. EE programs are organized using diverse methods and contents depending on the context. This study estimated the value of EE based on a typical program in South Korea, which can be considered a case study and not a comprehensive understanding of the value of EE. Additionally, the study’s results do not pertain to the economic value of EE as educational outcomes but rather to the value citizens assign to EE. This study has a limited meaning regarding the value of EE and highlights the need for more studies related to value. Future research should elaborate on the meaning of EE depending on policy and system, and estimate values depending on the context. The value of EE effects can also be researched based on behavioral data and educational outcomes in order to estimate the value of EE more directly. These kinds of future research can expand the value discussion beyond economic values.
Second, there is a limitation related to CVM itself. Although CVM can produce reliable results, the stated preference approach relies on hypothetical scenarios to determine respondents’ preferences. The revealed preference approach is superior for addressing this limitation. For example, many local governments in South Korea run organizations related to EE and provide EE programs, making it possible to apply travel cost methods. By comparing the results of the revealed preference methods with those of this study, a better understanding of EE value can be obtained.
Third, this study focuses on citizens’ benefits on the demand side. The hypothetical scenario presents a situation where EE is supplied or not and compares demand preferences. Future research could explore the supply side, such as value differentiation based on supply methods like public and private organizations. Furthermore, this study was conducted during a pandemic, which could have influenced citizens’ preferences. Future research should take this into consideration and investigate potential shifts in citizens’ preferences.
Last but not least, the estimations depend on the treatment of protest bidders. This study assumed protest bidders have zero WTP. This approach to managing protest responses does not violate representative sampling; however, it could underestimate WTP (Cooper, Burton, and Crase Citation2019). While the treatment this study chose has advantages and drawbacks, so do other methods (Johnston et al. Citation2017). It is important to consider the use of this method when interpreting the results of this study.
Acknowledgments
The survey was conducted with funding from the Korea Ministry of Environment (0434-20200017) and was partially supported by the Korea Environment Industry & Technology Institute (KEITI) through the Climate Change R&D Project for the New Climate Regime, funded by the Korea Ministry of Environment (2022003560007). We would like to thank Chanhee Lee, Semin Kim, and Dahye Lee for helping us carry out the survey for this study.
Disclosure statement
No potential conflict of interest is reported by the authors.
Correction Statement
This article was originally published with errors, which have now been corrected in the online version. Please see Correction (http://dx.doi.org/10.1080/13504622.2024.2332079)
Notes
1 There is a conceptual difference between environmental education as an elective subject and other forms of EE in public education. However, the same considerations apply when prioritizing either’s integration into the public education system. The contradictory survey results emphasize the gap about the importance of EE.
2 While EE programs could be offered by the private sector with participant fees, EE is predominantly provided by the public sector at primary and secondary education in South Korea. This study thus emphasizes the nonmarket aspect of EE in this context.
3 A concise history of CVM is provided in Johnston et al. (Citation2017).
4 It is called Purumi Movable EE Classroom. Purumi means the color of grass in Korean.
5 The exchange rate was KRW 1,184 per USD 1 at the time of the survey in September 2020.
6 The survey firm designed the survey so it could be taken only after participants understood and agreed to participate in the survey.
7 The sample was randomly selected based on regional considerations, leading to some demographic variance. However, respondents in this study answered questions on behalf of their households, and the analysis was conducted at the household level, making the data suitable for this study.
8 The survey was originally designed using a double-bounded dichotomous choice (DBDC) format. However, this study exclusively utilized single-bounded dichotomous choice (SBDC) data. SBDC was preferred based on its established incentive properties (Carson Flores, and Meade Citation2001; Johnston et al. Citation2017). The decision to use only SBDC data in this study poses no issue due to its unique circumstances. Respondents were unaware of the second WTP question when they responded to the first one. Consequently, the second question did not influence the incentive compatibility of the initial question, as emphasized by Johnston et al. (Citation2017).
9 The respondents (408) excluded those involved in protests and zero bidders. The 596 excluded respondents may have had different covariate characteristics. Given this, careful interpretation is warranted for both the coefficient and significance of Model II.
10 Comparing the total annual benefit of EE with other values poses a challenge due to how few studies examine the value of EE. One proxy for gauging its worth is to compare it with the budget allocated to EE in the Korean Ministry of Environment (ME). In 2020, the ME’s budget for EE was KRW 12,724 million (USD 10.7 million). The disparity between the total benefit and the ME’s budget for EE serves as an indicator of the value associated with EE.
References
- Ardoin, N. M., A. W. Bowers, and E. Gaillard. 2020. “Environmental Education Outcomes for Conservation: A Systematic Review.” Biological Conservation 241: 108224. https://doi.org/10.1016/j.biocon.2019.108224
- Ardoin, N. M., A. W. Bowers, N. W. Roth, and N. Holthuis. 2018. “Environmental Education and K-12 Student Outcomes: A Review and Analysis of Research.” The Journal of Environmental Education 49 (1): 1–17. https://doi.org/10.1080/00958964.2017.1366155
- Arrow, K., R. Solow, P. R. Portney, E. E. Leamer, R. Radner, and H. Schuman. 1993. “Report of the NOAA Panel on Contingent Valuation.” Federal Register 58 (10): 4601–4614.
- Bastien-Olvera, B. A., and F. C. Moore. 2020. “Use and Non-Use Value of Nature and the Social Cost of Carbon.” Nature Sustainability 4 (2): 101–108. https://doi.org/10.1038/s41893-020-00615-0
- Blomquist, G. C., P. A. Coomes, C. Jepsen, B. C. Koford, and K. R. Troske. 2014. “Estimating the Social Value of Higher Education: Willingness to Pay for Community and Technical Colleges.” Journal of Benefit-Cost Analysis 5 (1): 3–41. https://doi.org/10.1515/jbca-2013-0009
- Boyle, K. J. 2017. “Contingent Valuation in Practice.” In A Primer on Non-Market Valuation, 83–132. Dordrecht: Springer.
- Brown, T. C. 1984. “The Concept of Value in Resource Allocation.” Land Economics 60 (3): 231–246. https://doi.org/10.2307/3146184
- Cameron, T. A., and J. Quiggin. 1994. “Estimation Using Contingent Valuation Data from a" Dichotomous Choice with Follow-up" Questionnaire.” Journal of Environmental Economics and Management 27 (3): 218–234. https://doi.org/10.1006/jeem.1994.1035
- Carneiro, D. Q., and A. R. Carvalho. 2014. “Payment Vehicle as an Instrument to Elicit Economic Demand for Conservation.” Ocean & Coastal Management 93: 1–6. https://doi.org/10.1016/j.ocecoaman.2014.03.002
- Carson, R. T. 2012. “Contingent Valuation: A Practical Alternative When Prices Aren’t Available.” Journal of Economic Perspectives 26 (4): 27–42. https://doi.org/10.1257/jep.26.4.27
- Carson, R. T., N. E. Flores, and N. F. Meade. 2001. “Contingent Valuation: Controversies and Evidence.” Environmental and Resource Economics 19 (2): 173–210. https://doi.org/10.1023/A:1011128332243
- Cha, J. H., J. Lee, T. Kim, and K. Chang. 2019. “Value of College Athletic Programmes in the Korean Higher Education: A Contingent Valuation Study. Higher Education.”
- Cheng, X., S. Van Damme, L. Li, and P. Uyttenhove. 2019. “Evaluation of Cultural Ecosystem Services: A Review of Methods.” Ecosystem Services 37: 100925. https://doi.org/10.1016/j.ecoser.2019.100925
- Choi, A. S. 2015. “An Experimental Study to Explore WTP for Aviation Carbon Offsets: The Impact of a Carbon Tax on the Voluntary Action.” Journal of Environmental Planning and Management 58 (9): 1617–1634. https://doi.org/10.1080/09640568.2014.940515
- Choi, B. Y., J. H. Lee, A. Kim, B. Kim, D. Cho, and S. M. Lee. 2013. “The Economic Value of Career Counseling Services for College Students in South Korea.” The Career Development Quarterly 61 (2): 168–178. https://doi.org/10.1002/j.2161-0045.2013.00045.x
- Chu, X., J. Zhan, C. Wang, S. Hameeda, and X. Wang. 2020. “Households’ Willingness to Accept Improved Ecosystem Services and Influencing Factors: Application of Contingent Valuation Method in Bashang Plateau, Hebei Province, China.” Journal of Environmental Management 255: 109925. https://doi.org/10.1016/j.jenvman.2019.109925
- Cooper, B., M. Burton, and L. Crase. 2019. “Willingness to Pay to Avoid Water Restrictions in Australia under a Changing Climate.” Environmental and Resource Economics 72 (3): 823–847. https://doi.org/10.1007/s10640-018-0228-x
- Eom, Young Sook and Jong Ho Hong. 2009. “Identification and Correction of Protest Responses in the Willingness-to-Pay Estimation for Public Project Feasibility Analysis.” Korean Journal of Public Finance 2 (4): 89–117. [in Korean]
- Eom, Young Sook, Oh-Sang Kwon, and Youngchul Shin. 2011. “Issuesin Applycing CV Methods to the Preliminary Feasibility Test.” Environmental and Resource Economics Review 20 (3): 595–628. [in Korean]
- Freeman, A. M.III., J. A. Herriges, and C. L. Kling. 2014. The Measurement of Environmental and Resource Values: Theory and Methods. London: Routledge.
- Gyrd-Hansen, D. 2016. “The Role of the Payment Vehicle in Non-Market Valuations of a Health Care Service: Willingness-to-Pay for an Ambulance Helicopter Service.” Health Economics, Policy, and Law 11 (1): 1–16. https://doi.org/10.1017/S1744133115000018
- Haab, T. C., and K. E. McConnell. 2002. Valuing Environmental and Natural Resources: The Econometrics of Non-Market Valuation. Cheltenham, UK / Northamption, USA: Edward Elgar.
- Hanemann, W. M. 1984. “Welfare Evaluations in Contingent Valuation Experiments with Discrete Responses.” American Journal of Agricultural Economics 66 (3): 332–341. https://doi.org/10.2307/1240800
- Hanemann, Michael, John Loomis, and Barbara Kanninen. 1991. “Statistical Efficiency of Double-Bounded Dichotomous Choice Contingent Valuation.” American Journal of Agricultural Economics 73 (4): 1255–1263. https://doi.org/10.2307/1242453
- Hollweg, K. S., J. R. Taylor, R. W. Bybee, T. J. Marcinkowski, W. C. McBeth, and P. Zoido. 2011. Developing a Framework for Assessing Environmental Literacy. Washington, D.C.: North American Association for Environmental Education.
- Holmes, T. P., W. L. Adamowicz, and F. Carlsson. 2017. “Choice Experiments.” In A Primer on Nonmarket Valuation, 133–186. Dordrecht: Springer.
- Im, Sohyun, Byungyoung Park, Junseong Hwang, Seungju Baek, Hyeja Kim, Jeongwoo Lee, and Seongyeol Kim. 2020. “Kedi Poll 2020.” Jincheon: Korean Educationl Development Institute. [in Korean]
- IPCC, 2021. Summary for Policymakers. In: Climate Change 2021: The Physical Science Basis. Contribution of Working Group I to the Sixth Assessment Report of the Intergovernmental Panel on Climate Change, edited by MassonDelmotte, V., P. Zhai, A. Pirani, S.L. Connors, C. Péan, S. Berger, N. Caud, Y. Chen, L. Goldfarb, M.I. Gomis, M. Huang, K. Leitzell, E. Lonnoy, J.B.R. Matthews, T.K. Maycock, T. Waterfield, O. Yelekçi, R. Yu, and B. Zhou, 3–32. Cambridge, United Kingdom and New York, NY, USA: Cambridge University Press. https://doi.org/10.1017/9781009157896.001
- Ivehammar, P. 2009. “The Payment Vehicle Used in CV Studies of Environmental Goods Does Matter.” Journal of Agricultural and Resource Economics 34 (3): 450–463.
- Johnston, Robert J., Kevin J. Boyle, Wiktor (Vic) Adamowicz, Jeff Bennett, Roy Brouwer, Trudy Ann Cameron, W. Michael Hanemann, et al. 2017. “Contemporary Guidance for Stated Preference Studies.” Journal of the Association of Environmental and Resource Economists 4 (2): 319–405. https://doi.org/10.1086/691697
- Jones, B. A., J. Ripberger, H. Jenkins-Smith, and C. Silva. 2017. “Estimating Willingness to Pay for Greenhouse Gas Emission Reductions Provided by Hydropower Using the Contingent Valuation Method.” Energy Policy 111: 362–370. https://doi.org/10.1016/j.enpol.2017.09.004
- Kang, J., and J. H. Hong. 2021. “Framing Effect of Environmental Cost Information on Environmental Awareness among High School Students.” Environmental Education Research 27 (6): 936–953. https://doi.org/10.1080/13504622.2021.1928607
- Kang, Jinyoung, Hyangon Chun, Miri Nam, and Jongho Hong. 2021. “Reconsidering the Value of Environmental Education from the Viewpoint of Metapraxis.” The Korean Journal of Philosophy of Education 43 (2): 1–26. [in Korean] https://doi.org/10.15754/jkpe.2021.43.2.001
- Kenter, Jasper O., Christopher M. Raymond, Carena J. van Riper, Elaine Azzopardi, Michelle R. Brear, Fulvia Calcagni, Ian Christie, et al. 2019. “Loving the Mess: Navigating Diversity and Conflict in Social Values for Sustainability.” Sustainability Science 14 (5): 1439–1461. https://doi.org/10.1007/s11625-019-00726-4
- Kim, H., N., H., C. Jeon, and H., L. Lee. 2020. An Integrated Assessment to Environmental Valuation via Impact Pathway Analysis: Public Attitudes towards the Environment: 2020 Survey. Sejong: Korea Environmental Institute. [in Korean]
- Krasny, M. E. 2020. Advancing Environmental Education Practice. Ithaca, New York: Cornell University Press.
- Lee, C. K., J. H. Lee, J. W. Mjelde, D. Scott, and T. K. Kim. 2009. “Assessing the Economic Value of a Public Birdwatching Interpretative Service Using a Contingent Valuation Method.” International Journal of Tourism Research 11 (6): 583–593. https://doi.org/10.1002/jtr.730
- Lee, Du Gon. 2016. “Proposal of Establishing a National Environmental Education System of Korea.” Environmental Studies Education Research 20: 41–60. [in Korean]
- McFadden, D. 1974. “Conditional Logit Analysis of Qualitative Choice Behavior.” In Frontiers in Econometrics, edited by P. Zarembka, 105–142. New York: Academic Press.
- Ministry of Education. 2021. “A Main Points of 2022 Revision Curriculum General Introduction[Draft] [in Korean].”
- Monroe, M. C., R. R. Plate, A. Oxarart, A. Bowers, and W. A. Chaves. 2019. “Identifying Effective Climate Change Education Strategies: A Systematic Review of the Research.” Environmental Education Research 25 (6): 791–812. https://doi.org/10.1080/13504622.2017.1360842
- More, T. A., J. R. Averill, and T. H. Stevens. 1996. “Values and Economics in Environmental Management: A Perspective and Critique.” Journal of Environmental Management 48 (4): 397–409. https://doi.org/10.1006/jema.1996.0086
- Naime, J., F. Mora, M. Sánchez-Martínez, F. Arreola, and P. Balvanera. 2020. “Economic Valuation of Ecosystem Services from Secondary Tropical Forests: Trade-Offs and Implications for Policy Making.” Forest Ecology and Management 473: 118294. https://doi.org/10.1016/j.foreco.2020.118294
- National Research Council. 2005. Valuing Ecosystem Services: Toward Better Environmental Decision-Making. Washington, DC: The National Academies Press. https://doi.org/10.17226/11139
- OECD. 2018. The Future of Education and Skills: Education 2030. Position Paper.
- Ostrom, V.O., and Ostrom, E. 1977. “Public Goods and Public Choices.” In Alternatives for Delivering Public Services: Toward Improved Performance, 7–49. Boulder, CO: Westview Press.
- Parsons, G. R. 2017. “Travel Cost Models.” In A Primer on Non-Market Valuation, 187–233. Dordrecht: Springer.
- Perman, R., Y. Ma, J. McGilvray, M. Common, and D. Maddison. 2011. Natural Resource and Environmental Economics. New Jersey: Pearson Education.
- Pham, T. D., N. Kaida, K. Yoshino, X. H. Nguyen, H. T. Nguyen, and D. T. Bui. 2018. “Willingness to Pay for Mangrove Restoration in the Context of Climate Change in the Cat Ba Biosphere Reserve, Vietnam.” Ocean & Coastal Management 163: 269–277. https://doi.org/10.1016/j.ocecoaman.2018.07.005
- Portney, P. R. 1994. “The Contingent Valuation Debate: Why Economists Should Care.” Journal of Economic Perspectives 8 (4): 3–17. https://doi.org/10.1257/jep.8.4.3
- Ripple, W. J., C. Wolf, T. M. Newsome, P. Barnard, W. R. Moomaw, B. Maas, and B. E. Law. 2020. “The Climate Emergency, Forests, and Transformative Change.” BioScience 70 (6): 446–447. https://doi.org/10.1093/biosci/biaa032
- Rokeach, M. 1973. The Nature of Human Values. New York: Free press.
- Rotaris, L., and R. Danielis. 2019. “The Willingness to Pay for a Carbon Tax in Italy.” Transportation Research Part D: Transport and Environment 67: 659–673. https://doi.org/10.1016/j.trd.2019.01.001
- Schroeder, H. 2013. “Sensing Value in Place.” In Place-Based Conservation: Perspectives from the Social Sciences, 73–87. Dordrecht: Springer.
- Segerson, K. 2017. “Valuing Environmental Goods and Services: An Economic Perspective.” In A Primer on Non-Market Valuation, 1–25. Dordrecht: Springer.
- Seo, Y. S., H. S. Ryu, J. B. Jung, H. J. Choi, H. J. Lee, J. S. Lee, S. H. Ahn, et al. 2011. “Conditions for Sustainable Development of Future Generations: A Virtuous Cycle of Growth, Environment, and Welfare.” Future Society Collaboration Research Series, Seoul: National Research Council & Korea Institute of Public Administration. [in Korean]
- Shah, S. A., D. L. Hoag, and J. Loomis. 2017. “Is Willingness to Pay for Freshwater Quality Improvement in Pakistan Affected by Payment Vehicle? Donations, Mandatory Government Payments, or Donations to NGO’s.” Environmental Economics and Policy Studies 19 (4): 807–818. https://doi.org/10.1007/s10018-016-0178-x
- Statistics Korea. 2019. “Census.”
- Stern, M. J., R. B. Powell, and D. Hill. 2014. “Environmental Education Program Evaluation in the New Millennium: What Do we Measure and What Have we Learned?” Environmental Education Research 20 (5): 581–611. https://doi.org/10.1080/13504622.2013.838749
- Strazzera, E., R. Scarpa, P. Calia, G. D. Garrod, and K. G. Willis. 2003. “Modeling Zero Values and Protest Responses in Contingent Valuation Surveys.” Applied Economics 35 (2): 133–138. https://doi.org/10.1080/0003684022000015900
- Taylor, L. O. 2017. Hedonics. In a Primer on Non-Market Valuation, 235–292. Dordrecht: Springer.
- Thøgersen, J., and T. Crompton. 2009. “Simple and Painless? The Limitations of Spillover in Environmental Campaigning.” Journal of Consumer Policy 32 (2): 141–163. https://doi.org/10.1007/s10603-009-9101-1
- Thøgersen, J., and C. Noblet. 2012. “Does Green Consumerism Increase the Acceptance of Wind Power?” Energy Policy 51: 854–862. https://doi.org/10.1016/j.enpol.2012.09.044
- Wang, Z., Y. Gong, and X. Mao. 2018. “Exploring the Value of Overseas Biodiversity to Chinese Netizens Based on Willingness to Pay for the African Elephants’ Protection.” The Science of the Total Environment 637–638: 600–608. https://doi.org/10.1016/j.scitotenv.2018.04.417
- WWF. 2018. “Living Planet Report - 2018: Aiming Higher.” Edited by Grooten, M. and Almond, R. E. A. Gland: WWF.
- Yang, J., L. Zou, T. Lin, Y. Wu, and H. Wang. 2014. “Public Willingness to Pay for CO2 Mitigation and the Determinants under Climate Change: A Case Study of Suzhou, China.” Journal of Environmental Management 146: 1–8. https://doi.org/10.1016/j.jenvman.2014.07.015
- Yoo, S. H., and S. Y. Kwak. 2009. “Willingness to Pay for Green Electricity in Korea: A Contingent Valuation Study.” Energy Policy 37 (12): 5408–5416. https://doi.org/10.1016/j.enpol.2009.07.062
- Zachariou, A., and K. Korfiatis. 2021. “Sustainability Education Research and Policy in Cyprus: An Investigation into Their Roles and Relationships.” Environmental Education Research 27 (4): 614–629. https://doi.org/10.1080/13504622.2020.1863919
Appendix 1.
Contingent commodity explanation and questionnaire
The Korean Ministry of Environment operates the Green Movable EE Classroom, an experiential mobile environment classroom taken to schools and other learning locations on large remodeled buses. There are three teachers per vehicle, all of them environmental education majors. The educational content covers the overall environment, such as ecosystems, atmosphere, resource circulation, climate change, and energy. The program uses experiments, games, and observations and teaches coding-related classes so children can simultaneously have fun and be interested. A variety of educational programs are available for elementary and middle school students; depending on the program, they are held twice a week for 45 min for 4–8 weeks. In 2019, the program was held 900 times, and 22,000 students participated. This program helps students develop ecofriendly lifestyles by establishing environmental conservation values, fostering environmental attitudes, and providing experience-oriented education.
*This explanation was presented with photos in the main survey to help the respondents understand.
Q1. Imagine the Ministry of Environment is dealing with budget constraints and requires additional funding to support the Green Moveable EE Classroom. Would you be willing to contribute to a fund established for the Green Moveable EE Classroom?
Please consider that you are responding on behalf of your household, and keep in mind that your household’s income is limited, with various expenses to cover.
① Willing to contribute to the fund.
② Not willing to contribute to the fund.
Q1-1. Would you be willing to contribute to the fund annually if the amount were KRW (10,000/30,000/50,000)?
① Willing to contribute to the fund.
② Not willing to contribute to the fund.
Appendix 2
Table A1. Descriptive statistics of demographic factors.