
Abstract
Using the recently developed linearity test and nonlinear unit root test, this study shows that the income gaps of Finland, Norway and Sweden with respect to Denmark are nonlinear but stationary with no significant trend effect, implying the Nordic countries have already attained steady state of income equality, a state beyond catching up as identified earlier in Oxley and Gresley (Citation1999). This fresh evidence strengthens the finding of Nordic Convergence Club by these authors.
Notes
1 Available at http://www.bized.ac.uk/dataserv/penndata/penn.htm [Accessed on: 10 March 2006].
2 Based on the same principle, Sweden is regarded as leader of the Nordic countries in Oxley and Greasley (Citation1999), which examine sample period from 1900 to 1987. Notably, long-run convergence, catching-up and divergence have been identified, respectively, in the case of Denmark, Finland and Norway as compared to Sweden in this study. This inclusion of all the three possibilities in the income convergence study makes Nordic countries an interesting avenue of study. In particular, the current study allows one to know the progress of these countries from the perspective of income convergence after some 13 years had passed.
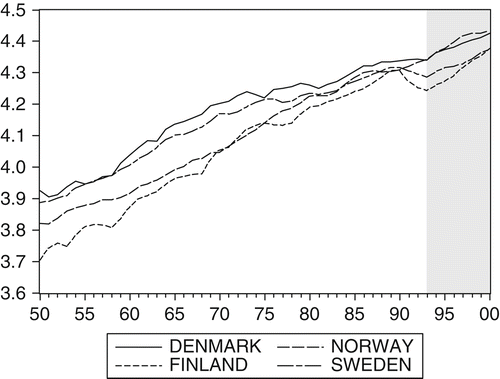
Fig. 1. Logarithm of real GDP per capital for Nordic Countries
3 Nonetheless, out of curiosity, few commonly applied linear tests are performed and the results may be summarized as follows: Augmented Dickey–Fuller and Phillip–Perron tests provide evidence of catching-up in Sweden and income divergence in Finland and Norway. On the other hand, KPSS test suggests catching-up, whereas Ng and Perron test suggest income divergence in all cases. Remarkably, none of these results show any indication of long-run convergence. For robustness, however, inference from this study should not be drawn from these linear tests results.
4 All p-values in this study are computed from 4999 bootstrapped series.