
Abstract
This article investigates the impact of sales tax on economic growth in the United States during the 1960–2013 period using the autoregressive distributed lag bounds testing approach of cointegration. We estimate the long- and short-run elastic coefficients of sales tax on growth and find that economic growth in the United States responds negatively to sales tax in the long run, although it produces positive effects in the short run.
I. Introduction
Recently, many academics and policy makers have emphasized the relationship between taxation and economic growth. For instance, Dalamagas (Citation2003) provided a quantitative evaluation of the relationship between tax polices, growth and tax revenue in an econometric framework. Mamatzakis (Citation2005) analysed the dynamic responses of growth to tax structure in Greece and noted that output growth responded negatively to an increased tax burden, but a tax mix produced a positive impact. Stallmann and Deller (Citation2010) explored the effects of local and state tax and expenditure limitations (TELs) on economic growth in the United States and found that TELs had no significant effects. Whalley and Zhao (Citation2013) investigated the influence of China’s stimulus package and tax stabilization efforts in response to the 2008 financial crisis and concluded that the tax resulted in more contributions than expenditures during the period investigated.
In those studies, governmental tax was considered an important factor that affects economic growth. Nonetheless, there has been insufficient research on the effects of sales tax. The sales tax is an important taxation scheme that is popular in the United States. In a sales tax scheme, the customer pays sales tax when making almost any purchase. Its influence must be investigated thoroughly to inform US policy makers as well as to be instructive for other countries’ policy makers to some extent.
II. Data and Methodology
This study investigates the 1960–2013 period in the United States and examines GDP and sales tax (thousand millions of dollars), employing annual data from the BEA in the US Department of Commerce. We choose the annual per cent change in GDP as our indicator of economic growth (EG), and we attempt to find the received impact on EG from sales tax (STax), as shown in Equation 1.
where EGt = (GDPt /GDPt–1–1) ×100, t denotes the year.
We adopt the autoregressive distributed lag (ARDL) bounds testing approach of cointegration developed by Pesaran et al. (Citation2001) to examine that nexus. The ARDL approach has several advantages, including the following: (1) the underlying regressors are not restrictive irrespective of pure I(0), pure I(1) or mutual cointegration; (2) both long- and short-run relationships are easy to investigate and applicable to the type of investigation in the ARDL approach and (3) cointegration in small samples is more fitful to determine (Brahmasrene and Jiranyakul, Citation2009; Lamotte et al., Citation2013).
The ARDL procedure involves two stages (Pesaran and Pesaran, Citation2009, p. 317). In the first stage, a conditional error-correction model (ECM) is constructed to examine the long-run relationship through an F-test, which is shown in Equation 2:
where p denotes the lag;
C is the intercept;
d is the difference operator;
t denotes the year;
εt ∈(0, σ2), is white noise;
πEG, πST, ψ’ and ω are coefficients;
Zt = (EGt, STaxt)’.
The null hypothesis is the following: H0 – πEG = πST = 0. The computed F-statistic for cointegration is denoted F(EG/STax). Pesaran et al. (Citation2001) tabulates two sets of critical values: I(0) and I(1). If the F-statistic lies below the lower bound I(0), the null hypothesis H0 cannot be rejected, which means that there is no cointegration in the levels between the included variables. Otherwise, if the F-statistic exceeds the upper bound I(1), H0 can be rejected, and there is a relationship in the levels or cointegration for the variables in the long run. If the F-statistic falls between I(0) and I(1) as bounds, the inference cannot be conclusive.
If the cointegration between EG and STax is tested with evidence, the ARDL model with optimal lags is determined at the second stage after searching (p + 1)1+1 ARDL models, according to the AIC or Schwarz Bayesian criterion (SIC), which is shown in Equation 3:
where
L is the lag operator such that LiSTax = STaxt-i. In the long run, we have EGt = EGt–1 = … = EGt–p0; STaxt = STaxt–1 = … = STaxt–q1. Thus, the long-run equation can be obtained as follows (Equation 4):
where
At this point, the short-run dynamic equation with an error-correction term can also be written as follows (Equation 5):
where ecmt = EGt – Const – β· STaxt.
Thus, through the long-run coefficients, we can see the contribution of STax to EG. Furthermore, the speed of adjustment can also be shown clearly in the dynamic short-run model such that the error-correction term ecm should be statistically significant and negative.
III. Empirical Results
In the ARDL bounds test, the variables are required as I(0) or I(1), or else the result may be spurious. We adopt the ADF to determine the difference levels of EG and STax and find that they are I(0) and I(1), respectively. Thus, we compute F-statistics to test the long-run relationship in which the maximum lag length p is 2 in the ECM. The results for the bounds for the F-test in Equation 2 are shown in .
Table 1. Results for the bounds of the F-test
Hence, the underling ARDL model can be established to determine the long-run slope-estimated coefficients and the short-run dynamic-estimated coefficients. The ARDL(1,1) is selected based on SIC, and the estimated results are shown in .
Table 2. The long- and short-run ARDL relationships
The empirical results are satisfactory. The F-stat F(2,48) is 28.0835, and the probability of the null hypothesis for no significance in that regression is [0.000]. The DW-statistic (d) is 1.9058. Because both d and (4–d) > dU,0.01(1.45), there is no statistical evidence that the error terms are positively or negatively autocorrelated (Durbin and Watson, Citation1950, Citation1951). Furthermore, the T-ratios for those regressors are also meaningful, and their probabilities are below α(0.01). Thus, the null hypothesis βi = 0 is rejected, and those regressors are significant even at a confidence level of 99%.
Thus, the long- and short-run ARDL relationships are estimated clearly. The long-run elasticity of STax contributing to EG is −0.018963 for the United States from 1960 to the present. Thus, we show that STax has a negative effect on EG in the long run. However, in the short run, the coefficient of the regressor dSTax on the dependent variable dEG is 0.14109 and is positive, which means that an increase in the sales tax can push economic growth in the short term, which is different from the long-run effects of a sales tax. The equilibrium error-correction coefficient ecm(−1) is −0.73793, which has the expected negative sign. Its T-ratio is −6.4794, and the probability of the null hypothesis being true for zero is [0.000], which is significant even when α = 0.01. Thus, it can also be concluded that the adjustment is quite meaningful in the short-run ARDL relationship.
IV. CUSUM and CUSUMSQ Tests
To further confirm the stability of the estimated ARDL model, we use the cumulative sum (CUSUM) and the cumulative sum of squares (CUSUMSQ) test method to examine the recursive residuals, which are shown in and .
Fig. 1. CUSUM of recursive residuals
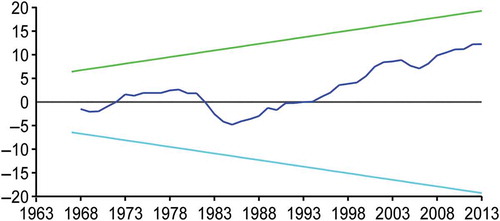
Fig. 2. CUSUMSQ of recursive residuals
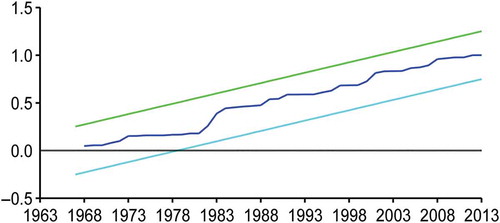
The straight lines represent the critical bounds at the 5% significance level. When the CUSUM and CUSUMSQ of the recursive residuals move outside of these two straight lines, the null hypothesis of instability is accepted. However, both the CUSUM and CUSUMSQ remain within the area restricted by the lines; thus, the estimated ARDL model is effective with stable recursive residuals.
V. Conclusion
This article has explored the impact of sales tax on economic growth in the United States during the 1960–2013 period. The novel feature of this study is to investigate the influence of sales tax, and we determined its long- and short-run relationships with growth. We show that economic growth in the United States responds negatively to sales tax in the long run, although sales tax does produce positive effects in the short run. The long-run slope coefficient is −0.018963, the short-run dynamic coefficient is 0.14109 and the speed of adjustment is −0.73793. The estimated ARDL model is effective even with the regressors at significant levels and with stable recursive residuals. The results should be helpful for policy makers in the United States and instructive for policy makers in other countries to some extent.
Acknowledgements
The authors would like to thank their peer reviewers for commenting on this article.
Additional information
Funding
References
- Brahmasrene, T. and Jiranyakul, K. (2009) Capital mobility in Asia: evidence from bounds testing of cointegration between savings and investment, Journal of the Asia Pacific Economy, 14, 262–9. doi:10.1080/13547860902975077
- Dalamagas, B. (2003) Tax rate changes and fiscal deficits: an empirical investigation, Applied Economics Letters, 10, 3–7. doi:10.1080/13504850210165865
- Durbin, J. and Watson, G. S. (1950) Testing for serial correlation in least squares regression, I, Biometrika, 37, 409–28. doi:10.1093/biomet/37.3-4.409
- Durbin, J. and Watson, G. S. (1951) Testing for serial correlation in least squares regression, II, Biometrika, 38, 159–78. doi:10.1093/biomet/38.1-2.159
- Lamotte, O., Porcher, T., Schalck, C. et al. (2013) Asymmetric gasoline price responses in France, Applied Economics Letters, 20, 457–61. doi:10.1080/13504851.2012.714063
- Mamatzakis, E. C. (2005) The dynamic responses of growth to tax structure for Greece, Applied Economics Letters, 12, 177–80. doi:10.1080/1350485042000318420
- Pesaran, B. and Pesaran, M. H. (2009) Time Series Econometrics: Using Microfit 5.0, Oxford University Press, Oxford.
- Pesaran, M. H., Shin, Y. and Smith, R. J. (2001) Bounds testing approaches to the analysis of level relationships, Journal of Applied Econometrics, 16, 289–326. doi:10.1002/jae.616
- Stallmann, J. I. and Deller, S. (2010) Impacts of local and state tax and expenditure limits on economic growth, Applied Economics Letters, 17, 645–8. doi:10.1080/13504850802297954
- Whalley, J. and Zhao, X. (2013) The relative importance of the Chinese stimulus package and tax stabilization during the 2008 financial crisis, Applied Economics Letters, 20, 682–6. doi:10.1080/13504851.2012.730128
