
 ?Mathematical formulae have been encoded as MathML and are displayed in this HTML version using MathJax in order to improve their display. Uncheck the box to turn MathJax off. This feature requires Javascript. Click on a formula to zoom.
ABSTRACT
This experimental article helps to understand the motives behind cooperation in the prisoner’s dilemma. It manipulates the pay-off in case both players defect in a two-player, one-shot prisoner’s dilemma and explains the degree of cooperation by a combination of four motives: efficiency, conditional cooperation, fear and greed. All motives are significant but some become only significant if one controls for all remaining ones. This seems to be the reason why earlier attempts at explaining choices in the prisoner’s dilemma with personality have not been successful.
I. Introduction
Many experimental economists have become sceptical about models that assume individuals to hold stable social preferences. Seemingly, effects vary across situations. In this article, we revisit the issue, focusing on a particularly involved game (the prisoner’s dilemma) to put the claim to the hardest test. We show that experimental participants interpret the prisoner’s dilemma as a game of identifiable, multiple, interconnected motives. Seemingly, earlier attempts have failed since they have not controlled for idiosyncratic beliefs about the cooperativeness of others.
Specifically, we consider efficiency (we vary gains from cooperation by manipulating pay-offs), conditional cooperation (we measure beliefs about the cooperativeness of others), fear (we measure loss aversion: Gächter, Johnson, and Herrmann Citation2007 and risk aversion: Holt and Laury Citation2002) and greed (we measure generosity in a modified dictator game). When controlling for the remaining motives, all have a significant effect. In line with differential psychology, personality traits turn out consistent only conditional on situation (Ross and Nisbett Citation1991).
II. Earlier results
For decades, prisoner’s dilemma games have been tested in the lab (for an overview, see Colman Citation1995; Sally Citation1995). Many participants cooperate, and hence violate the theoretical prediction.
Several papers explored how behaviour reacts to changes in pay-offs. We use the labels introduced by Rapoport and Chammah (Citation1965). In , R stands for the reward from successful cooperation, S is the sucker pay-off, T the temptation pay-off and P signifies punishment (for defection).
Table 1. Generalized representation of a two-person two-action prisoner’s dilemma.
The closest analogue to our game is Rapoport and Chammah (Citation1965). They too vary P and find that there is the more cooperation, the lower P (see also Ahn et al. (Citation2001), Steele and Tedeschi (Citation1967), Vlaev and Chater (Citation2006)).
Previous attempts at explaining choices in the prisoner’s dilemma with behaviour in other tests have not been too encouraging. Dolbear and Lave (Citation1966) do not find a connection with participants’ risk preferences. In Swope et al. (Citation2008), a personality test turns out insignificant. Boone, De Brabander, and Van Witteloostuijn (Citation1999) do not find an effect of locus of control, self-monitoring, aggressiveness and sensation seeking. Brosig, Riechmann, and Weimann (Citation2007), Blanco, Engelmann, and Normann (Citation2011) and Dreber, Fudenberg, and Rand (Citation2014) find little consistency between a prisoner’s dilemma and a dictator game. Yet, Kramer, McClintock, and Messick (Citation1986), McClintock and Liebrand (Citation1988) and Boone, Weimann, and Kiyonari (Citation2010) significantly explain choices in the prisoner’s dilemma with social value orientation scores. Dariel and Nikiforakis (Citation2014) find that cooperators in the public-good game tend to reciprocate higher wages in the gift-exchange game with higher levels of effort.
We believe that the rather sobering earlier findings are due to the fact that the prisoner’s dilemma is a game of multiple, interrelated motives. Specifically, we believe that conditional cooperation is key. Therefore, it is critical to also measure beliefs.
III. Method
Prisoner’s dilemma
Subjects play a simultaneous, two-person, one-shot prisoner’s dilemma game. We hold ,
and
constant. Using the strategy method (Selten Citation1967), we vary
, in the interval
, in 10 steps:
, for
. Participants are randomly matched to a partner after they have made all choices. One problem is randomly selected to be pay-off-relevant.
We choose these parameters to test whether cooperativeness is disproportionately more pronounced if a cooperator has little to lose (small ), or if gains from cooperation are large (large
). If
, cooperation is ‘free of charge’ – but due to
, the defection incentive is present. Conversely, if
, there are no gains from cooperation, but a cooperative move entails the risk of exploitation.
Explanatory variables
Gains from cooperation measure efficiency. The smaller the
, the more cooperation is efficient.
To measure optimism, participants are asked how many of the 24 participants in their session they believe to cooperate when .Footnote1
Correct guesses are rewarded
; a guess that is the true number
earns the participant
. We translate this estimate into percentage.
To measure fear, we conduct the Gächter, Johnson, and Herrmann (Citation2007) testFootnote2 for the λ-value of prospect theory for loss aversion, and the Holt and Laury (Citation2002) testFootnote3 for relative risk aversion.
We measure greed with a risky dictator game. Each participant chooses between two situations: in situation 1, both the dictator and the recipient get . In situation 2, the dictator has a chance of
to get
rather than
, but the recipient gets nothing. Using the strategy method (Selten Citation1967), we vary
in 10 equal steps of
. Ex post participants are randomly assigned to be dictators or recipients. One problem is randomly selected to be pay-off-relevant. The switching pointFootnote4
is transformed into β-values of the Fehr and Schmidt (Citation1999) model.
Procedure
The sequence was as follows: prisoner’s dilemma, belief elicitation, loss aversion test, dictator game and risk aversion test. There was no feedback before the end of the experiment. All parts of the experiment were pay-off-relevant. To guarantee positive earnings, we announced a minimum payment of . It became effective for 11 participants.
The experiment was programmed in z-Tree (Fischbacher Citation2007) and conducted at the Bonn Econ Lab. Sessions lasted approximately 90 minutes. Subjects were recruited with the software ORSEE (Greiner Citation2015). A total of 96 students of various majors participated. Mean age was 24.81 years; 61.46% were female. Participants on average earned . Instructions are available in the supplementary data.
IV. Results
Prisoner’s dilemma choices
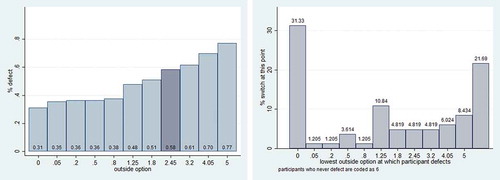
The defection rate monotonically increases in P ((a)). Exploiting that 84 (87.5%) of our participants behave consistently, we compress results into one continuous variable, the switching point. It is higher the more a participant is cooperative ((b)).Footnote5
Figure 1. Choices in the prisoner’s dilemma. (a) Effect of safety pay-off P on defection; beliefs are elicited for the shaded pay-off (). (b) Switching points in the prisoner’s dilemma.
Explaining choices
Since many switching points are at either extreme, a Tobit model is appropriate ().Footnote6
Table 2. Explaining switching points by motives.
Gains from cooperation have a significant positive effect (Model 1).Footnote7 Optimism increases cooperation significantly (Model 2).Footnote8 Yet neither loss aversion alone (Model 3),Footnote9 nor relative risk aversion alone (Model 4),Footnote10 nor inequity aversion alone (Model 5) are significant.
If we include all explanatory variables (Model 6), inequity aversion is significant as well. The more participants are generous in the dictator game (the higher their β), the less they cooperate in the prisoner’s dilemma. This might seem counterintuitive. Yet, for most individuals, (cf., Blanco, Engelmann, and Normann Citation2011). They are averse not only against exploiting others (
), but also against being exploited themselves (
), and both are correlated. Choosing the selfish option in the prisoner’s dilemma protects the player against exploitation. Thus, the negative coefficient of
suggests subjects’ general sensitivity to inequity.
If we further interact loss and risk aversion (Model 7), both the main and the interaction effects become significant. This is due to the fact that risk and loss aversion are negatively correlated (Spearman’s rho: rS = .3452, p = .0009) (cf., Novemsky and Kahneman Citation2005). Note that our final model explains more than 60% of the variance.
Adding demographic controls (Model 8) has little effect.
V. Conclusion
Since the 1960s, many researchers have experimentally tested in which way and in which magnitude manipulations of pay-offs in a prisoner’s dilemma affect behaviour. Our main contribution is to show why previous experiments have seemingly had such a hard time finding the behavioural causes. For conditional cooperators, a prisoner’s dilemma is a complicated game of multiple motives. Yet, if one simultaneously controls for all of them, one is able to identify this mixture. Our results suggest that participants sense a trade-off: cooperation may pay; but is the risk worth taking?
RAEL_A_1139672_Supplementary_data.docx
Download MS Word (71 KB)Disclosure statement
No potential conflict of interest was reported by the authors.
Supplemental data for this article can be accessed here.
Notes
1 From pre-tests, we find that this is approximately the empirical mean of switching points.
2 Almost all participants are consistent.
3 Ninety-two (95.83%) participants are consistent.
4 One participant is inconsistent.
5 Only data from consistent participants are used. We drop one datapoint from a participant switching in the opposite direction.
6 The results look qualitatively similar if we estimate a random effects logit model that explains choices on individual problems.
7 Note that gains from cooperation are not endogenous. Switching points compress choices. We explain choices with (expected) gains from cooperation. At a participant’s switching point, the expected gain from cooperation is given by the sum of gains from all games up to this point, divided by 11.
8 58% cooperate, the mean belief is 59.81%.
9 In the regressions, results look very similar if we do not transform variables, but directly work with the switching points for loss aversion, risk aversion and the dictator game.
10 We lose two observations for participants who are inconsistent on the test for risk aversion.
References
- Ahn, T. K., E. Ostrom, D. Schmidt, R. Shupp, and J. Walker. 2001. “Cooperation in PD games. Fear, Greed, and History of Play.” Public Choice 106: 137–155. doi:10.1023/A:1005219123532.
- Blanco, M., D. Engelmann, and H. T. Normann. 2011. “A Within-Subject Analysis of Other-Regarding Preferences.” Games and Economic Behavior 72: 321–338. doi:10.1016/j.geb.2010.09.008.
- Boone, C., B. De Brabander, and A. Van Witteloostuijn. 1999. “The Impact of Personality on Behavior in Five Prisoner’s Dilemma Games.” Journal of Economic Psychology 20 (3): 343–377. doi:10.1016/S0167-4870(99)00012-4.
- Boone, C., C. Declerck, and T. Kiyonari. 2010. “Inducing Cooperative Behavior among Proselfs versus Prosocials: The Moderating Role of Incentives and Trust.” Journal of Conflict Resolution 54 (5): 799–824. doi:10.1177/0022002710372329.
- Brosig, J., T. Riechmann, and J. Weimann. 2007. “Selfish in the End?” http://mpra.ub.uni-muenchen.de/2035/1/MPRA_paper_2035.pdf
- Colman, A. M. 1995. Game Theory and Its Applications in the Social and Biological Sciences. Oxford: Butterworth-Heinemann.
- Dariel, A., and N. Nikiforakis. 2014. “Cooperators and Reciprocators: A Within-Subject Analysis of Pro-Social Behavior.” Economics Letters 122 (2): 163–166. doi:10.1016/j.econlet.2013.10.033.
- Dolbear, F. T., and L. B. Lave. 1966. “Risk Orientation as a Predictor in the Prisoner’s Dilemma.” Journal of Conflict Resolution 10 (4): 506–515. doi:10.1177/002200276601000409.
- Dreber, A., D. Fudenberg, and D. G. Rand. 2014. “Who Cooperates in Repeated Games: The Role of Altruism, Inequity Aversion, and Demographics.” Journal of Economic Behavior & Organization 98: 41–55. doi:10.1016/j.jebo.2013.12.007.
- Fehr, E., and K. M. Schmidt. 1999. “A Theory of Fairness, Competition, and Cooperation.” Quarterly Journal of Economics 114: 817–868.
- Fischbacher, U. 2007. “z-Tree. Zurich Toolbox for Ready-made Economic Experiments.” Experimental Economics 10: 171–178.
- Gächter, S., E. J. Johnson, and A. Herrmann. 2007. “Individual-Level Loss Aversion in Riskless and Risky Choices.” http://www.nottingham.ac.uk/cedex/documents/papers/2007-02.pdf
- Greiner, B. 2015. “Subject Pool Recruitment Procedures. Organizing Experiments with ORSEE.” Journal of the Economic Science Association 1: 1–12.
- Holt, C. A., and S. K. Laury. 2002. “Risk Aversion and Incentive Effects.” American Economic Review 92: 1644–1655.
- Kramer, R. M., C. G. McClintock, and D. M. Messick. 1986. “Social Values and Cooperative Response to a Simulated Resource Conservation Crisis.” Journal of Personality 54(3): 576–582. doi:10.1111/jopy.1986.54.
- McClintock, C. G., and W. B. Liebrand. 1988. “Role of Interdependence Structure, Individual Value Orientation, and Another’s Strategy in Social Decision Making: A Transformational Analysis.” Journal of Personality and Social Psychology 55: 396–409. doi:10.1037/0022-3514.55.3.396.
- Novemsky, N., and D. Kahneman. 2005. “The Boundaries of Loss Aversion.” Journal of Marketing Research 42: 119–128.
- Rapoport, A., and A. M. Chammah. 1965. Prisoner’s Dilemma. Ann Arbor: University of Michigan Press.
- Ross, L., and R. E. Nisbett. 1991. The Person and the Situation. Perspectives of Social Psychology. New York: McGraw-Hill.
- Sally, D. 1995. “Conversation and Cooperation in Social Dilemmas: A Meta-Analysis of Experiments from 1958 to 1992.” Rationality and Society 7 (1): 58–92. doi:10.1177/1043463195007001004.
- Selten, R. 1967. “Die Strategiemethode zur Erforschung des eingeschränkt rationalen Verhaltens im Rahmen eines Oligopolexperiments.” In Beiträge zur experimentellen Wirtschaftsforschung, edited by E. Sauermann, 136–168. Tübingen: Mohr.
- Steele, M. W., and J. T. Tedeschi. 1967. “Matrix Indices and Strategy Choices in Mixed-motive Games.” Journal of Conflict Resolution 11 (2): 198–205. doi:10.1177/002200276701100207.
- Swope, K. J., J. Cadigan, P. M. Schmitt, and R. Shupp. 2008. “Personality Preferences in Laboratory Economics Experiments.” The Journal of Socio-Economics 37: 998–1009. doi:10.1016/j.socec.2006.12.065.
- Vlaev, I., and N. Chater. 2006. “Game Relativity.” Journal of Experimental Psychology: Learning, Memory and Cognition 32 (1): 131–149.
