
 ?Mathematical formulae have been encoded as MathML and are displayed in this HTML version using MathJax in order to improve their display. Uncheck the box to turn MathJax off. This feature requires Javascript. Click on a formula to zoom.
ABSTRACT
Based on a detailed model of the German tax-benefit system, this paper simulates private and fiscal returns to education for college graduates and college dropouts.
I. Introduction
While private returns to education have been extensively studied, estimates of the fiscal returns – a useful metric from a policy maker’s perspective for the allocation of public investments – are relatively scarce. Using a similar methodology as O’Donoghue (Citation1999), Trostel (Citation2010), and Pfeiffer and Stichnoth (Citation2015), the present paper estimates fiscal returns to education for Germany, based on data from the Socio-Economic Panel (SOEP) for the year 2016 and a detailed model of the tax-benefit system. The main contribution of this paper is that we estimate fiscal returns not only for college graduates, but also for college dropouts. The SOEP provides rich retrospective information which allows us to identify the latter group in the data. We also contribute by using our model for a series of counterfactual experiments, in which we explore how the returns react to changes in gross earnings, expenditure per student, and the level of income tax payments.
II. The internal rate of return and cost parameters
Our measure of interest is the internal rate of return (IRR) of an educational investment, which is defined as the discount rate r at which the present value of the returns equals the present value of the costs:
is the return of the investment in period
and
its cost, relative to a reference group. Both revenues and costs are measured on an annual basis. The investment takes
years and the investment horizon ends in year
. For the same educational investment,
and
will differ depending on whether we study the IRR from the perspective of the individual (in terms of gross earnings and of disposable income) or from a fiscal perspective.
We consider individuals with a university-entry qualification and simulate the average IRR for two investments: completing a five-year university degree and attending a university without graduating. In the latter case, we assume that people drop out after two years and then complete a three-year period of vocational training. The reference category is made up of those individuals with a university-entry qualification who never attend a university, but instead spend three years in vocational training. All three educational trajectories (cf. ) are assumed to begin at age 20. The investment horizon ends at age 65, currently the statutory retirement age.
Table 1. Scenarios
Direct costs in the form of school and tuition fees are low in Germany and so we abstract from these in the calculations. We also abstract from the costs of learning materials. The opportunity cost of university are the foregone earnings compared to the reference group. For students, we assume gross earnings of €385 per month (Middendorff et al. Citation2017); earnings during vocational training are assumed to be €854 (BIBB Citation2016). Disposable incomes are computed by subtracting employees’ social security contributions from these amounts. Income taxation is not relevant at these low levels of earnings.
Public spending per student per year was €7,600 in 2016 (ABBE – Autorengruppe Bildungsberichterstattung Citation2018). In addition, 22% of all full-time students received benefits under the Federal Training Assistance Act (BAföG). The average funding amount was €464 per month (ABBE – Autorengruppe Bildungsberichterstattung Citation2018). Half of these benefits are provided in the form of grants, and the other half in the form of loans. We include only the grant component in our measure of fiscal costs. For vocational training, direct fiscal costs are assumed to be €6,900 per year, the average over all pupils in Germany. These costs arise only for the school-based component of the training programme, as opposed to the training on the job. We therefore assume that the fiscal cost is incurred only for the first two years of the three-year period of vocational training.
III. Data and summary statistics
Returns and costs that occur once individuals enter the labour market are simulated based on cross-sectional data from the 2016 wave of the Socio-Economic Panel (cf. Goebel et al. Citation2019). We exclude civil servants and the self-employed because for them the structure of both gross and net earnings is different, owing to special rules regarding social security contributions.
The breakdown of the number of observations by education and age group is shown in . About 70% of individuals with a college-entry qualification subsequently attended college. Of these, 84% completed college while 16% dropped out of their studies.
Table 2. Summary statistics by age and education
The employment rate is fairly high for all three groups. While college graduates earn the most, the ranking between people with no college and college dropouts is less clear. Those who never went to college tend to have higher earnings in the youngest age group, but college dropouts earn more, on average, at higher ages.
IV. Simulation methodology
While earnings and employment status are directly observed in the data, disposable household income and fiscal contributions have to be simulated. We simulate income taxation, VAT, social security contributions and the key social benefits.Footnote1 Taxes and social benefits are simulated at the household level. Since the returns to education are calculated at the individual level, a subsequent back-translation is necessary in couple households. We assume that all tax-transfer variables (including social security contributions for which individual allocation would be possible) are divided equally between both partners.
The fiscal returns are computed for the constant policy environment of the year 2018.Footnote2 The implicit assumption is that all nominal figures will grow at the rate of inflation and that the system will therefore be stable in real terms.
We construct synthetic lifecycles for each of our outcome variables based on median values for each education-age cell. We take five-year moving averages in order to dampen year-to-year fluctuations and then compute the IRR as defined in EquationEquation (1)(1)
(1) .Footnote3
The entire procedure is bootstrapped 250 times.
V. Results
Based on gross earnings, the IRR for a college degree is 14.2% (). The IRR for disposable income is 7.4%, which is considerably lower than for gross earnings. Income taxes, social security contributions and social transfers thus drive a significant wedge between private gross and net incentives for investment in education. Nevertheless, both measures point to a substantial private return to a five-year university education.
Table 3. Returns to education – main specification
The IRR in terms of the net fiscal contribution is found to be 6.6%.Footnote4 This is close to the 6.5% found by O’Donoghue (Citation1999) for a much earlier year (1994). The OECD (Citation2019) reports a fiscal IRR for Germany of 9% (men) and 6% (women). With a different methodology, De la Fuente and Jimeno (Citation2009) estimate a fiscal IRR of 4.7% for Germany. The estimates by Nonneman and Cortens (Citation1997) for Belgium in 1992 are higher (9.6% for men and 12.4% for women). Trostel (Citation2010) finds a fiscal IRR of 10.3% for the US in the early 2000s.
A trajectory in which individuals drop out of college after two years and then complete three years of vocational training yields a negative IRR for all three outcome measures, compared to the alternative of directly completing three years of vocational training. In terms of gross earnings, the IRR is −0.5%. For disposable income and the net fiscal contribution, the IRR is −5.9%. Because of the smaller sample size, the estimates for college drop-outs are less precise than for college graduates. However, even the 95th percentile of the bootstrap runs is, at 0.4%, only slightly positive. Despite the large margin of error, the simulation therefore points towards significant negative fiscal returns for college drop-outs.
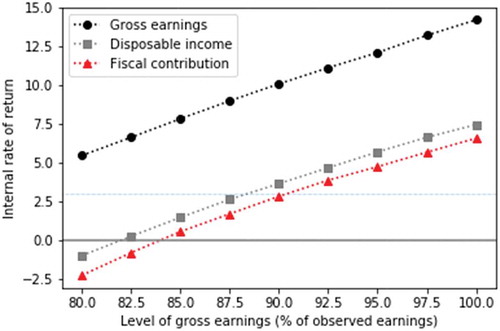
These results are descriptive. To assess the importance of selection effects, we run a counterfactual experiment in which we vary gross earnings of college graduates by setting them to between 80% and 100% of their observed level (). The selection effect would need to bring down gross earnings to about 90% of their current level among college graduates in order to reduce the fiscal IRR to 3%, a value for the discount rate that is often used in the welfare analysis of government policies (e.g., Hendren and Sprung-Keyser Citation2020). If gross earnings were only 84% of their current level, the fiscal IRR of a five-year college degree would become negative. The IRR for gross earnings and disposable income would still be positive in this case.
Figure 1. Completed college – internal rates of return for counterfactual levels of gross earnings
In a second experiment we set the income tax payments to between 80% and 120% of their actual values (not illustrated). A 20% surcharge for everyone would bring up the fiscal IRR for a college degree from 6.6% to 7.1%. If the 20% surcharge is paid only by the graduates, the fiscal IRR reaches 7.8%. The IRR in terms of disposable income is reduced from 7.4% to 6.9% and 6.0%, respectively. Reciprocally, if the income tax payments are scaled down, the IRR in terms of disposable income goes up while the fiscal IRR is reduced. The effects are roughly linear over the range considered here.
Finally, we use the model for an experiment in which we change the expenditure per student and simulate the effects on the fiscal IRR for college drop-outs (not illustrated). Even at an expenditure of €5,000 (as opposed to the €8,212 that we assume in our preferred specification), the fiscal return is below −4%. This result is driven by the fact that all individuals complete vocational training after they drop out of college, so their fiscal cost is strictly larger than for the reference group for any positive expenditure amount.
VI. Conclusion
We provide novel evidence on the returns to education for college drop-outs. From a fiscal perspective, the return to dropping out is significantly negative, with a point estimate of −5.9%. By contrast, public investment into college education in Germany yields a fiscal return of 6.6% if students complete their degree, similar in magnitude to what has been found in a number of previous studies for Germany and other OECD countries. Whether the new findings on the fiscal returns for college drop-outs generalize to other countries is an open empirical question. We leave this for future research.
Acknowledgments
We acknowledge funding by the Federal Ministry of Education and Research, Berlin (project number 01PX16018A). The views expressed in the study are those of the authors and not necessarily those of the ministry. We would like to thank Sarah McNamara and Sebastian Siegloch for helpful comments and suggestions.
Disclosure statement
No potential conflict of interest was reported by the authors.
Additional information
Funding
Notes
1 See Bonin, Reuss, and Stichnoth (Citation2016) and Pfeiffer and Stichnoth (Citation2015) for a description of the model.
2 The SOEP data are from 2016 while the tax-benefit rules are for 2018. The difference arises because the data are released with a time lag. Using the 2016 tax-benefit rules instead has little effect on the results.
3 In some cases, the equation has more than one solution. This happens whenever the series changes sign more than once. In these case, we choose the root that is closest to 0 in absolute value.
4 The net fiscal contribution takes VAT and employers’ (in addition to employees’) social security contributions into account while disposable income does not.
References
- ABBE - Autorengruppe Bildungsberichterstattung. 2018. Bildung in Deutschland 2018 – Ein indikatorengestützter Bericht mit einer Analyse zu Wirkungen und Erträgen von Bildung. Bielefeld: wbv Publication
- BIBB – Bundesinstitut für Berufsbildung. 2016. Datenreport zum Berufsbildungsbericht 2016 – Informationen und Analysen zur Entwicklung der beruflichen Bildung. Bielefeld: W. Bertelsmann.
- Bonin, H., K. Reuss, and H. Stichnoth. 2016. “The Monetary Value of Family Policy Measures in Germany over the Life Cycle: Evidence from a Dynamic Microsimulation Model.” CESifo Economic Studies 62 (4): 650–671.
- De la Fuente, A., and J. F. Jimeno. 2009. “The Private and Fiscal Returns to Schooling in the European Union.” Journal of the European Economic Association 7 (6): 1319–1360. doi:10.1162/JEEA.2009.7.6.1319.
- Goebel, J., M. M. Grabka, S. Liebig, M. Kroh, D. Richter, C. Schröder, and J. Schupp. 2019. “The German Socio-Economic Panel (SOEP).” Jahrbücher für Nationalökonomie und Statistik 239 (2): 345–360. doi:10.1515/jbnst-2018-0022.
- Hendren, N., and B. Sprung-Keyser. 2020. “A Unified Welfare Analysis of Government Policies.” Quarterly Journal of Economics 135 (3): 1209–1318. doi:10.1093/qje/qjaa006.
- Middendorff, E., B. Apolinarski, K. Becker, P. Bornkessel, T. Brandt, S. Heißenberg, and J. Poskowsky. 2017. Die wirtschaftliche und soziale Lage der Studierenden in Deutschland 2016. 21. Sozialerhebung des Deutschen Studentenwerks – Durchgeführt vom Deutschen Zentrum für Hochschul- und Wissenschaftsforschung. Berlin: Bundesministerium für Bildung und Forschung (BMBF.
- Nonneman, W., and I. Cortens. 1997. “A Note on the Rate of Return to Investment in Education in Belgium.” Applied Economics Letters 4 (3): 167–171.
- O’Donoghue, C. 1999. “Estimating the Rate of Return to Education Using Microsimulation.” Economic and Social Review 30 (3): 249–266.
- OECD. 2019. Education at a Glance. Paris: OECD Publishing.
- Pfeiffer, F., and H. Stichnoth. 2015. “Fiskalische und individuelle Bildungsrenditen – Aktuelle Befunde für Deutschland.” Perspektiven der Wirtschaftspolitik 16 (4): 393–411. doi:10.1515/pwp-2015-0023.
- Trostel, P. A. 2010. “The Fiscal Impacts of College Attainment.” Research in Higher Education 51 (3): 220–247. doi:10.1007/s11162-009-9156-5.