
 ?Mathematical formulae have been encoded as MathML and are displayed in this HTML version using MathJax in order to improve their display. Uncheck the box to turn MathJax off. This feature requires Javascript. Click on a formula to zoom.
ABSTRACT
By studying equity market returns to China, the UK, and the US, we explore the key question of whether the COVID-19 pandemic changes the risk exposure of equity markets, which is fundamental to market stability and investor confidence. Using data from the World Health Organization and Bloomberg, our full sample covers the period 3 July 2019 to 15 December 2020 which facilities a subsample (Normal, Shock, Endurance) analysis. Utilizing Value-at-Risk (VaR) metrics as our risk exposure measure, we find that 1) There exists a sharp increase in equity market risk exposure across the three equity markets. 2) A stronger pandemic impact is found in different market capitalization segments – China, large-cap; the UK, small-cap; the US, mid-cap. 3) Generally, investors consider the number of new cases as a more worrying factor than deaths while UK investors are sensitive to both. Our observations suggest that given limited resources but rising demands from both businesses and households for government assistance, a one-size-fits-all policy to support market recovery would be sub-optimal.
I. Introduction
The devastating impacts of COVID-19 on national economies and global financial markets are both significant and apparent. As equity markets tumbled, investors suffered from both financial losses and fall in market confidence. Many affected countries have implemented policies to support financial market stability, which is fundamental to economic recovery and growth. The long-term effectiveness of these policies remains uncertain; however,; a good comprehension of equity market behaviours during this pandemic could offer both policymakers and investors the foresight to react swiftly to an unforeseeable crisis, and more importantly prepare them to be better positioned for a speedy recovery when the pandemic ends.
Since the outbreak of COVID-19, a plethora of research on its impact on financial markets has emerged with many findings illustrating its adverse effects. For instance, Baker et al. (Citation2020) find a positive correlation between the US stock market volatility and the daily headlines of news of the pandemic. Zhang, Hu, and Ji (Citation2020) demonstrate that as a response to the pandemic, global financial market risks have increased substantially. With the main discussion centred on the economic consequences of Ramelli and Wagner (Citation2020a, Citation2020b) show how stock markets are influenced via financial channels. Using data from the Hong Kong and Shanghai stock indexes and daily newly confirmed cases, Al-Awadhi et al. (Citation2020) is another study that shows a negative relationship between these two variables. Examining panel data of 14 daily stock market indexes, Cao et al. (Citation2020) estimate a negative elasticity for the stock market index and local cumulative confirmed cases. In both Maretno, Rossi, and Paglia (Citation2020) and Yan (Citation2020), the method of cumulative abnormal return is used to investigate and confirm the influence of COVID-19 on stock prices. Importantly, these two papers find that this adverse effect is correlated with firm size, which is a key factor in the extant paper.
This paper examines how COVID-19 impacts equity market risk exposure by exploring various capitalization classes of three national equity markets. Our primary research question asks 1) Did COVID-19 increase the risk exposure of equity market? To assemble a detailed picture, this is supplemented by two secondary questions: 2) Did COVID-19 affect different market capitalization classes equally? And 3) What is the relationship between market risk exposure, reported new cases, and deaths? Using Value-at-Risk (VaR) and conditional VaR (CVaR) as our risk exposure measures, we find that firstly, COVID-19 did increase the risk exposure of our sample equity markets disparately, with the US showing the greatest average impact followed by the UK, then China. Secondly, market capitalization seems to play a role in the severity of the COVID-19 effect. Finally, new cases are found to possess a stronger statistical relationship with VaR estimates than deaths, while UK investors are sensitive to both. Overall, our findings suggest that government policies that facilitate economic recovery should be more market segment specific.
II. Data and methods
To collect empirical evidence, we examine indexes of three national equity markets: China – Shanghai Stock Exchange (SSE) Mega-Cap (Large-Cap), Mid-Cap, and Small-Cap; the UK – FTSE100 (Large-Cap), FTSE250 (Mid-Cap), and FTSE Small-Cap; and the US – S&P500 (Large-Cap), S&P Mid-Cap 400, and S&P Small-Cap 600. Daily closing price of these indexes for the period of 3 July 2019 to 15 December 2020 are collected from Bloomberg. COVID-19 figures are obtained from the World Health Organization website. Using their announcement of the first reported case (FRC) as a reference point, we further divide the full sample into three subsamples: ‘Normal’ – 6 months before the FRC, ‘Shock’ – 6 months since the FRC, ‘Endurance’ – post ‘Shock’ until 15 December 2020.
VaR measures the potential loss in value of a trading portfolio from adverse market movements over a specific period for a given confidence interval, viz. a measure of risk exposure over a specified period. There is abundant literature on the applications of VaR method to measure market portfolio returns during stock market turbulent times (see, for example, Mirjana and Miletic (Citation2015), and Quang et al. (Citation2018)). To calculate the VaR of our equity market indexes, we first compute the return series using:
where represents the daily return of index i (i = large-cap, mid-cap, small-cap) of national stock exchange j (j = China, UK, US) on trading day t. For each i and j, the total number of observations is 355 for China; 351 for the UK; and 357 for the US.
To produce the conditional variance of the return series, we apply the historical simulation framework with an Exponential GARCH (1,1) – (EGARCH) model. The specification of the EGARCH model is:
The conditional variance is a function of an intercept (
), a shock from the prior period (
) and the variance from the last period (
), and
presents the potential presence of the leverage effect.
Finally, VaR at 95% confidence interval (CI) is calculated using the formula VaR = ‒1.65√ht. To answer the question of what the expected loss beyond the 95% VaR is, we also examine the CVaR.
To capture the relationship between VaR, new cases per 100k of population (NC_100k) and deaths per 100k of population (DTH_100k), we run OLS regression on the following equation with as an error term:
III. Results and discussions
presents summary statistics that provide empirical answers to our three research questions. For Question 1 and 2, we analyse our VaR and CVaR estimates through comparing the ‘Normal’, ‘Shock’ and ‘Endurance’ period results, whereas regression estimates offer us insight into the relationship between risk exposure, new cases, and deaths.
Table 1. Summary statistics of VaR (95% CI), CVaR, and Covid-19 figure regression estimates
The three Chinese indexes show that during the Normal period, the average VaR estimates range from −1.250 to −1.570. When Shock begins, there are increases in the average, maximum and CVaR across the three market capitalization classes. The change in average VaR demonstrates that the mid-cap index suffered from the biggest increase of 88.41% (from −1.250 to −2.356), while the other two capitalization classes share smaller and similar rise in their averages. We observe market recovery during the Endurance period, particularly in the small-cap class where the average increase in loss is reduced to a 29.07% (−1.570 to −2.027) difference from the Normal period. Nonetheless, the Chinese SSE results reveal that COVID-19 did raise the risk exposure of the market. This is particularly highlighted by the substantial increase in the large-cap index during Shock when the maximum loss rose from −1.517 to −9.595, a surge of 532.40% – representing the largest amongst the three capitalization classes. Overall, the change in CVaR in all classes shares a similar pattern with the discussed VaR values. Regression estimates of EquationEq. (3)(3)
(3) suggest that new cases seem to have a stronger relationship with VaR than deaths across the three capitalization classes.
During Shock, the three UK FTSE indexes show evidence of elevated VaR, which rises ascendingly from large- to small-cap. It reaches the highest change in the average VaR of 227.11% (from −0.879 to −2.876) in the small-cap class. Also, sharing a comparable pattern as in the average values, the maximum loss has the highest value of −10.616 and a CVaR of −7.097. Interestingly, during Endurance, we observe that both the large-cap and mid-cap classes revert their increase with the newly estimated VaR and CVaR at the levels that are either lower than or similar to those before the outbreak of the pandemic. When the regression coefficients and
are examined, both new cases and deaths display a rather strong relationship with VaR. This infers that UK investors are equally fearful and sensitive to the announcements of these figures, which can be potentially transpired to more future deaths, and further affect the economy adversely.
For the US case, again we see a sharp rise in the magnitude of both the average (ranges from 3.917 to −5.531) and the maximum loss (ranges from −14.224 to −16.412) throughout the three capitalization classes during Shock. However, in contrast to the UK case where the small-cap has the largest change in the average, the biggest change in the US appears in the mid-cap class (266.82% from −1.342 to −4.922). Nevertheless, the maximum loss number shows that this is also the only class that has recovered from the situation during the Endurance period. Additionally, the CVaR estimates support the observation of recovery in all three classes. Like the China case, during COVID-19, the estimated coefficients of new cases and deaths imply that VaR estimates maintain a strong statistical association with new cases while deaths play no role.
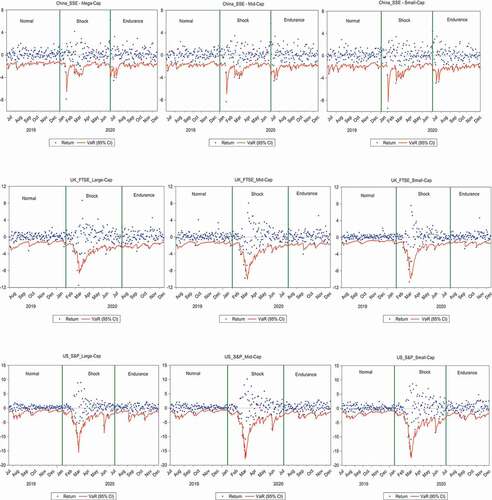
The reported statistics corroborate the fact that the pandemic did change equity market risk dynamics in these three countries. Nonetheless, not all capitalization classes suffered from an equal degree of increase in their VaR and CVaR estimates, as measures of risk exposure – most affected China: large-cap; UK: small-cap; US: mid-cap. These results also reveal that generally China has the smallest increase in risk exposure, which might possibly be due to the comparatively fewer number of reported cases and deaths, whereas both the UK and the US have been experiencing a prolonged and more severe suffering from this COVID-19 crisis. The relationships between VaR estimates, new cases, and deaths capture the country-specific intensity of sentiment. In China and the US, investors seem to be sensitive to the report of new cases, whereas UK equity market participants reacted equally to both new cases and deaths. Overall, our findings suggest that these terrible figures and sad news appear to play a part in raising market risk exposure during the pandemic. To ensure the robustness of our empirical results, a simple method of backtesting is used. displays our computed VaR metrics, and the three national equity market returns, and it clearly shows that the occurrence of those returns exceeding their VaR estimates is less than 5%. This observation provides us with confidence in our results.
Figure 1. Market returns to China, the UK, and the US, and VaR for the three subsample periods.
IV. Conclusion remarks
Since the outbreak of COVID-19, governments of inflicted countries have endeavoured to minimize its disruptive effects on the economy whenever the opportunity of recovery is available. Our findings are in agreement with Maretno, Rossi, and Paglia (Citation2020) and Yan (Citation2020) in identifying the importance of market capitalization size. Accordingly, we believe that a one-size-fits-all policy approach in offering support to financial markets or even to individual firms would not be most effective. We have shown that market capitalization structure does matter. Hence, given scarce resources but rising demands from both businesses and households, it is imperative that governments should have a more targeted approach when granting assistance to financial markets.
Disclosure statement
No potential conflict of interest was reported by the authors.
References
- Al-Awadhi, A. M., K. Al-Saifi, A. Al-Awadhi, and S. Alhamadi. 2020. “Death and Contagious Infectious Diseases: Impact of the COVID-19 Virus on Stock Market Returns.” Journal of Behavioral and Experimental Finance 27: 100326. doi:https://doi.org/10.1016/j.jbef.2020.100326.
- Baker, S. R., N. Bloom, S. J. Davis, K. J. Kost, M. C. Sammon, and T. Viratyosin. 2020. “The Unprecedented Stock Market Impact of COVID-19.” National Bureau of Economic Research Working Papers, No. w26945.
- Bhuyan, R., E. Lin, and P. Ricci. 2010. “Asian Stock Markets and the Severe Acute Respiratory Syndrome (SARS) Epidemic: Implications for Health Risk Management.” International Journal of Environmental Health 4 (1): 40–56. doi:https://doi.org/10.1504/IJENVH.2010.033033.
- Cao, K. H., Q. Li, Y. Liu, and C. Woo. 2020. “Covid-19’s Adverse Effects on a Stock Market Index.” Applied Economics Letters 1–5. Forthcoming. doi:https://doi.org/10.1080/13504851.2020.1803481.
- Maretno, A. H., F. Rossi, and J. K. Paglia. 2020. “COVID-19: Stock Market Reactions to the Shock and the Stimulus.” Applied Economics Letters. Forthcoming. doi:https://doi.org/10.1080/13504851.2020.1781767
- Mirjana, M., and S. Miletic. 2015. “Performance of Value at Risk Models in the Midst of the Global Financial Crisis in Selected CEE Emerging Capital Markets.” Economic Research-Ekonomska Istraživanja 28 (1): 132–166. doi:https://doi.org/10.1080/1331677X.2015.1028243.
- Quang, P. B., T. Klein, N. H. Nguyen, and T. Walther. 2018. “Value-at-risk for South-East Asian Stock Markets: Stochastic Volatility Vs. GARCH.” Journal of Risk and Financial Management 11 (2): 1–20. doi:https://doi.org/10.3390/jrfm11020018.
- Ramelli, S., and A. Wagner. 2020b. “What the Stock Markets Tells Us about the Consequences of COVID-19.” In Mitigating the COVID Economic Crisis, edited by R. Baldwin and B. Welder Di Mauro, 63–70. London: CEPR Press.
- Ramelli, S., and A. Wagner. 2020a. “Feverish Stock Price Reactions to Covid-19.” SSRN Electronic Journal. doi:https://doi.org/10.2139/ssrn.3550274.
- Yan, C. 2020. “COVID-19 Outbreak and Stock Prices: Evidence from China.” Zhongnan University of Economics and Law Working Paper. https://papers.ssrn.com/sol3/papers.cfm?abstract_id=3574374
- Zhang, D., M. Hu, and Q. Ji. 2020. “Financial Markets under the Global Pandemic of COVID-19.” Finance Research Letters 36: 101528. doi:https://doi.org/10.1016/j.frl.2020.101528.