
ABSTRACT
Updating the study by Seiler and Wohlrabe (2013) we use archetypoid analysis to classify top economists. The approach allows us to identify typical characteristics of extreme (archetypal) values in a multivariate data set. In contrast to its predecessor, the archetypal analysis, archetypoids always represent actual observed units in the data. Using bibliometric data from 776 top economists we identify four archetypoids. These types represent solid, low, top and diligent performer. Each economist is assigned to one or more of these archetypoids.
Article Highlights
Archetypoid analysis to categorize top economists
Based on seven bibliometric indicators for 776 economists obtained from the RePEc database
Identification of four archetypoids, which are characterized as the low, solid, top and diligent performer
I. Introduction
Within this paper archetypoid analysis is used to classify top economists. The classification provides a straightforward overview of the various top researchers working in the area of economics. In times of an increasing number of scholars across all research fields (Bloom et al. Citation2020) such an easy tool for classification is valuable. The present paper builds upon the studies by Seiler and Wohlrabe (Citation2013), evaluating economists and Wohlrabe and Gralka (Citation2020a), categorizing economics faculties and authors. With a similar goal, the former study used archetypal analysis to categorize scientists. A drawback of this approach is that identified archetypes might be artificial, i.e. no entity from the employed dataset can fully be assigned. In line with the latter study we therefore employ the archetypoid analysis. In contrast to its predecessor, the archetypal analysis, archetypoids always represent actual observed units in the data. Hence, we are able to identify those top economists which represent identified archetypoids perfectly. Parallel to both studies we employ RePEc (Research Papers in Economics) data for our investigation, focusing on the top economists worldwide. While the data used by Seiler and Wohlrabe (Citation2013) refers to 2011, our dataset includes all years up to 2019. The RePEc database has evolved tremendously both with respect to quantity and quality over time. We therefore think that the update is necessary and useful.
Archetypal analysis has aroused the interest of researchers working in various fields, such as astrophysics (Chan et al. Citation2003), machine learning (Mørup and Hansen Citation2012; Seth and Eugster Citation2016), and sports (Seth and Eugster Citation2016). The same applies for the archetypoid analysis, which was used for the evaluation within fields such as sports (Vinué and Epifanio Citation2017) and the financial stock market (Moliner and Epifanio Citation2018).
II. Methodology and data
Due to space constraints we refer the reader to Wohlrabe and Gralka (Citation2020b) for a short introduction of archetypoid analysis and corresponding references. Vinué, Epifanio, and Alemany (Citation2015) provide a detailed description of the approach including computational issues. For our analysis we used the R package Anthropometry version 1.13 by Vinué (Citation2017).
We employ seven bibliometric indicators from the RePEc (Research Papers in Economics) website (http://www.repec.org).Footnote1 RePEc offers currently 40 rankings of registered authors based on bibliometric data. However, these rankings are often highly correlated, see Zimmermann (Citation2013) for further details. In line with Seiler and Wohlrabe (Citation2013) and Wohlrabe and Gralka (Citation2020a) we use the following seven ones:
Published work, which includes working papers, books, software codes, and chapters
•Number of distinct works, unweighted
•Number of distinct works, weighted by simple impact factor
•Citations, which represent the impact of an author
•Number of citations, unweighted
•Number of citations, weighted by the simple impact factor
•Pages, which account for the published articles
•Number of pages, unweighted
•Number of pages, weighted by the simple impact factor
•Number of downloads, which shows the access
For each of our m = 7 bibliometric indicators we collected the corresponding economists for which the scores were publicly available in January 2020.Footnote2 The scores refer to the December 2019 ranking. We ended up with N = 776 economists. A full list can be found in Wohlrabe and Gralka (Citation2020b). It is important to note that due the construction of the data set we only consider top economists which are among the top 5% worldwide in each category.
The descriptive statistics for the original indicators can be found in . We report the mean, median as well as the minimum and maximum score. On average an economist in our sample has published around 152 articles which can either be working papers or journal articles. These publications contain around 1,600 pages in (refereed) journals and were downloaded around 1,000 times. The top economists gather 4,800 citations on average. The most cited economist is Andrei Shleifer from the Harvard University. It is thereby important to bear in mind, that the numbers describe stock levels (up to December 2019), which explains the high values of the indicators. The standard deviations are quite large, at least half of the mean. This shows that the class of top economists are quite heterogenous with respect to bibliometric indicators.
Table 1. Descriptive statistics
III. Results
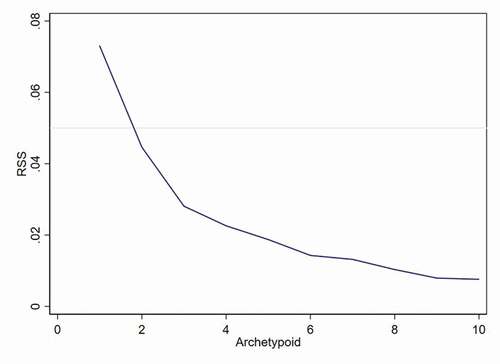
A priori it is not clear how many archetypoids are reasonable given the seven indicators for each economist. In we show the scree-plot of the RSS, which is used to determine the number of archetypoids to retain using the so-called elbow criterion. Based on the scree-plot we perform an analysis with four potential archetypoids.Footnote3
Figure 1. RSS-plot
shows the bar-plots representing percentiles for four archetypoids. Bar-plots thereby serves as a different graphical representation of the convex hull. The height of each bar-plot denotes the share of the convex hull relative to the maximum in the category. Hence, the y-axis denotes the relevance of the indicator for the archetype. provides additional context for the percentiles shown in . The table reports the archetypoid value for each bibliometric indicator, when the reported percentiles are applied to the original dataset. To give an example: while archetypoid 1 published 146 works, archetypoid 2 published 75 articles.
Table 2. Percentile values for each archetypoid
Figure 2. Identified archetypoids
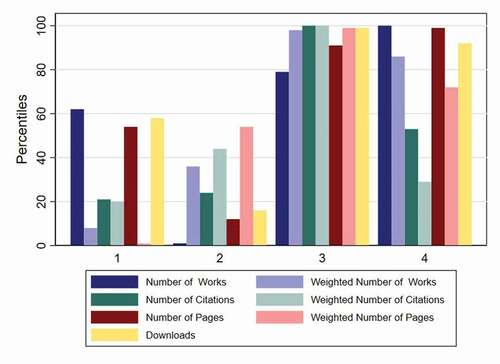
The four archetypoids can be interpreted as follows:
Archetypoid 1 represents the low performer with a relatively high number of working papers and articles, but a relatively low number of citations and downloads as can be seen in . The weighted impact is the smallest of all archetypoids
Archetypoid 2 denotes the solid performer with a relatively low number of works and downloads compared the first archetypoid. However, the quality-weighted impact of this work is higher.
Archetypoid 3 represents the top performer among the top-level authors, given the other archetypoids. The author performs well across all indicators, even if the indicators are quality-weighted. shows that the corresponding values for citations are by far larger than those of the other archetypoids.
Archetypoid 4 denotes the diligent performer, one between the previous two extremes, with a relatively high number of published work. However, compared to archetypoid 3, the quality adjusted indicators are lower as well as the citations and downloads. Still, they are larger than the figures of archetypoid 1 and 2.
Nevertheless, as we extracted the best economic authors from RePEc, the terminus low performer for the first archetypoid must be interpreted cautiously. Compared to all authors listed in RePEc every author in our sample can be classified as top, nevertheless, compared among each other some perform worse than other ones.
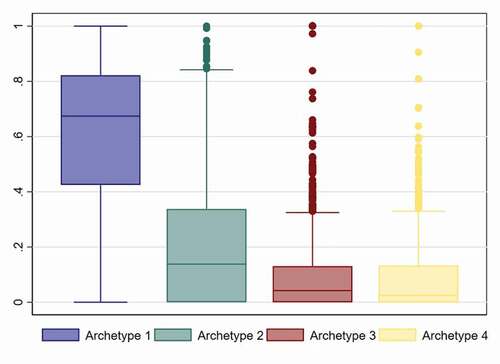
Besides the aggregated analysis it is also possible to look at the relative share of each archetypoid for each author. In practice, percentages of all four archetypoids are allocated to the authors. This implies, that each author is assigned four values, which add up to one. In we show the box-plots for all percentage shares of the four identified archetypoids. It displays that most of the authors in our data set are characterized by Archetype 1, the low performer, as it represents the largest relative shares. In comparison, the Archetype 2, the solid performer, is less frequent. Of particular interest is the third archetypoid, the top performer. As one would suspect, the majority of authors in our sample have a low share of this archetypoid and only some – the true top performers – are assigned a large share of this archetypoid. The share of Archetype 4, the diligent performer, is similarly low.
Figure 3. Barplots of archetypoid shares allocated to the economists
In we report the top five authors for each archetypoid, i.e. authors with the largest relative share for the respective archetypoid. The values for each author of the sample can be found in Wohlrabe and Gralka (Citation2020b). A value of 1.000 denotes that the respective author represents the identified archetypoid perfectly. By assumption, this is the case for at least one author for all four archetypoids. Andrei Shleifer, James J. Heckman and Robert J. Barro represent the Archetypoid 3, the top performer. In contrast, Peter Nijkamp and Michael McAleer represent the forth one, the diligent performer. Five authors represent the low performer, which is plausible since the type is most common among the three archetypoids. Nevertheless, in most cases, authors are a mixture of the four different archetypoids.
Table 3. Economists top five for each archetypoid
IV. Conclusions
In this paper we applied archetypoid analysis to the evaluation of top economists. The approach allows to extract typical characteristics (archetypoids) within a multivariate data set. We evaluate 776 scientists obtained from the RePEc database. We obtained seven bibliometric scores for each author, spanning over various measures of (quality-weighted) number of published work, citations and access statistics. We identified four main archetypoids, which are characterized as low, solid, top and diligent performer. Our focus was on research related indicators and we left out aspects as teaching or acquisition of third-party funding. We leave this for future research.
Disclosure statement
No potential conflict of interest was reported by the author(s).
Data availability statement
Data is available upon request.
Notes
1 RePEc data has often been used in bibliometric studies. See, inter alia, Rath and Wohlrabe (Citation2016), Meyer and Wohlrabe (Citation2018), Sommer and Wohlrabe (Citation2017), Bornmann, Butz, and Wohlrabe (Citation2018) or García-Suaza, Otero, and Winkelmann (Citation2020).
2 For each ranking only the top 5% of all registered economists are shown on the RePEc website.
3 Since a potential flattening can also be detected for 3 and 5 archetypoids we tested how the results change, if a different number of archetypoids is considered. The change mainly affects the performers between the top and low class most. Simply put, if 3 archetypoids are considered, the solid and diligent performer are summed up to one group. If 5 archetypoids are considered, the solid performer is further distinguished into a (relatively) top and low class. The detailed results can be provided by the authors upon request.
References
- Bloom, N., C. I. Jones, J. Van Reenen, and M. Webb. 2020. “Are Ideas Getting Harder to Find?” American Economic Review 110 (4): 1104–1144. doi:https://doi.org/10.1257/aer.20180338.
- Bornmann, L., A. Butz, and K. Wohlrabe. 2018. “What are the Top Five Journals in Economics? A New Meta-ranking.” Applied Economics 50 (6): 659–675. doi:https://doi.org/10.1080/00036846.2017.1332753.
- Chan, B. H., D. A. Mitchell, and L. E. Cram. 2003. “Archetypal Analysis of Galaxy Spectra.” Monthly Notices of the Royal Astronomical Society 338 (3): 790–795. doi:https://doi.org/10.1046/j.1365-8711.2003.06099.x.
- García-Suaza, A., J. Otero, and R. Winkelmann. 2020. “Predicting Early Career Productivity of PhD Economists: Does Advisor-match Matter?” Scientometrics 122 (1): 429–449. doi:https://doi.org/10.1007/s11192-019-03277-8.
- Meyer, J., and K. Wohlrabe. 2018. “Standing on the Shoulder of Giants: The Aspect of Free-riding in RePEc Rankings.” Applied Economics Letters 25 (4): 223–228. doi:https://doi.org/10.1080/13504851.2017.1310992.
- Moliner, J., and I. Epifanio. 2018. “Bivariate Functional Archetypoid Analysis: An Application to Financial Time Series.” In Mathematical and Statistical Methods for Actuarial Sciences and Finance, 473–476. Springer, Cham: Springer.
- Mørup, M., and L. K. Hansen. 2012. “Archetypal Analysis for Machine Learning and Data Mining.” Neurocomputing 80: 54–63. doi:https://doi.org/10.1016/j.neucom.2011.06.033.
- Rath, K., and K. Wohlrabe. 2016. “Recent Trends in Co-authorship in Economics: Evidence from RePEc.” Applied Economics Letters 23 (12): 897–902. doi:https://doi.org/10.1080/13504851.2015.1119783.
- Seiler, C., and K. Wohlrabe. 2013. “Archetypal Scientists.” Journal of Informetrics 7 (2): 345–356. doi:https://doi.org/10.1016/j.joi.2012.11.013.
- Seth, S., and M. J. A. Eugster. 2016. “Probabilistic Archetypal Analysis.” Machine Learning 102 (1): 85–113. doi:https://doi.org/10.1007/s10994-015-5498-8.
- Sommer, V., and K. Wohlrabe. 2017. “Citations, Journal Ranking and Multiple Authorships Reconsidered: Evidence from Almost One Million Articles.” Applied Economics Letters 24 (11): 809–814. doi:https://doi.org/10.1080/13504851.2016.1229410.
- Vinué, G., and I. Epifanio. 2017. “Archetypoid Analysis for Sports Analytics.” Data Mining and Knowledge Discovery 31 (6): 1643–1677. doi:https://doi.org/10.1007/s10618-017-0514-1.
- Vinué, G. 2017. “Anthropometry: An R Package for Analysis of Anthropometric Data.” Journal of Statistical Software 77 (6): 1–39. doi:https://doi.org/10.18637/jss.v077.i06.
- Vinué, G., I. Epifanio, and S. Alemany. 2015. “Archetypoids: A New Approach to Define Representative Archetypal Data.” Computational Statistics & Data Analysis 87: 102–115. doi:https://doi.org/10.1016/j.csda.2015.01.018.
- Wohlrabe, K., and S. Gralka. 2020a. “Using Archetypoid Analysis to Classify Institutions and Faculties of Economics.” Scientometrics 123 (1): 159–179. doi:https://doi.org/10.1007/s11192-020-03366-z.
- Wohlrabe, K., and S. Gralka. (2020b). Classifying Top Economists Using Archetypoid Analysis. CEPIE Working Paper, 01/20, 1–32.
- Zimmermann, C. 2013. “Academic Rankings with RePEc.” Econometrics 1 (3): 249–280. doi:https://doi.org/10.3390/econometrics1030249.
