
 ?Mathematical formulae have been encoded as MathML and are displayed in this HTML version using MathJax in order to improve their display. Uncheck the box to turn MathJax off. This feature requires Javascript. Click on a formula to zoom.
ABSTRACT
This paper considers the effect of government revenue and the quality of governance on the under-five and maternal survival rates. A non-linear panel data study was undertaken using annual data for every country in the world. The study’s broad conclusion is that while government resources, measured as total revenue received by a country’s government, is essential, the quality of governance is even more critical in determining a good outcome for both mother and child.
I. Introduction
The United Nations third sustainable development goal (SDG) target is that the under-five mortality rates should be less than 25 per 1000 live births by 2030, and maternal mortality rates fewer than 70 maternal deaths per 100,000 live births. However, most low-income countries (LICs) are likely to miss this target (The United Nations Citation2018).
There is a clear relationship between per capita income and survival. Filmer and Pritchett (Citation1999) used cross-national data for 100 developing countries in a panel data study to investigate the impact of public health spending on child mortality. They show that the elasticity of income to child mortality is −0.6 but find that the differences between countries in health spending only explain less than 0.15% of the mortality differences. They find that it would require an increase in public health spending in the range of 50-100,000 USD to avert one child’s death. They do not control for the quality of governance, hereafter called governance (Filmer and Pritchett Citation1999). Like Filmer and Pritchett, Jamison, Murphy, and Sandbu (Citation2016) and many of the empirical studies analysed by O’Hare et al. (Citation2013) use a log formulation in a panel data study to derive comparable elasticities (O’Hare et al. Citation2013; Jamison, Murphy, and Sandbu Citation2016). Hall et al. (Citation2020) also conducted a large panel data study, but they found that the double log specification was outperformed by a model with exponential decay of the effect of government revenue per capita on under-five and maternal mortality (they calculated government revenue per capita by multiplying the government revenue as a percentage of GDP by GDP per capita in constant 2010 USD) (Hall et al. Citation2020).
This paper’s purpose is twofold: first, we consider an alternative non-linear specification based on survival rates rather than mortality rates. Second, we study the critical question of governance’s effect on children’s and mothers’ survival. We undertake a non-linear unbalanced panel data study employing data on 217 countries over the period 1960–2020 to investigate this question.
II. Governance
Several researchers have shown the critical influence of governance on child and maternal survival (Dawson Citation2010; Lin et al. Citation2014; Li et al. Citation2018; Ruiz-Cantero et al. Citation2019). Countries with good governance attract both domestic and foreign investment, which drives economic growth. A meta-analysis of 115 studies found that a one standard deviation improvement in corruption is associated with a 0.59% increase in per-capita income in low-income countries (Ugur and Dasgupta Citation2011). The influence of governance (voice and accountability, government effectiveness and the rule of law) on the economy acts via multiple pathways, including by improving the efficiency of the banking sector (Kamarudin, Sufian, and Md Citation2016). One aspect of governance, corruption, is associated with inferior public services, lower rates of attended births, lower rates of immunization, and higher child mortality rates (Factor and Kang Citation2015).
While the relationship between revenue and health outcomes and governance and health outcomes is clear, we add to the body of knowledge by studying the interaction of both government revenue and governance on survival. We use a range of governance indicators, namely control of corruption, government effectiveness, political stability, quality of regulation, the rule of law, and the population’s ability to have a say in government, voice, and accountability. These variables are scaled over a range from −2.5 to +2.5, where −2.5 means extremely poor quality and +2.5 is the bestFootnote1 (Kaufmann, Kraay, and Mastruzzi Citation2010; Kaufmann and Kraay Citation2020).
The model
We define our two dependent variables, under-five survival rate (mean of 92.3%, a minimum of 58.1% and a maximum of 99.8%) and maternal survival rate (mean of 99.7%, a minimum of 97.5% and a maximum of 99.99%).
A standard linear model or a log-log model with constant elasticities would be inappropriate for this data. Such a model would suggest achieving rates above 100% for a sufficiently high government revenue per capita which is unacceptable. Therefore, we need a model with a broadly defined ‘S’ shape that starts with minimal effects for very low government revenue levels per capita and then has a period of rapid growth followed by a falling off as saturation is reached. Such a relationship is described by a broad family of functional forms called sigmoids, and within this family, the most widely used function is the logistic function. First used extensively by Verhulst, this approach has found applications in many areas, including ecology, medicine, chemistry, physics, linguistics, agriculture, and economics. The basic form of the logistic function is
where x is the exogenous variable, M is the maximum of the curve and control the steepness and shape of the curve.
This simple function would allow us to model government revenue’s effect on our two survival variables; however, it would not be possible to include our governance measures. Therefore, we have adapted the basic logistic function to allow a set of exogenous variables (our governance indicators) to change the shape of the logistic curve. Finally, we make one further adjustment to the model for the maternal survival rate. As noted above, the minimum maternal survival rate in our data is around 97%. The standard logistic function (1) assumes that the relevant minimum is zero. If we used this function, the data would then range over a tiny part of the specified curve and would not capture the non-linearity we expect to find. Therefore, we used the generalized logistic function, which allows the curve to be defined from a non-zero minimum. This function is specified as
Where Min is the non-zero minimum for the dependent variable, which we set at 95%, is a x vector of exogenous variables and
are 1xk vectors of parameters. This allows the shape of the logistic curve to vary for each country depending on the variables in the
vector (our governance indicators).
Our general approach was to enter all the governance variables in each equation for our two indicators and then move from this general specification to a simpler one by eliminating any governance variables, proving insignificant.
Our final assumption is that we regard Equationequation (2)(2)
(2) as a long-run relationship (formerly a non-linear cointegrating relationship, see Asteriou and Hall (Citation2021)); this means that we expect this relationship to hold over time but not instantaneously (Asteriou and Hall Citation2021). For example, if a low-income country had a sudden increase in government revenue per capita, it would not be able to instantly deliver the infrastructure necessary to obtain a high level of survival immediately but would have to build these up over time. This implies a process of dynamic adjustment, and we model this using the following dynamic adjustment equation.
where is one of our two survival indicators in country i in period t and
is the fitted value from Equationequation (2)
(2)
(2) or (3) for that indicator, and
is a standard error term
.
III. Results
The results of estimating Equationequations (2)(2)
(2) and (Equation3
(3)
(3) ) for each of the survival indicators are given in . Each column of the table provides the parameters set out in Equationequations (2)
(2)
(2) and (Equation3
(3)
(3) ). Parameters
are the two basic parameters of the logistic function. After each of these, we show the governance indicators that modify the shape of each country’s logistic curve. Overall, both models seem to work well and have quite high R2. However, there is no clear pattern in the usefulness of the governance indicators, although the regulatory quality was insignificant in both models for the first set of coefficients. The rule of law was unimportant entirely in the under-five survival equations. The fact that some of the governance indicators are significant in every case demonstrates that the shape of the logistic curve does indeed vary between countries in a significant way. It is not possible to interpret these parameters in the usual way as elasticities or partial derivatives. They are simply parameters which govern the shape of the ‘S’ shaped curve, that is, how steep it is and where the sharp rise occurs. For this reason, we go on below to show the actual shapes of the curves for some sample countries, which illustrates exactly how important both the basic two parameters are and the role the governance indicators play in varying the shape of the curve in each country.
Table 1. The results for the logistic model for each health indicator.
gives the details of the dynamic model (Equationequation 3(3)
(3) ) for both survival rates. The parameter that governs the stability of the equation (
) is, in all cases, negative and significant as required. The effect of the lagged change (
) is mostly quite large and highly significant. The R2is very high, indicating a very good fit and the DW statistic clearly shows no sign of serial correlation in the errors. As we would expect, these results suggest that it takes several years to adjust these indicators to their equilibrium value after a change in government revenue per capita.
Table 2. The dynamic models.
Table 3. Definitions of dimensions of governance.
The shape of the curves and the importance of governance
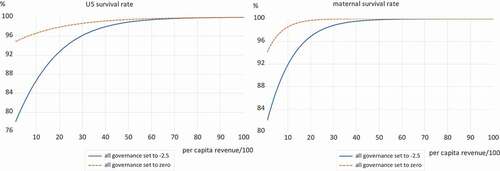
The estimates presented above seem reasonably satisfactory, but it is hard to get a clear understanding of the dynamics from these estimates. This is because we have many countries, and every country will be different, and space constraints make it impossible to show each country’s behaviour individually. To help understand both the importance of the governance effects and per capita government revenue, we conduct a simple set of experiments. We begin by setting all the governance indicators to −2.5, which is their worst value possible. We then calculate the long-run relationship between revenue and the two survival indicators. We then reset all the governance indicators to zero, the mid-point of the range, and we again calculate the relationship between per capita government revenue and each indicator. We then graph each pair of relationships to see both the effect of an improvement in governance and the effect of revenue.
shows the graphs for this experiment for each of the indicators. In both cases, the move from extremely poor governance to a neutral quality of governance dramatically affects the survival indicator, especially at very low per capita revenue levels. Consider the under-five survival rate: at a per capita government revenue level of 1000, USD the low level of governance curve achieves only slightly over 86% survival, while with neutral governance, the same level of income achieves approximately 97% survival. Once per capita government revenue reaches 5000 USD per year, the two curves largely converge, and governance makes little difference to the survival rate. A similar picture is shown for maternal survival rates. For a low level of per capita government revenue of 1000, USD the poor governance curve achieves only 92% maternal survival, while a neutral level of governance achieves over 98% survival. Again, for per capita revenues over 5000, USD the two curves coincide, and governance makes little difference. These findings emphasize the importance of good governance for survival rates in the case of low-income countries.
Figure 1. The effect of governance and per capita revenue on maternal and child survival.
IV. Conclusions
We find that increased government revenue is associated with an increase in both child and maternal survival rates. For low-income countries, this effect is dominated by the effect of improving the quality of governance. When government revenue reaches a level of around 5000 USD per capita, governance becomes much less critical. This modelling offers the ability to model the impact of a change in government revenue in the individual country while accounting for governance. As such, it is a valuable addition to the armoury of those who advocate for reduced corruption and increased government revenue.
Disclosure statement
No potential conflict of interest was reported by the author(s).
Additional information
Funding
Notes
1 Full definitions and data sources are supplied in in the data appendix
References
- Asteriou, D., and S. G. Hall. 2021. Applied Econometrics. New York: Palgrave Macmillan.
- Dawson, A. 2010. “State Capacity and the Political Economy of Child Mortality in Developing Countries Revisited: From Fiscal Sociology Towards the Rule of Law’.” International Journal of Comparative Sociology 51 (6): 403–422. doi:10.1177/0020715210387522.
- Factor, R., and M. Kang. 2015. “‘Corruption and Population Health Outcomes: An Analysis of Data from 133 Countries Using Structural Equation Modeling’, International Journal of Public Health.” Springer Basel 60 (6): 633–641. doi:10.1007/s00038-015-0687-6.
- Filmer, D., and L. Pritchett. 1999. “The Impact of Public Spending on Health: Does Money Matter?” Social Science & Medicine 49 (10): 1309–1323. doi:10.1016/S0277-9536(99)00150-1.
- Hall, S., et al. 2020. “Government Revenue and Child and Maternal Mortality.” Open Economies Review. doi:10.1007/s11079-020-09597-0.
- Jamison, D. T., S. M. Murphy, and M. E. Sandbu. 2016. “‘Why Has Under-5 Mortality Decreased at Such Different Rates in Different Countries?’, Journal of Health Economics.” Elsevier B.V 48: 16–25. doi:10.1016/j.jhealeco.2016.03.002.
- Kamarudin, F., F. Sufian, and N. A. Md. 2016. “‘Does Country Governance Foster Revenue Efficiency of Islamic and Conventional Banks in GCC Countries?’, EuroMed Journal of Business.” Emerald Group Publishing Limited 11 (2): 181–211. doi:10.1108/EMJB-06-2015-0026.
- Kaufmann, D., and A. Kraay. 2020. “Worldwide Governance Indicators.” Accessed 10 May 2020 https://info.worldbank.org/governance/wgi/
- Kaufmann, D., A. Kraay, and M. Mastruzzi. 2010. “The Worldwide Governance Indicators Methodology and Analytical Issues.” In Development Research Group. World Bank, (September).
- Li, Q., et al. 2018. “‘Corruption Costs Lives: Evidence from a Cross-country Study’, European Journal of Health Economics.” Springer Verlag 19 (1): 153–165. doi:10.1007/s10198-017-0872-z.
- Lin, R. T., et al. 2014. “‘Governance Matters: An Ecological Association between Governance and Child Mortality’, International Health.” Oxford University Press 6 (3): 249–257. doi:10.1093/inthealth/ihu018.
- O’Hare, B. et al. (2013) ‘Income and Child Mortality in SSA; A Systematic Review and Meta Analysis’, Journal of the Royal Society of Medicine, 106( 7). Available at: https://journals.sagepub.com/doi/10.1177/0141076813489680.
- Ruiz-Cantero, M. T., et al. 2019. “‘Governance Commitment to Reduce Maternal Mortality. A Political Determinant beyond the Wealth of the Countries’, Health and Place.” Elsevier Ltd 57 :313–320. doi:10.1016/j.healthplace.2019.05.012.
- The United Nations. 2018. “The Sustainable Development Goals.” Accessed 4 June 2019. https://www.un.org/sustainabledevelopment/sustainable-development-goals/
- Ugur, M., and N. Dasgupta (2011) Systematic Review Evidence on the Economic Growth Impacts of Corruption in Low-income Countries and Beyond. Available at: https://assets.publishing.service.gov.uk/media/57a08ab3e5274a27b2000709/Corruption_impact_2011_Ugur_report.pdf.
Data Appendix
Definitions
Under-five survival rate; We take the under-five mortality rate per 1000 live births (U5m) from ***, and the survival rate (U5S) is defined as
Maternal survival rate; we take maternal mortality rate per 100,000 live births (MMR) from ***, and the maternal survival rate (MMS) is defined as
Governance indicators
Worldwide Governance Indicators
The WGI reports aggregate and individual governance indicators for over 200 countries and territories over 1996–2019 for six governance dimensions (see ). These are composite indicators based on more than thirty data sources. Firstly, individual questions from the underlying sources are assigned to one of the aggregate indicators. The compilers then rescale the data to make it comparable across sources using the unobserved components model. The resulting composite measures are in units of a standard normal distribution with mean zero, running from −2.5 to +2.5 and higher values corresponding to better governance (Kaufmann, Kraay, and Mastruzzi Citation2010; Kaufmann and Kraay Citation2020).