
 ?Mathematical formulae have been encoded as MathML and are displayed in this HTML version using MathJax in order to improve their display. Uncheck the box to turn MathJax off. This feature requires Javascript. Click on a formula to zoom.
ABSTRACT
We analyse the attendance of professional football matches in England finding that it is related to unemployment over a very long period of time. More unemployment leads to lower attendances. Distinguishing between leagues, we find that the relationship is larger for lower leagues, i.e. attendances of lower quality football events are more sensitive to fluctuations in unemployment.
KEYWORDS:
I. Introduction
The choice to pay to attend a social event is based on a number of factors. Most primarily, the likely entertainment value provided by the event matters. Equally, however, as with any consumption decision, income constraints must play a role. Sport, and football in particular, is a highly popular activity in the United Kingdom, and hence can be found all around the country. Almost every town has a football stadium, with a team likely playing in one of the country’s professional leagues. On any given day, many thousands of fans will attend the matches of such football teams.
Football has long history in England. In October 1863, the Football Association (FA) was established. The principle of professionalism was accepted by the FA in July 1885. Attendance data on football events are available from 1888 onward when the Football League (FL) began. We analyse the extent to which economic conditions in particular influence attendance at such events. Our study aims at investigating whether national unemployment rates affect stadium attendance at the league level. Our focus is guided by the observation that for the period after the second World War football attendance first hit its all-time high whilst unemployment was very low in the postwar rebuild but subsequently achieved its postwar low in the 1980s when the English economy entered its deepest recession. Obviously, the possible relationship between unemployment and football attendance was noted but rarely taken to the test. We exploit the long history of attendance being recorded and the depth of the structure of these events, looking at the many competitions taking place in England over the years. As most competitions are hierarchical, this allows us to consider the different quality of sporting events on offer.
II. Background
Attendance at sporting events has been very commonly studied; not least because data on attendance numbers are widely published. Studies on football stadium attendance vary in the type of data used in the analysis: match club-level, seasonal club-level and seasonal league-level. Each type of study may investigate different potential determinants. When analysing match-level data potential determinants are loss aversion, quality of the opponent, weather conditions, recent performance of the home team, home advantage and the possibility to win a prize (championship, qualifying for a European tournament) or avoid relegation. When seasonal averages are used at the club level, many match-specific determinants disappear since they cancel out or become irrelevant. If seasonal averages at the league level are analysed the focus can be on socioeconomic determinants, cultural developments and changes in the football industry like increased televising of matches.
Only a few studies investigate the relationship between economic conditions and stadium attendance. These studies mostly investigate cross-regional variation in unemployment rates with sometimes the peculiar finding of a positive relationship between unemployment and stadium attendance (Baimbridge, Cameron, and Dawson (Citation1996)) which is attributed to spurious correlation of more popular clubs being located in high unemployment areas. Long-term studies using seasonal attendance data do not always capture the effects of changing economic conditions. Dobson and Goddard (Citation1995) for example analyse stadium attendance for professional football in England and Wales over a period of more 65 years. They are interested in the distribution of attendances between clubs eliminating calendar time effects by standardizing attendances for every season. Similarly, Reade (Citation2020) analyzes 130 years of match-level attendances from English football removing cyclical information by introducing seasonal-fixed effects.
Unemployment may have a direct effect on stadium attendance because football supporters who lose their job will have less money to spend. Furthermore, unemployment is a well-known indicator for cyclical fluctuations in the economy. Therefore, unemployment as an explanatory variable will also capture the effects of declining real wages and fears of future job loss accompanied by reduced consumer spending. This may affect stadium attendance since a ticket, especially a seasonal ticket, may be a relatively big expenditure. There are two studies that explicitly focus on the relationship between unemployment and stadium attendance. Van Ours (Citation2021) considers a number of top European leagues, including the Premier League in England. Analysing data from the early 1960s to the late 2010s, he finds evidence of a strong negative relationship between attendance and unemployment. Buraimo, Simmons, and Migali (Citation2021) consider lower league English football in and around the Financial Crisis and Great Recession, finding that attendances in these leagues went down substantially.
By focusing on unemployment, we ignore several potential determinants of long-term stadium attendances such as admission prices (Dobson and Goddard (Citation2001)), hooliganism (Jewell, Simmons, and Szymanski (Citation2014)), renovation and expansion of stadiums (Jakar and Szymanski (Citation2021)), changing composition of stadium crowds (Malcolm, Jones, and Waddington (Citation2000)). Nevertheless, none of these potential determinants can explain the cyclical variations in stadium attendance while as we will show variations in national unemployment go a long way in explaining fluctuations in average attendances at the league level.
III. Data and methodology
Data
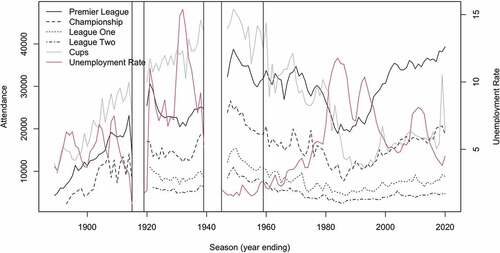
Our data are collected from two sources. We use attendance data from the website 11v11, and we collect unemployment data from the Bank of England’s ‘Millennium of Macroeconomic Data’ dataset. The developments of average attendances per season in English football since 1888 are presented in . Clearly, in the Premier League, there are substantial fluctuations over time.Footnote1 From the late 19 century, there is an increase in average attendance up to the First World War. After the Second World War initially attendances are substantially higher than in the inter-war period but after that there is a steady decline up to the mid-1980s. From the late 1980s onward, there is a strong increase in stadium attendance. These main developments are present also for lower league though less pronounced. also shows the developments in the unemployment rate, which by and large are a mirror image to attendances.
Figure 1. Average attendances per season in English football and the unemployment rate; 1888/89-2018/19.
Methodology
We use a simple regression of the log of attendance in competition
in season
on the log of the unemployment rate
at time
Footnote2
While appealing on an intuitive level, equation (1) may be misspecified. Not least, attendances from have strong serial dependence, but in addition, it may be that also the unemployment rate is non-stationary and trending. In Appendix A, we discuss this in more detail presenting evidence that equation (1) represents a cointegrating relationship.
IV. Results
In panel a of , we present the results from estimating equation (1) for the Premier League, the Championship and the Cup matches for which we have the longest time series. All coefficients of unemployment are negative and significant (Premier League at a 10% significance level). The coefficient values are decreasing in general with the quality of the football, that is, for the Premier League the coefficient is 0.134, while this is 0.235 for the Championship and 0.253 for Cup matches. Panel b of shows parameter estimates for the period from 1921/22 onward for which there is also information about League One and League Two. Now, all parameter estimates are significant at a 1% level where the magnitude for League Two is the largest. As shown in Appendix A, we can consider equation (1) to be the long-run relationship.
Table 1. Parameter estimates of stadium attendance, equation (1).
Our model relating stadium attendance to unemployment only is amazingly simple. Therefore, it is likely that not all fluctuations in attendance will be captured. Nevertheless, as shown in the relationship between the actual developments and the predicted stadium attendance according to the long-run relationship (equation 1) is quite strong. Apparently, many of the fluctuations in attendance are driven by fluctuations in unemployment and related socioeconomic developments.
Figure 2. Predicted and actual developments in attendance; 1921/22-2018/19.
Notably, Cup attendance is too high given the contemporary unemployment rate in the inter-war years, and too low in recent decades. Szymanski (Citation2001) argues that in FA Cup matches over time competitive balance dropped a lot and therefore stadium attendance decreased. In the second half of the 1960s, attendance was higher than expected. This could be attributed to England winning the World Cup in 1966. In the 1980s attendance was lower than expected given the unemployment rate. This may have to do with the negative attendance effects of hooliganism. Since the late 1990s, Championship attendances have been higher than would be expected given unemployment rates. The same holds in the past decades for attendances of Premier League matches. In the Premier League from about 1995 onward, stadiums were 80% full on average, creeping closer and closer to 100% since. So, there are capacity constraints since around 1995, but not before – even in the nadir in the 1980s, the top stadiums were not much more than half full. To investigate whether capacity constraints affected our main finding, we did separate estimates for the Premier League ignoring data after 2000. Then, we find a parameter estimate of −0.159 which is only slightly different from the estimate presented in (−0.134).
V. Conclusions
We describe a long-run relationship between attendances at social events, football matches, and unemployment conditions. We separate our analysis between different competitions, most of which sit within a hierarchy of quality. With higher quality events, the responsiveness of attendance to unemployment is lower. Clearly, a model with national unemployment rates as the only explanatory variable cannot explain fluctuations in stadium attendance in great detail. Nevertheless, our analysis shows that a simple model can go a long way is describing the sensitivity of sports fans to changing economic circumstances.
Acknowledgments
We thank three reviewers for their comments on an earlier version of our paper and thank Stefan Szymanski for making his data on stadium capacities in the Premier League and Football League available for analysis.
Disclosure statement
No potential conflict of interest was reported by the authors.
Notes
1 The names of the leagues have changed over time. We uses the current names. We also combine Division 3 North with Division 4, and Division 3 South with Division 3, motivated by the remarkable similarity of the two series before and after the regional distinctions were abandoned in 1959.
2 Unemployment rates are averages for calendar years. We assume that attendance in season is influenced by unemployment in year
.:
References
- Baimbridge, M., S. Cameron, and P. M. Dawson. 1996. “Satellite Television and the Demand for Football: A Whole New Ball Game?” Scottish Journal of Political Economy 43: 317–333. doi:10.1111/j.1467-9485.1996.tb00848.x.
- Buraimo, B., R. Simmons, and G. Migali. 2021. “Impacts of Great Recession on Sport: Evidence from English Football League Attendance Demand.” Oxford Economic Papers. forthcoming. doi:10.1093/oep/gpaa055.
- Dobson, S. M., and J. A. Goddard. 1995. “The Demand for Professional League Football in England and Wales, 1925-92.” The Statistician 44: 259–277. doi:10.2307/2348449.
- Dobson, S. M., and J. A. Goddard. 2001. The Economics of Football. second ed. Cambridge: Cambridge University Press.
- Jakar, G. S., and S. Szymanski. 2021. “Enduring Love: The Long-term Effect of a New Stadium on Attendance at Professional English Soccer.” mimeo.
- Jewell, R. T., R. Simmons, and S. Szymanski. 2014. “Bad for Business? The Effects of Hooliganismon English Professional Football Clubs.” Journal of Sports Economics 15 (5): 429–450. doi:10.1177/1527002514535169.
- Malcolm, D., I. Jones, and I. Waddington. 2000. “The People’s Game? Football Spectatorship and Demographic Change.” Soccer & Society 1 (1): 129–143. doi:10.1080/14660970008721254.
- Reade, J. J. 2020. “Football Attendance over the Centuries.” Discussion Paper University of Reading Discussion Paper, No. 2020–2028.
- Szymanski, S. 2001. “Income Inequality, Competitive Balance and the Attractiveness of Team Sports: Some Evidence and a Natural Experiment from English Soccer.” Economic Journal 111 (469): F69–F84. doi:10.1111/1468-0297.00599.
- Van Ours, J. C. 2021. “Common International Trends in Football Stadium Attendance.” PLoS ONE 16 (3): e0247761. doi:10.1371/journal.pone.0247761.
Appendix A:
Additional estimation results
A1. Testing unit roots and cointegration
The likelihood of spurious significance (Granger and Newbold, 1974) leads us to add in equation (1) – in the main text – lags of both attendance and the unemployment rate:
This revised model can be rearranged to nest equation (1) within it as the long-run relationship:
Here, ,
and
. Commonly, these are estimated via the least squares regression in equation (2) as the estimates are super consistent despite the potential non-stationarity of both variables. This approach is often referred to as the Engle-Granger method (Engle and Granger, 1987).
It allows us to consider both formally via testing, and less formally via graphical plots, the possibility of a long-run relationship between unemployment and football attendance. We are also able to consider the extent to which attendances adjust when this relationship is in disequilibrium, via the coefficient.
Table A1. Unit root testing and cointegration testing.
In Panel a of we present unit root tests for the unemployment rate and average seasonal attendances for the various competitions and the two periods of analysis. The p-value of the Augmented Dickey-Fuller (Dickey and Fuller, 1979) is presented, and as the null hypothesis is non-stationary, we can conclude that indeed each of these series is non-stationary.
An important step to making sense of the representation in (3) is to check that the long-run relationship from equation (1) is actually stationary. We check this in Panel b of , again reporting the p-value from an ADF test. This time the test is carried out on the residuals from the regressions estimated for equation (2) and reported in . We find that all of these residuals can be concluded to be stationary, as the test rejects in each case at a 1% level of significance.
Table A2. Parameter estimates equation (2).
A2. Parameter estimates equation (2)
The parameter estimates of (2) are presented in . The coefficients, being distributed across lags, are harder to interpret here, but the impact of the unemployment rate remains clear, suggesting that the relationship between the two variables is not spurious. Notably, despite the lag of attendance, a highly persistent variable, being included, unemployment remains significant in most regressions.
From equation (3) we understand the long-run relationship between attendance and unemployment, but also the adjustment to disequilibrium in that relationship, represented by . The first row of coefficients on panels a and b,
, gives estimates of
and hence
. All are negative, as would be expected if attendances adjust to correct for disequilibrium. The adjustment is largest for Cup matches, at
, and Championship matches (
), and smallest for League Two matches (
).
A3. Comparing predictions and actual developments
In the main text, we present graphs comparing predictions and actual developments. Rather than comparing predictions and actual developments, it can be illustrative to plot the residuals of the long-run relationships through time. Based on the parameter estimates of panel b of , this is done in . The residuals should be centred around zero, when the two variables are in equilibrium. If positive, it indicates that attendance is too high for a given level of unemployment, whereas if they are negative, then attendance is too low for a given rate of unemployment.
Figure 3. Long run relationships between average seasonal attendance in different English football competitions and the unemployment rate; 1920/21-2018/19.
The relationships are all moving around zero.
References
Dickey, D. A. and W. A. Fuller (1979). Distribution of the estimators for autcioregressive time series with a unit root. Journal of the American Statistical Association 74 (366), 427–431.
Engle, R. F. and C. W. J. Granger (1987). Co-integration and error correction: Representation, estimation and testing. Econometrica 55 (2), 251–276.
Granger, C. W. J. and P. Newbold (1974). Spurious regressions in econometrics. Journal of Econometrics 2, 111–120.