
 ?Mathematical formulae have been encoded as MathML and are displayed in this HTML version using MathJax in order to improve their display. Uncheck the box to turn MathJax off. This feature requires Javascript. Click on a formula to zoom.
ABSTRACT
In this article, we explore the causal relationship between wage share and economic growth for 11 Eastern European countries. The methodology used was wavelet coherency for the period between 1995Q1 and 2020Q4. Our results reveal that economic growth acts as the leading role for wage share increase for most Eastern European countries, and only for certain periods, wages can determine economic growth. Furthermore, we find that GDP increases cause wages to increase at different frequencies; there is a positive correlation between GDP growth and wage growth; the effects of wage-led growth policies were weak and only on short periods. Our estimations cast a high degree of uncertainty on the effectiveness of wage increase policies promoted by some national authorities to achieve economic growth.
I. Introduction
Since the 1990s, Eastern European countries have experienced several fundamental economic changes: the transition to a market economy, the financial crises of 1997 and 2008, accession to the EU (2004) and the Euro Zone (after 2010).
Eastern European countries have experienced increases in the minimum wage, from 80–120 euros in 2008 to 330–570 euros in 2020, while the average wage and benefits for all workers, from 300–550 euros in 2008 to 850–1200 euros in 2020. These growth policies have led to an increase in the wage share in the economy.
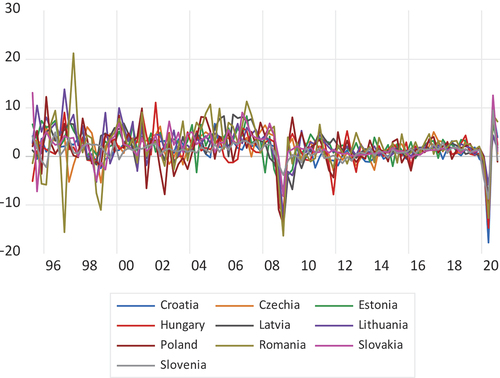
After 2008, Eastern European governments tried to adopt wage growth policies in order to achieve economic growth. All these changes have led to major reforms in all sectors of the economy, while the share of wages in the economy is just an example. If wage share in GDP was 30% in 2010, it rose to 40% in 2019 (). Another important change was the attempt to achieve healthy economic growth, which will eventually allow a catch-up to the Western states. As in the case of wage share, the oscillations in economic growth were significant: the years 1996–2000 brought a reduction of 15% and then the accession to the EU caused gains of 7–8% ().
Figure 1. Wages Share in Eastern Europe.Source: Eurostat
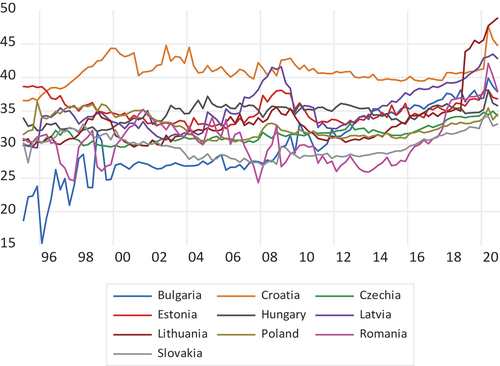
Figure 2. GDP growth in Eastern Europe.Source: Eurostat
After the 2008 crisis, Eastern European countries tried to find new ways to grow. The main solution used by the eastern politicians focused mainly on raising wages. Their hope was that this increase would increase global demand, which in turn would positively influence GDP.
The relationship between wage share and economic growth has caught attention in the recent years both theoretically (Growiec, McAdam, and Mućk Citation2018; Ibarra and Ros Citation2019; Abreu and Silva Lopes Citation2021) and empirically (Karabarbounis and Neiman Citation2014; Charpe, Bridji, and McAdam Citation2019), mainly for developed countries and for short periods.
In the late 1990s, we noticed a worldwide reduction in the share of labour in national income (Onaran and Obst Citation2016), contrary to the assumptions that this relationship is constant in the long term. However, this decrease can also have negative consequences on economic growth, by reducing it due to the increase in economic inequity and the decrease in global demand. Karabarbounis and Neiman (Citation2014) studied 59 countries for the period 1970–2012 and showed that there has been a global decline in labour share and an increase in capital. Onaran and Obst (Citation2016) analysed 15 EU countries from the perspective of wage share and economic growth: the decrease in income from wages leads to a decrease in GDP for 11 countries and stagnant for the other four countries. Charpe et al. (Citation2019), using wavelet methodology, analysed the long-term relationship between labour share and growth for France, the UK and the USA and showed that for short term it is negative and becomes positive for long term.
This study aims to test the conditionalities between wage share and economic growth in Eastern Europe to establish the direction and periods of influence. The article’s contribution to economic research is the use of wavelet methodology in the study of wage share growth in Eastern European countries and especially the study of co-movement between GDP growth and wage share, for the period 1995Q1–2020Q4.
The article is organized as follows: section II presents the methodology used and results, and the last section presents the main conclusions.
II. Methodology, data and empirical results
This article uses the wavelet methodology. The series used in the analysis are wages (WG) and gross domestic product (GDP) for the period 1995Q1–2020Q4. Nominal data (expressed in euros) are taken from Eurostat, the websites of statistical institutes and national banks. The economic growth is calculated as (GDPt − GDPt-1)/GDPt-1 × 100 and wage share growth as (wagesharet − wagesharet-1)/wagesharet-1 × 100.
The wavelet analysis methodology takes into account the lead/lag relations and causal relationships in frequency and time between the two series. The wavelet methodology in economics was developed by Grinsted, Moore, and Jevrejeva (Citation2004) and Aguiar-Conraria and Joana Soares (Citation2011) and starts from a single equation, called mother wavelet , which is defined according to scale (s) and time positioning (
). The wavelet methodology assumes that these are integrable square functions, i.e.
. The wavelet equation can be written as follows:
In Equation 1, the value represents a normalization factor to achieve unit variance of the wavelet
. The two parameters,
(represent the location that indicates the position wavelet) and s (depicts the wavelet space), are important values to analyse. In this article, we will use one variant of the wavelet methodology, the coherence (for the correlations between time series).
Wavelet power spectrum for an and
series is given by the following formulas (Rua and Nunes Citation2009):
for the
series, and
for
series
Wavelet coherence is calculated as the ratio of the cross-spectrum of and the product of the cross-spectrum of x and y, according to the formula (Grinsted, Moore, and Jevrejeva Citation2004):
where S is a smoothing operator for both time and frequency, and .
For the wavelet analysis, we chose the quarterly data for the 11 countries studied. The time considered in the study was 1995Q1–2020Q4, and the countries analysed were Bulgaria, Croatia, the Czech Republic, Estonia, Latvia, Lithuania, Hungary, Poland, Romania, Slovenia and Slovakia. The data studied were the quarterly series, in nominal value, for wages and GDP. All-time series were seasonally adjusted using the CensusX12 procedure, and the wavelet analysis was performed in MATLAB.
The wavelet coherence analysis shows the correlation that exists between two series in time and frequency. The time is represented on the horizontal axis and the frequency on the vertical. The interpretation of the graphs assumes that the areas drawn in red show stronger comovements (coefficient closer to 1) and the areas drawn in blue show weaker comovements between variables (coefficient closer to 0). The black outline for certain areas represents the level of significance of 5%.
The red colour of the figures shows that at certain frequencies and periods there is a strong correlation. If the red area is in the upper part of the graph, the correlation is in the short term, while if the area is in the lower part, the interaction is on the long term. Wavelet coherence allows a three-dimensional analysis between time, frequency and the correlation, which allows identifying short- or long-term structural changes. Furthermore, in order to test for structural changes, we use a Toda Yamamoto (TD) causality analysis for all the data.
The arrows show the direction of influence between the variables: to the right (→) indicates that GDP growth and wage share are positively correlated; to the left (←) indicates that GDP growth and wage share are negatively correlated. Arrows ↗ mean that GDP growth leads the wage share and ↖ indicate that wage share leads GDP growth. Arrows ↙ mean that GDP growth leads the wage share, while arrows ↘ indicate that wage share leads GDP growth. Straight up (↑) and down (↓) arrows imply that GDP growth is leading and lagging, respectively. For an overview of the analysis performed, we made .
Table 1. Summary of the wavelet coherence analysis for GDP growth-wage share in Eastern European countries.
The results for wavelet coherence are presented in . The GDP growth–wage share relationship in Eastern European countries show significant differences in short, medium and long term.
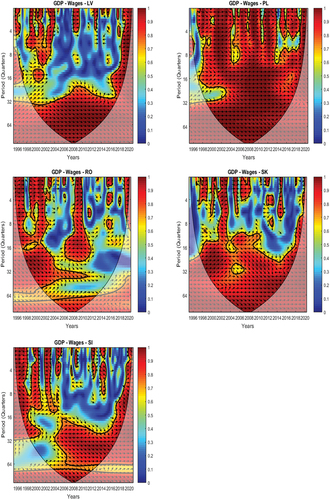
Figure 3. Wavelet coherence for GDP-wages: Bulgaria, Croatia, Czechia, Estonia, Hungary, Latvia, Lithuania, Poland, Romania, Slovakia and Slovenia.Source: own elaboration
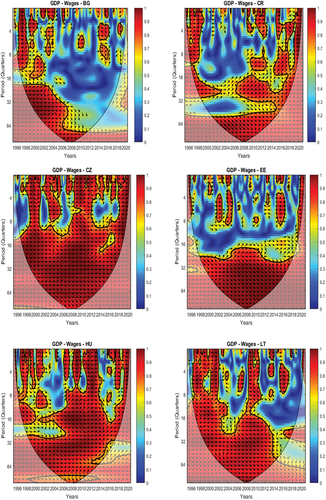
Figure 3. Continued.
For the short term (0–4), significant coherences (red zones) are manifested only for certain countries and periods. Furthermore, if there is a high correlation between variables, economic growth leads wage share. There are visible areas of interaction for different periods 1996–2000 (all Eastern countries), 2002–2004 (Bulgaria, Czechia, Hungary, Poland and Slovakia) and 2007–2010 (all countries, except Bulgaria, Croatia and Slovenia). The results are like those obtained by Karabarbounis and Neiman (Citation2014), Onaran and Obst (Citation2016) and Charpe, Bridji, and McAdam (Citation2019).
For the medium term (5–16), there are strong correlations between variables (dark red) between 1998 and 2000 (all countries, except Bulgaria and Estonia), 2002 and 2004 (all countries, except Croatia and Estonia) and 2008 and 2010 (all countries, except Bulgaria). The direction of the arrows, top right, shows that there is a positive correlation between economic growth and wage share. For periods 1998–2002 (Hungary and Latvia) and 2014–2016 (Lithuania and Slovenia), the arrows point to the top left. In this period, the wage share leads the economic growth, but with a negative sign, being in anti-phase ().
In the long term (17–64), for most of the Eastern European countries, we observe that the arrows are → and ↗, indicating that the economic growth drives wage share. The analysed variables are in-phase and positively correlated, the arrows being oriented to the right and up. For periods 1998–2004 and 2006–2014, in the cases of Croatia, Estonia, Romania, Slovakia and Slovenia, wage share leads the GDP growth. The correlation between the variables is positive, and the arrows are pointing to the bottom right (). The results are similar to those obtained by Karabarbounis and Neiman (Citation2014), Onaran and Obst (Citation2016) and Charpe, Bridji, and McAdam (Citation2019). Furthermore, in order to verify our wavelet analysis results, we use TY causality test depicted in . The TY causality results are similar to our initial ones.
Table 2. Toda Yamamoto Pairwise Causality Tests (F-Statistic, Prob.).
III. Conclusion
Based on the analysis, the relationship between GDP and wages is positively correlated, varying in the same direction and in favour of economic growth, for all Eastern European countries and periods (short, medium and long term). Meanwhile, the wage share is the leading factor only in some cases, namely: on short term, Bulgaria and Croatia; medium term, Hungary, Latvia, Lithuania, Slovakia and Slovenia; long term, Croatia, Estonia, Romania, Slovakia and Slovenia. Furthermore, wage share leads only in specific periods is country dependent.
The impact of wage-led growth policies in Eastern European countries is debatable: usually this impact took place before 2012 and was minor, with effects only in the medium term, not on long term. For economic growth, the main effects of wage growth policies are weak for Eastern European countries. There are countries that show differences in favour of wages, but the periods of influence are short (usually a few years) and usually before 2016. In addition, for Eastern European countries, the wage increase promoted by some national authorities did not lead to their expected GDP growth (exceptions Bulgaria, Croatia, Estonia, Romania, Slovakia and only for a short period). For these specific countries, the initial conditions generated by EU accession led to strong economic growth, which led to rising wages; subsequently, at the time of economic crises, the increase in previous wages was strong enough to generate economic growth afterwards.
Disclosure statement
No potential conflict of interest was reported by the authors.
References
- Abreu, D. S., and A. Silva Lopes. 2021. “How to Disappear Completely: Nonlinearity and Endogeneity in the New Keynesian Wage Phillips Curve.” Applied Economics Letters 28 (9): 774–778. doi:10.1080/13504851.2020.1781763.
- Aguiar-Conraria, L., and M. Joana Soares. 2011. “Business Cycle Synchronization and the Euro: A Wavelet Analysis.” Journal of Macroeconomics 33 (3): 477–489. doi:10.1016/j.jmacro.2011.02.005.
- Charpe, M., S. Bridji, and P. McAdam 2019. “Labor Share and Growth in the Long Run.” ECB Working Paper No. 2251.
- Grinsted, A., J. C. Moore, and S. Jevrejeva. 2004. “Application of the Cross Wavelet Transform and Wavelet Coherence to Geophysical Time Series.” Nonlinear Processes in Geophysics 11 (5/6): 561–566. doi:10.5194/npg-11-561-2004.
- Growiec, J., P. McAdam, and J. Mućk. 2018. “Endogenous Labor Share Cycles: Theory and Evidence.” Journal of Economic Dynamics and Control 87: 74–93. doi:10.1016/j.jedc.2017.11.007.
- Ibarra, C. A., and J. Ros. 2019. “The Decline of the Labor Income Share in Mexico, 1990-2015.” World Development 122: 570–584. doi:10.1016/j.worlddev.2019.06.014.
- Karabarbounis, L., and B. Neiman. 2014. “The Global Decline of the Labor Share.” The Quarterly Journal of Economics 129 (1): 61–103. doi:10.1093/qje/qjt032.
- Onaran, O., and T. Obst. 2016. “Wage-led Growth in the EU15 Member-states: The Effects of Income Distribution on Growth, Investment, Trade Balance and Inflation.” Cambridge Journal of Economics 40 (6): 1517–1551. doi:10.1093/cje/bew009.
- Rua, A., and L. C. Nunes. 2009. “International Comovement of Stock Market Returns: A Wavelet Analysis.” Journal of Empirical Finance 16 (4): 632–639. doi:10.1016/j.jempfin.2009.02.002.