
ABSTRACT
Google Trends (GT) has become a popular data source among researchers in a wide variety of fields. In economics, its main use has been to forecast other economic variables such as tourism demand, unemployment or sales. This paper questions the quality of these data by discussing the main data quality aspects according to the literature. Our analysis evidences some non-negligible issues related to the measurement accuracy of GT, which potentially affects the results obtained with GT data and therefore the decisions made with this information. These issues are illustrated with an example in which some queries to GT are repeated on six different days.
I. Introduction
The rise in popularity of digital media has brought an enormous growth in the number of data sources related to the digital footprint left by businesses and consumers (Blazquez and Domenech Citation2018). Such online data include sources such as social networking sites, corporate websites, and search engines, which have been used in a wide variety of research topics ranging from medicine (Pelat et al. Citation2009) or politics (Mellon Citation2014) to finance (Preis, Moat, and Stanley Citation2013).
Despite its increasing use in the literature, the quality of these non-traditional data sources has been largely overlooked. Data quality is a multi-dimensional concept which refers to the capability of data to be used quickly and effectively to inform and evaluate decisions. Issues with data quality, such as high measurement error, may impact on model parameter estimates and create economic inefficiencies (Bound, Brown, and Mathiowetz Citation2001).
Google Trends (GT) is a tool that provides reports on the popularity of certain searches in the Google search engine. Among the non-traditional data sources, GT is one of the most widely used in the empirical economic literature. It has demonstrated to be a good proxy for investor’s attention (Da, Engelberg, and Gao Citation2011), even during the COVID-19 outbreak (Shear, Ashraf, and Sadaqat Citation2021; Costola, Iacopini, and Santagiustina Citation2021). It is also widely applied in other applied economics topics, ranging from unemployment to tourism demand (Choi and Varian Citation2012; Jun, Yoo, and Choi Citation2018). However, its quality as a data source has not been assessed.
This paper addresses this gap by discussing the data quality aspects of GT following the framework proposed by Karr, Sanil, and Banks (Citation2006). Our analysis detects that GT data have some non-negligible quality issues, which are evidenced in an illustrative example.
II. Google Trends
Google Trends is a freely available tool developed by Google that provides reports with the popularity of searches in Google Search. Reports, which include time-series data, are available for any user-selected time period, from 2004 to the present day and can also be restricted to focus on searches done in a certain language or from a specific location.
The searches whose popularity is reported by GT may be specified as terms, entities or categories. Terms refer to the text or keywords included in the search box.
An entity is an abstraction to refer to a single semantic unit, such as a place, a person, an object, an event, or a concept. Since entities refer to the semantics, they are independent from which terms are used to refer to them (i.e. synonyms), or even the language used. Using entities also avoids the problem of polysemic terms because GT identifies them by their ID in Freebase, which is a collaborative knowledge base.
Google classifies all searches into categories, such as Finance or Sports. These can be used to filter out unrelated searches in GT reports for terms or entities. If no term or entity is selected, the report includes all the searches that fall in that category. This way, it is possible to study the popularity of all searches regarding one specific category.
The main GT output is the Search Volume Index (SVI), which is a time series representing the evolution of the popularity of a given search. This relative index is scaled to represent the highest popularity with an SVI value of 100. Notice that this normalization depends on the particular query to GT, so it depends on the specific search, period, language and geographical area that was selected. This means that it is not possible, for instance, to compare SVIs from different regions because values are relative to the total number of searches in each region.
III. Quality of data sources
The quality of data is, according to Karr, Sanil, and Banks (Citation2006), a wide multidimensional concept affecting different perspectives of the data source. Quality dimensions can be grouped into three different ‘hyperdimensions’ of the data source: i) The process, which is related to the methods to generate, assemble, describe and maintain the data; ii) the data, which refers to the data itself contained in the data source; and iii) the use, which is related to how the source is used. The evaluation presented in this paper focuses on the Data hyperdimension.
The analysis of the data quality can also be applied to different levels of the data source: i) the database, ii) the tables composing the database, and iii) the records composing the tables in the database. Unlike traditional data sources, GT is not a database with a set of tables, but a set of records returned as a response to a given user request. For this reason, it is not possible to apply data quality concepts to the database or table levels of GT.
Following Karr, Sanil, and Banks (Citation2006), the main quality dimensions of data at the record level are: accuracy, completeness, consistency and validity. These dimensions refer not only to the values of each attribute in the record, but also to the intra-record relationships. Below, we describe these quality dimensions and apply them to GT data.
Accuracy
It is related to whether or not the attribute value reports the true value. That is, this dimension is concerned with values measuring what they are expected to measure. Some statistical errors associated with the data, such as coverage biases, sampling defects or non responses, may characterize how accurate a source is.
GT presents an issue in terms of accuracy, derived from the fact that the reports are generated from a sample of searches made by users (Choi and Varian Citation2012). The sampling methods are not disclosed by Google, so it is not possible to quantify the sampling error. Although Google recognizes that results may vary just a few per cent day to day due to this, the variation could be significant, as Section 4 evidences.
The popularity of searches reported by GT is often considered as an indirect method for measuring the attention to a given event or topic. Although the actual value of this interest is generally not known, researchers should bear in mind the coverage bias inherent to GT. First, because it only represents the population with frequent access to the Internet (Steinmetz et al. Citation2014). Although it has increased over the years, it is still far from full coverage, especially in certain countries and group ages. Second, because GT can only collect what was searched for in Google Search. Google is the reference engine for general purpose searches. However, the increasing popularity of specialized sites or apps (such as Skyscanner or Booking) may affect the accuracy of GT for measuring interest in some topics.
Completeness
A record is complete when it includes values for all attributes. That is, records have no missing values.
GT includes data for all the observations, although it does not mean that a value is provided for each time period. Particularly, the value ‘0’ is reported when the search did not reach a minimum threshold of popularity. The frequency of these missing values depends on the popularity of the search in the specific region of interest. Since ‘0’ values precisely represent low popularity, the lack of completeness does not generally represent an important issue with GT data.
Consistency
It refers to the situation in which the relationships among the attribute values in the same record are valid. A lack of consistency is, for instance, a starting date after the end date.
GT reports the evolution of the search popularity in a two-attribute table: date and SVI. Since any relationship between values of both attributes is acceptable, no consistency issues may arise.
Validity
An attribute value is valid when it is within a pre-established domain of acceptable values. For example, a person’s age can only be a positive number. Ensuring attribute value validity is not enough for ensuring accuracy, although it is a necessary condition.
Data in GT reports are generally valid. Dates have well-formed values and SVI is usually between 0 and 100, as expected. However, there exist certain situations in which the SVI returns a non-integer value, particularly “<1“. This means that the search in that time period had enough volume to appear in the report, but less than 1/100th than the period with the highest popularity. GT uses this notation to avoid confusion with the ‘0’ value (which means missing data).
As in the case of completeness, this can be treated and does not represent an important issue. However, it highlights the lack of resolution of the SVI, as it only reports integer numbers.
IV. Empirical evidence
This section illustrates some of the accuracy issues detected above with a simple experiment. It consists of repeating the same query to GT on six different days and comparing the results.
Searches
This experiment was designed to reproduce the same searches as in Gunter, Önder, and Gindl (Citation2019), which aimed to forecast tourist arrivals to four Austrian cities. They consisted of four searches to the main Austrian cities, as defined in .
Table 1. Google Trends parameters in the experimental setting. Four searches, one per each search term, were explored
Repetitions
The four queries were submitted to GT on 4 February 2021, and repeated after one day, and weekly up to four weeks. This way, the results for each city were collected 6 times, resulting in 24 time series.
Results
represents the time series returned by GT on different dates. For the sake of clarity, only three of the six collection dates are shown here. As one can observe, the same queries do not always provide the same set of results. Notice that all these are queries with the exact same configuration, so one would expect that the same set of results is returned at all times. Although the oscillations in the time series are similar, the differences are far from being negligible. This is especially noticeable in the case of the ‘Graz’ search term, where the blue line diverges quite often from the other two lines.
Figure 1. GT reports of searches for four Austrian cities collected at three different dates.
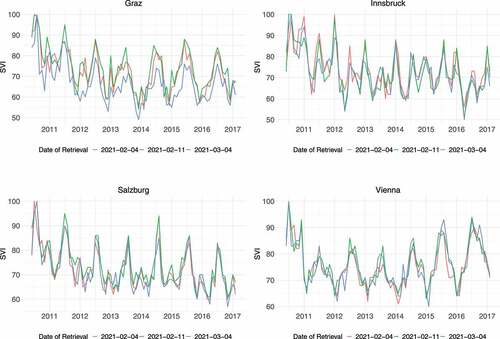
To quantify this dissimilarity, the Pearson correlation coefficient, r, between the GT results on 4 February 2021 and all the repetitions was computed. shows that r ranges from 0.79 to 0.94, with a decreasing trend in some of the series. Although the time series can be considered as highly correlated, they are far from the perfect correlation one would expect from a digital source. Therefore, this evidences that the data reported by GT is not completely accurate and includes some non-negligible measurement error.
Table 2. Correlation coefficient of the GT data on 4 February 2021 with GT data returned on different dates
To quantify how the measurement error could affect forecasts, some autoregressive distributed lag (ADL) models were trained following the specification described by Gunter, Önder, and Gindl (Citation2019). The models for all four cities were estimated six times, one per each retrieval of Google Trends data. After checking that the in-sample and out-of-sample errors are similar to those reported by Gunter, Önder, and Gindl (Citation2019), a monthly out-of-sample forecast was generated for the last year of data with an advance (h) of 1, 3 and 6 months. The range of these forecasts is shown in .
Table 3. Difference in forecast arrivals by retrieving GT data on different days and for different forecasting horizons (h)
Considering only the one-month ahead forecast, the difference between the highest and the lowest estimation of arrivals ranges from 2196 tourists in Innsbruck to 5949 tourist arrivals in Salzburg. The cases of Graz and Salzburg are particularly relevant because the forecast differences can reach up to above 5% of the monthly average of tourist arrivals.
The variability of forecasts derives from the lack of accuracy of GT data, as also observed in . The source of the inaccuracy is probably related to the internal process used by Google to compute the SVI, including here the fact that Google does not use the whole set of searches to compute it, but only a small sample with unknown characteristics.
V. Conclusions
Google Trends has become a very popular data source among researchers of a wide variety of fields over the last decade. After analysing the main quality dimensions of GT, some data quality issues arose. Those related to the accuracy of the data were considered as particularly relevant, as the lack of accuracy could become a significant source of bias, if it is not corrected. And, when data are used to estimate econometric models, it may affect parameter estimates that eventually would lead to making wrong economic or political decisions.
Our results highlight that the lack of accuracy of GT data is not negligible. Although these do not invalidate GT as a data source for social and economic analyses, little is known regarding the scope and the determinants of the inaccuracies. Future research works should explore and measure these issues in a wide variety of contexts to allow researchers to take remedial actions.
Acknowledgments
This work was partially supported by grants PID2019-107765RB-I00 and PEJ2018-003267-A-AR, funded by MCIN/AEI/10.13039/501100011033 and by “ESF Investing in your future”.
Disclosure statement
No potential conflict of interest was reported by the author(s).
Additional information
Funding
References
- Blazquez, D., and J. Domenech. 2018. “Big Data Sources and Methods for Social and Economic Analyses.” Technological Forecasting and Social Change 130: 99–113. doi:10.1016/j.techfore.2017.07.027.
- Bound, J., C. Brown, and N. Mathiowetz. 2001. “Measurement Error in Survey Data.” In Handbook of Econometrics, edited by J. J. Heckman, and E. Leamer, Vol. 5. The Netherlands: Elsevier.3705–3843. doi: 10.1016/S1573-4412(01)05012-7.
- Choi, H., and H. Varian. 2012. “Predicting the Present with Google Trends.” Economic Record 88 (s1): 2–9. doi:10.1111/j.1475-4932.2012.00809.x.
- Costola, M., M. Iacopini, and C. R. Santagiustina. 2021. “Google Search Volumes and the Financial Markets during the COVID-19 Outbreak.” Finance Research Letters 42: 101884. doi:10.1016/j.frl.2020.101884.
- Da, Z., J. Engelberg, and P. Gao. 2011. “In Search of Attention.” The Journal of Finance 66 (5): 1461–1499. doi:10.1111/j.1540-6261.2011.01679.x.
- Gunter, U., I. Önder, and S. Gindl. 2019. “Exploring the Predictive Ability of LIKES of Posts on the Facebook Pages of Four Major City DMOs in Austria.” Tourism Economics 25 (3): 375–401. doi:10.1177/1354816618793765.
- Jun, S.-P., H. S. Yoo, and S. Choi. 2018. “Ten Years of Research Change Using Google Trends: From the Perspective of Big Data Utilizations and Applications.” Technological Forecasting and Social Change 130: 69–87. doi:10.1016/j.techfore.2017.11.009.
- Karr, A. F., A. P. Sanil, and D. L. Banks. 2006. “Data Quality: A Statistical Perspective.” Statistical Methodology 3 (2): 137–173. doi:10.1016/j.stamet.2005.08.005.
- Mellon, J. 2014. “Internet Search Data and Issue Salience: The Properties of Google Trends as a Measure of Issue Salience.” Journal of Elections, Public Opinion and Parties 24 (1): 45–72. doi:10.1080/17457289.2013.846346.
- Pelat, C., C. Turbelin, A. Bar-Hen, A. Flahault, and A.-J. Valleron. 2009. “More Diseases Tracked by Using Google Trends.” Emerging Infectious Diseases 15 (8): 1327–1328. doi:10.3201/eid1508.090299.
- Preis, T., H. S. Moat, and H. E. Stanley. 2013. “Quantifying Trading Behavior in Financial Markets Using Google Trends.” Scientific Reports 3 (1): 1684–1690. doi:10.1038/srep01684.
- Shear, F., B. N. Ashraf, and M. Sadaqat. 2021. “Are Investors’ Attention and Uncertainty Aversion the Risk Factors for Stock Markets? International Evidence from the COVID-19 Crisis”. Risks 9: 1461–1499.
- Steinmetz, S., A. Bianchi, K. Tijdens, and S. Biffignandi. 2014. Improving Web Survey Quality. Chichester, UK: John Wiley & Sons, . chapter 12. 273–298.