
 ?Mathematical formulae have been encoded as MathML and are displayed in this HTML version using MathJax in order to improve their display. Uncheck the box to turn MathJax off. This feature requires Javascript. Click on a formula to zoom.
ABSTRACT
While outward FDI inflows have increased since 2008, the volume of Southeast Asia’s exports to China has slowed down, prompting discussion about whether this will affect Southeast Asia’s growth. This article empirically tests China’s impact on Southeast Asia’s growth using a nonlinear framework, and finds that economic linkages between Southeast Asia and China have been changing since the mid-1990s, especially during the 1997 and 2008 financial crises and the 2012 bilateral diplomatic change; that FDI is more important to economic growth than exports across Southeast Asia; and that there is no industrial technology gap between Southeast Asia and China.
I. Introduction
Southeast Asia’s trade and investment have become increasingly intertwined across national boundaries, with China seen as playing a crucial role in integrating these regional economies (Wong Citation1984) with China-centred production networks (Hong et al. Citation2020). Since 2008 many of Southeast Asian countries’ exports to China have slowed down. Explanations for this include the facts that China has graduated from labour-intensive production (Devadason Citation2011; Sznajderska and Kapuściński Citation2020), and that its move up the value chain (Azhar and Elliott Citation2006; Kee and Tang Citation2016) has reduced its reliance on Southeast Asia. As China’s imports from Southeast Asia have been commonly seen as important for the latter’s growth, a common view worries that it may significantly affect economic growth in Southeast Asia. The decreasing exports, however, have been accompanied not only by the falling prices of China’s domestic industrial materials but also by the rise in its outward FDI to Southeast Asia. China appears to have started trading with Southeast Asia in parts – not only final goods – and investing in producing components in vertical industrial spread (Kojima Citation1978).
While it is believed that export and FDI links with China are helping to anchor regional growth in Southeast Asia, it is still unconvincing to conclude that Southeast Asia’s growth has been China-led. This article is inspired by studies that empirically analyse the nexus in question. The common methodologies used in existing studies are linear-based (e.g. spatial panel models). But if nexus in question is not linear, these empirics may have overlooked some nonlinear complications (e.g. periodic factors), leading to incomplete conclusions. This article revisits Southeast Asia’s economic ties with China using both linear and nonlinear methodologies, with the aim of filling the gap in the scholarship.
The empirical findings in this article prove the nonlinear hypothesis true:
There is no linear causation between Southeast Asia’s exports to China and its own growth; Unlike exports, FDI is of higher importance across Southeast Asian countries.
Chinese FDI is concentrated in countries with good or high levels of industrial development in Southeast Asia, using their existing economic externalities to increase profit margins.
Southeast Asia’s growth has been affected more by global economic and political fluctuations, as the nonlinear tipping events are found around the 1997 and 2008 financial crises and at the time of China’s changing diplomatic stance towards Southeast Asia since 2012.
Section II, below, explains the date and methodology used; Section III discusses the empirical findings, and Section IV concludes this paper.
II. Data and methodology
Basic setup and data description
The factors investigated here are Southeast Asia’s economic links to China , estimated by the growth rate of Southeast Asia’s exports to China
and share of Chinese capital in the Southeast Asia’s FDI market
. Southeast Asia’s growth,
, is estimated by its real GDP growth rate. Official data from the China Statistical Yearbook, the World Bank’s World Development Indicators and the ASEAN Statistical Yearbook are used. Linear and nonlinear autoregressive distributed lag (
) methods are selected to ascertaining the nexus in question from 1995 to 2019.Footnote1
 model and causality test
Following Pesaran, Shin, and Smith (Citation2001), Equations (1–3) were formally investigated for cointegration:
The underlying error correction models () (Boswijk Citation1994) are associated with the long-run estimates as follows:
Further, threshold model from Li and Lee (Citation2010) was conducted, in Equations (7–9), to examine if there exist regime switch effects:
Here depicts the threshold values: can either be
, or
. After the nonlinear cointegration establishes, Equations (10–12) estimate the threshold
:
III. Econometric results and discussion
Tests for linear and threshold cointegration
Using equations with FDI (
), and export and FDI (
) as independent variables, the F-statistics (
=
and
=
respectively) are higher than the critical value of
at
confidence (Pesaran, Shin, and Smith Citation2001).Footnote2 However, when exports (
) is the dependent variable, the
=
shows results insignificant. Consequently, linear cointegration could only be established for equations (2) and (3).
Considering the nonlinear possibility mentioned above, equations (7–9) are tested for threshold . At the 99% confidence level, all results of
statistics surpass 23.88 critical value (Li and Lee Citation2010), indicating threshold cointegration established for Equations (7–9).
Identifying causalities between Southeast Asia’s growth and its economic ties with China
Accordingly, the s are tested for causalities. The results, in , confirm that under the linear framework: a) no linear causality is found from Southeast Asia’s exports to China and the former’s domestic growth; b) there is no short-run causation for FDI (column 2), c) but there is a weak causation for the combination of exports and FDI (column 4).
Table 1. Linear and threshold causalities from China’s exports and FDI to Southeast Asia’s growth, 1995–2019.
Furthermore, using nonlinear , estimations of exports, of FDI and of both combined in Southeast Asia’s GDP growth indicates negative coefficients of all error correction terms
. This implies Southeast Asia’s adjustment to shocks from Chinese economy has been effective. The underlying threshold causalities confirm that: a) in the short run, exports have a weak causal effect on Southeast Asia (column 1); b) in the long run strong causalities are present for all exports, FDI, and both combined in Southeast Asia’s GDP, c) with FDI the strongest regressor. The tipping years for Southeast Asian-Chinese economic relations are 1998–1999, 2009–2010, 2012–2014 (columns 1, 3 and 5), all around the times of the 1997 and 2008 financial crises and China’s shift in attitude to Southeast Asia in 2012.
Discussion
Empirically Southeast Asia’s absorption of China’s FDI is showing a stronger impact on GDP than its exports to China. Naturally, the rise in FDI, accompanied by slowing exports soon aroused concern within Southeast Asia: China may have moved up the industrial technology chain and begun increasing capital investment in organizing manufacturing networks in Southeast Asia.
Considering that the different specific effects on the individual countries of Southeast Asia may cancel each other out, hence affecting the result for Southeast Asia as a whole, the process in Equations and
is repeated for each Southeast Asian country. reports the results.Footnote3 As it shows, exports to China play a determining role in the GDP growth of five Southeast Asian member states (column 1). FDI inflows from China are generally significant in most of Southeast Asia’s member states, and particularly the ASEAN-6 (column 2). Apparently these countries, which are mostly developed and/or fastest-developing Southeast Asian economies, have had a favourable industrial basis for China’s trade and FDI.
Table 2. Export- and FDI-driven growth in Southeast Asia.
Benefiting from the same industrial diffusion from Japan, China is not largely advanced in manufacturing efficiency and is thus less likely to enhance the productivity of labour and capital in Southeast Asian hosting countries. This explains why, in , Southeast Asia’s GDP growth is not sensitive to China’s trade and FDI, although significant in empirical tests ().
Figure 1. Southeast Asia’s economic links to China and domestic GDP growth.
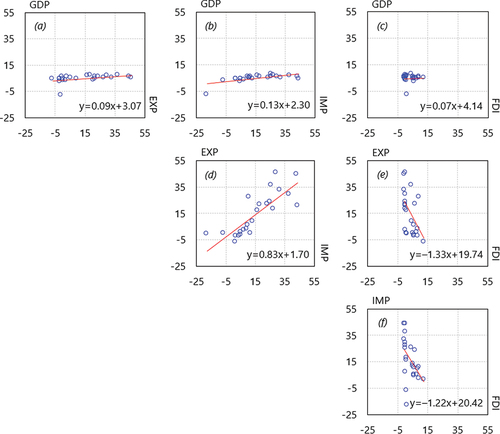
By contrast, the Southeast Asia-China economic nexus seems to be much more sensitive to economic and political international instability. Events in the year obtained in identify 1998/99, 2009/10 and 2012 as three tipping points in bilateral economic relations when China increased investment to catch the plummeting asset price in Southeast Asia after the 1997 and 2008 financial crises, and when bilateral relationship deteriorated due to the territorial dispute in the South China Sea since 2012.
Thus, although China’s efforts to promote industrial upgrading have somewhat reduced its reliance on imported inputs for production and Chinese manufacturers now have a more domestic-based supply chain and are moving into higher value-added production, the effects on Southeast Asia’s economic growth are not yet evident.
IV. Conclusion
With regime-switching effects, this article establishes strong causal links between Southeast Asia’s economic ties with China and its domestic growth. The enhanced power of the nonlinear analysis however implies that such ties are not linear: rather the two have been changing all the time.
Following individual country-based analysis, this investigation finds that there is no significant technology gap between Southeast Asia and China. Thus, rather than cultivating local growth, China’s trade with and FDI to partner Southeast Asian countries are likely to make use of existing externalities in their industries, pursuing trade profits and investment returns in Southeast Asia.
Disclosure statement
No potential conflict of interest was reported by the author(s).
Correction Statement
This article has been republished with minor changes. These changes do not impact the academic content of the article.
Notes
1 See Appendix A for the data description and unit root tests.
2 See Appendix B for the linear and nonlinear cointegration test results.
3 See Appendix C.
References
- Azhar, A., and R. Elliott. 2006. “On the Measurement of Product Quality in Intra-Industry Trade.” Review of World Economics 142 (3): 476–495. doi:10.1007/s10290-006-0077-5.
- Boswijk, P. 1994. “Testing for an Unstable Root in Conditional and Structural Error Correction Models.” Journal of Econometrics 63 (1): 37–60. doi:10.1016/0304-4076(93)01560-9.
- Devadason, E. 2011. “Reorganization of Intra-ASEAN Trade Flows: The ‘China Factor’.” Asian Economic Journal 25 (2): 129–149. doi:10.1111/j.1467-8381.2011.02058.x.
- Hong, M., S. Sun, R. Beg, and Z. Zhou. 2020. “Malaysia’s Exports to China: Does Diplomatic Relationship Matter?” Economic Papers 39 (1): 72–88. doi:10.1111/1759-3441.12270.
- Kee, H., and H. Tang. 2016. “Domestic Value Added in Exports: Theory and Firm Evidence from China.” American Economic Review 106 (6): 1402–1436. doi:10.1257/aer.20131687.
- Kojima, K. 1978. Direct Foreign Investment: A Japanese Model of Multination Business Operations. London: Groon Helm.
- Li, J., and J. Lee. 2010. “ADL Test for Threshold Cointegration.” Journal of Time Series Analysis 31: 241–254.
- Pesaran, H., Y. Shin, and R. Smith. 2001. “Bounds Testing Approaches to the Analysis of Level Relationships.” Journal of Applied Econometrics 16 (3): 289–326. doi:10.1002/jae.616.
- Sznajderska, A., and M. Kapuściński. 2020. “Macroeconomic Spillover Effects of the Chinese Economy.” Review of International Economics 28 (4): 992–1019. doi:10.1111/roie.12479.
- Wong, J. 1984. The Political Economy of China’s Changing Relations with Southeast Asia. New York: St. Martin’s Press.
Appendices
Appendix A. Summary statistics and unit root tests.
Appendix B.
Linear and threshold cointegration tests on Southeast Asia’s economic ties with China, 1995–2019.
Appendix C.
Threshold causalities from China’s exports and FDI to Southeast Asia’s economic growth, by country 1995–2019.