
 ?Mathematical formulae have been encoded as MathML and are displayed in this HTML version using MathJax in order to improve their display. Uncheck the box to turn MathJax off. This feature requires Javascript. Click on a formula to zoom.
ABSTRACT
This study investigates investors’ reaction to good/bad earnings news when faced with market- and industry-wide uncertainties. Our results provide little support for the discount rate explanation that investors’ reaction to good news is dampened during high market volatility. However, the results strongly support the learning hypothesis that earnings news provides value-relevant information for investors during periods of high-market volatility, but that investors cannot learn as much from earnings news under industry-wide uncertainty. These findings also support the conservation hypothesis that investors react more strongly to bad earnings news when faced with market-wide uncertainty.
I. Introduction
How do investors react to news when confronted with unfamiliar environments? Earnings news, the principal source of pivotal information for investors, contains market- and industry-wide information relevant to future cash flow estimations. Because uncertainty makes forecasting difficult, it affects how investors react to earnings news. This study tests three of the most commonly cited hypotheses in the economic literature on investors’ reaction to earnings news under uncertainty: learning, discount rate, and the conservation hypothesis. Specifically, we investigate investors’ reaction to earnings news under two types of uncertainty: market- and industry-wide uncertainty.
Market-wide uncertainty is systematic and arises from volatile market conditions and the state of the economy. Volatile markets are associated with volatility in firms’ future cash flows (Bloom Citation2009). Industry-wide uncertainty arises from a firm’s business engagements. For instance, tech firms have extensive investments in intangible assets that are characteristically ambiguous and subjective, making their financial information less precise (Kwon and Yin Citation2015) and forecasting future cash flows difficult. Moreover, uncertainty in a firm’s operational environment exacerbates investors’ perceptions of its future value (Cui and Zhang Citation2020).
Choi’s (Citation2018) learning hypothesis states that investors assign more weight to precise signals than noisy signals. When market conditions are volatile, investors face difficulty in predicting future cash flows. During these periods, investors can obtain valuable information about firms’ prospects from earnings announcements (Loh and Stulz Citation2018). Consequently, investors react more to earnings news during high market-wide uncertainty. Conversely, when investors receive imprecise information signals, as in the case of earnings announced under high industry-wide uncertainty, investors put less weight on the signal, and their reaction to earnings news is weak. The implicit prediction of this model is that investors react symmetrically to both good and bad news.
According to the discount rate hypothesis, investors update their beliefs about the future state of the outcome based on the information signals they receive. Information signals that contradict their prior beliefs about the future state of the outcome increase uncertainty and decrease future cash flows used in valuing firms (Gupta, Marfatia, and Olson Citation2020). Therefore, investors’ reaction is stronger during high-uncertainty periods (Huang, Lu, and Chen Citation2021). In addition, because investors are risk-averse, they require a higher risk premium for higher uncertainty since uncertainty engenders a return premium (Ang and Boyer Citation2010). Thus, information signals that increase uncertainty invoke a higher discount rate, whereas signals that are consistent with investors’ prior beliefs about the future outcome do not. Accordingly, the discount rate effect offsets the positive effect of good news in periods of high uncertainty. Under this hypothesis, if industry-wide uncertainty is idiosyncratic, it should not affect investors’ reaction to earnings news received under high industry-wide uncertainty.
The conservation hypothesis also views investors as uncertainty-averse, and uncertainty-averse investors take a conservative approach when making decisions by adopting a worst-case scenario (Ellsberg Citation1961). Neuroeconomics explains this behaviour as the activation of survival instincts when faced with decision making under uncertainty (Smith et al. Citation2002). The hypothesis predicts that when investors face uncertainty, they act cautiously and choose a cautious approach because high uncertainty amplifies the effects of bad news. Furthermore, investors react similarly to earnings news released under both high market- and high industry-wide uncertainty.
Utilizing the VIX index to capture market-wide uncertainty (Choi Citation2019) and industry classification to capture industry-wide uncertainty arising from the information imprecision associated with the nature of business, we find that investors’ reaction is consistent with the learning hypothesis: investors’ reaction to earnings news is stronger with market-wide uncertainty and weaker with industry-wide uncertainty. Supporting the conservation theory, investors react more to bad news when the market is volatile. However, there is little evidence to support the discount rate hypothesis. Further analyses show that the effects of industry-wide uncertainty on investors’ reaction predominate over those of market-wide uncertainty. Thus, industry-wide uncertainty from imprecise information exacerbates the difficulty investors face in learning from earnings news during periods of high market-wide uncertainty. These results support the learning hypothesis.
This study addresses how different types of uncertainty affect investors’ decisions. Prior studies have focused on firm-level uncertainty arising from firm-specific practices, such as earnings management or governance (Kyaw, Olugbode, and Petracci Citation2020). By estimating fixed-effects (FE) panel models across different industry groups, we capture the effects of the uncertainty associated with the nature of the business. Finally, this study investigates the interactive effects of these two types of uncertainty on investors’ reaction.
Section 2 discusses the study’s data and variables. Section 3 explains the results, and Section 4 concludes the study.
II. Data and variables
We collect annual earnings announcement dates, reported and forecasted earnings per share (eps), accounting, and financial data from 2002 to 2016 from Thomson Reuters Eikon. We exclude cases where a firm has two annual earnings announcements in the same calendar year or a negative market-to-book ratio. Further, we include only those earnings announcements with a minimum of 60 available returns before the announcement dates to estimate the market model. Our final sample consists of 12,466 observations from 1,620 firms.
The three-day cumulative abnormal return (car) centred on the annual earnings announcement day t is estimated from the market model using the returns from 253 days to 2 days before the announcement date.
We measure good/bad earnings news by using earnings surprises. We calculate earnings surprise (ue) as the difference between the reported eps and analysts’ mean eps forecast on the day before the announcement day scaled by total assets at the beginning of the year. The surprise can be either good or bad news: goodnews (badnews) takes the value of ue if ue is positive (negative), and zero otherwise.
The control variables are: earnings prospect, defined as the difference between analysts’ mean eps forecast on the day following the earnings announcement and the reported eps on the announcement scaled by the reported eps; the natural logarithm of market capitalization; the market-to-book ratio; the return on assets; the ratio of total debt to total assets; the market beta; the firm’s return over 250 trading days leading up to the two days before the earnings announcement; the natural logarithm of the number of shareholders whose shareholding is greater than 5%; and the natural logarithm of the number of analysts following a stock.
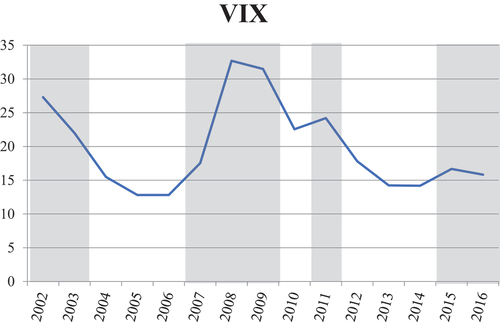
shows the evolution of the VIX during the sample period. We capture the difficulty investors experience in assessing firms’ prospects due to market-wide uncertainty through vixh, which takes the value of 1 when the standard-deviation-of-daily-VIX for the year is higher than the median standard-deviation-of-daily-VIX in the most recent five years. In , the grey periods show the high market-uncertainty periods, as indicated by vixh.
Figure 1. The highlighted years represent the years when the standard-deviation-of-daily-VIX for the year is higher than the median standard-deviation-of-daily-VIX in the most recent five years.
We capture the uncertainty arising from the nature of business through tech industries (tech) classified based on SIC codes, as in Chan, Lakonishok, and Sougiannis (Citation2001).Footnote1 Firstly, tech firms operate in a business environment that changes rapidly, which makes estimating their real value more complicated (Kohers and Kohers Citation2004) and consequently more ambiguous (Gomes, Gorton, and Madureira Citation2007). Secondly, tech firms have significant investments in research and development (R&D) and intangible assets, which are subjective and engender information asymmetry between firms and investors (Chan et al. Citation2006; Kwon and Yin Citation2015).
shows that tech firms are predominantly from the electrical equipment, measuring instruments, computer programming, and software industries. The number of observations more than doubled over the 15 years.
Table 1. Sample breakdown by year (Panel A) and industry (Panel B). The industry classification is based on the SIC code.
shows that car averages at 0.3–0.4%. Good (bad) earnings surprises from tech firms are generally larger than those from non-tech firms. Tech firms exhibit higher mtbv and have a larger number of analysts following the firms.
Table 2. Descriptive statistics. The table reports descriptive statistics for both tech firms (as indicated in Panel B, ) and non-tech firms. The sample consists of 1,620 US firms’ earnings announcements from January 2002 to December 2016.
FE panel regression model estimated is:
where represents car for firm i at time t,
is a vector of covariates,
denotes an unobservable time-constant firm-level fixed effect,
is an idiosyncratic error term, and
is a vector of coefficients to be estimated.
III. Empirical results
reports the estimation results. The interaction term vixhXgoodnews from Model (1) indicates that investors’ reaction to good news under a high market-wide uncertainty is not different from the reaction at any other time. However, vixhXbadnews indicates that investors react strongly to bad news when the market is experiencing high uncertainty. These results somewhat support the discount rate and conservation theory that investors’ reaction under market-wide uncertainty is dampened for good news and amplified for bad news. Re-estimations of EquationEquation (1)(1)
(1) across high versus low market-wide uncertainty periods in Models (2) and (3) respectively yield similar results. The coefficients for goodnews and badnews in Model (2) are higher during high market-wide uncertainty periods (1.8678 and 1.4083, respectively) than during low market-wide uncertainty periods (0.7813 and 0.5084, respectively). The results partially support the conservation theory but are in line with the learning hypothesis that investors learn from earnings news during high market-wide uncertainty periods. The negative and statistically significant coefficients of techXbadnews in the models show that investors react relatively less towards bad news from tech firms. These findings support the learning hypothesis that investors’ reaction to earnings news weakens with industry-wide uncertainty. The presence of different reactions to earnings news under industry-wide uncertainty is against the discount rate hypothesis, which postulates industry uncertainty to be idiosyncratic. The asymmetric reactions to good and bad news under industry-wide uncertainty partially support the conservation theory.
Table 3. Estimation results from EquationEquation (1)(1)
(1) using FE panel regression. Standard errors are clustered at the firm level. *,**,*** represent significance at 10%, 5%, and 1% respectively.
The weaker reactions to earnings news from firms with high industry-wide uncertainty during periods of high market-wide uncertainty (−0.7188 and −1.1007) suggest the importance of industry-wide uncertainty over market-wide uncertainty for investors facing both types of uncertainty. Model (4) reports the results from the re-estimation of EquationEquation (1)(1)
(1) with market-wide and industry-wide uncertainty indicator variables, which are then interacted with each other to investigate the effect of both types of uncertainty on market reaction. The interaction terms show similar results to those observed before: investors do not react differently to good news during high market-wide uncertainty (vixhXgoodnews), but react significantly strongly towards bad news during high market-wide uncertainty (vixhXbadnews). The negative coefficient of vixhXbadnewsXtech implies that industry-wide uncertainty weakens the market-wide uncertainty effect. These results suggest that investors do not learn much from earnings news released in times of market-wide uncertainty if industry-wide uncertainty is high. Therefore, these findings support the learning hypothesis over the conservation hypothesis.
IV. Conclusion
Investors react more under high market-wide uncertainty and less under high industry-wide uncertainty, and their reactions are asymmetric. The results support the learning explanation best, with some support for the conservation explanation but not the discount rate explanation.
Disclosure statement
The authors declare that they have no known competing financial interests or personal relationships that could have influenced the work reported in this study.
Additional information
Funding
Notes
1 Results from capturing industry-wide uncertainty through R&D intensity yielded similar results. They are available on request.
References
- Ang, J., and C. Boyer. 2010. “Knightian Uncertainty: Evidence of Uncertainty Premium in the Capital Market.” Applied Economics Letters 17: 945–949. doi:10.1080/17446540802599721.
- Bloom, N. 2009. “The Impact of Uncertainty Shocks.” Econometrica 77: 623–685.
- Chan, L. K., J. Lakonishok, and T. Sougiannis. 2001. “The Stock Market Valuation of Research and Development Expenditures.” The Journal of Finance 56: 2431–2456. doi:10.1111/0022-1082.00411.
- Chan, H., R. Faff, Y. Ho, and R. Ramsay. 2006. “Asymmetric Market Reactions of Growth and Value Firms with Management Earnings Forecasts.” International Review of Finance 6: 1–2, 79–97. doi:10.1111/j.1468-2443.2007.00060.x.
- Choi, H. 2018. “A Tale of Two Uncertainties.” Journal of Banking and Finance 92: 81–99. doi:10.1016/j.jbankfin.2018.04.007.
- Choi, S. 2019. “The Influence of Shock Signals on the Change in Volatility Term Structure.” Economics Letters 183: 1–5. doi:10.1016/j.econlet.2019.108593.
- Cui, H., and Y. Zhang. 2020. “Does Investor Sentiment Affect Stock Price Crash Risk?” Applied Economics Letters 27: 564–568. doi:10.1080/13504851.2019.1643448.
- Ellsberg, D. 1961. “Risk, Ambiguity, and the Savage Axioms.” Quarterly Journal of Economics 75: 643–669. doi:10.2307/1884324.
- Gomes, A., G. Gorton, and L. Madureira. 2007. “SEC Regulation Fair Disclosure, Information, and the Cost of Capital.” Journal of Corporate Finance 13 (2–3): 300–334. doi:10.1016/j.jcorpfin.2006.11.001.
- Gupta, R., H. Marfatia, and E. Olson. 2020. “Effect of Uncertainty on U.S. Stock Returns and Volatility: Evidence from over Eighty Years of high-frequency Data.” Applied Economics Letters 27: 1305–1311. doi:10.1080/13504851.2019.1677846.
- Huang, Y. S., Y. X. Lu, and Y. C. Chen. 2021. “Three Types of Fear Play Market Uncertainty: Evidence from Bank Loan.” Applied Economics Letters 28 (1): 70–78.
- Kohers, N., and T. Kohers. 2004. “Information Sensitivity of high-tech Industries: Evidence from Merger Announcements.” Applied Financial Economics 14 (7): 525–536. doi:10.1080/0960310042000216088.
- Kwon, S., and J. Yin. 2015. “A Comparison of Earnings Persistence in high-tech and non-high-tech Firms.” Review of Quantitative Finance and Accounting 44: 645–668. doi:10.1007/s11156-013-0421-5.
- Kyaw, K., M. Olugbode, and B. Petracci. 2020. “Is the Market Surprised by the Surprise?” International Journal of Disclosure and Governance 17: 20–29. doi:10.1057/s41310-020-00071-4.
- Loh, R., and R. Stulz. 2018. “Is sell-side Research More Valuable in Bad Times?” The Journal of Finance 73: 959–1013. doi:10.1111/jofi.12611.
- Smith, K., J. Dickhaut, K. McCabe, and J. Pardo. 2002. “Neuronal Substrates for Choice under Ambiguity, Risk, Gains, and Losses.” Management Science 48: 711–718. doi:10.1287/mnsc.48.6.711.194.