
 ?Mathematical formulae have been encoded as MathML and are displayed in this HTML version using MathJax in order to improve their display. Uncheck the box to turn MathJax off. This feature requires Javascript. Click on a formula to zoom.
ABSTRACT
This study examines how instant online video sharing affects artists’ musical streams during the pandemic. On average, the use of the TikTok app significantly increases artists’ streams, by approximately 5%. This increase is even higher for male, European and dj Mag 2020 new entry artists.
I. Introduction
Within only the last decade or so, social media platforms have significantly disrupted traditional modes of marketing and communication (Budzinski and Gaenssle Citation2018); the advent of the pandemic further boosted their use. The live events industry has been hit hard by Covid-19, so musical artists have flocked to new platforms providing instant online video sharing in order to attract and maintain consumer attention. Thus, TikTok snowballed into the most popular app in 2020 with a massive impact on the music business by creating a fan base, appeal,Footnote1 streams (Spotify) and ultimately generating incomes (Aguiar and Martens Citation2016; Aguiar Citation2017; Aly-Tovar et al. Citation2020).
However, while a number of studies have investigated relationships between social media platform activity and economic outcomes, to date there has been little research on how an exogenous shock, such as the pandemic, shifts this relationship. We contribute to further extending the literature towards attention economics and the concepts of audience building (audience attraction and maintenance), by examining how an exogenous shock impacts artists’ streams in the music industry (Wlömert and Papies, Citation2016). We fit a linear regression model with an interaction between Tik Tok use and pandemic period in order to explore how the effect of TikTok on streaming revenues changed after Covid.
II. Data
Our database consisted of dj-artists based on three criteria; (i) being listed as a dj on the djlist.comFootnote2 for at least one genre, (ii) being listed as a dj on the djranking.orgFootnote3 salary list, (iii) being active on Facebook, Instagram and Resident Advisor for the last five years. We identified the top 300 most popular artists and tracked their daily Spotify streams for the period 1 January 2018 to 1 January 2022. Our stream data came from Songstats, an Internet based streaming-measurement platform.
provides summary statistics on the sample, while focuses on the years 2019 and 2020. We note a higher increase for TikTok users in each category. We also observe that each distribution is heavily right-skewed with the mean often orders of magnitude above the median.
Table 1. Descriptive statistics.
Table 2. Spotify steams by subgroups.
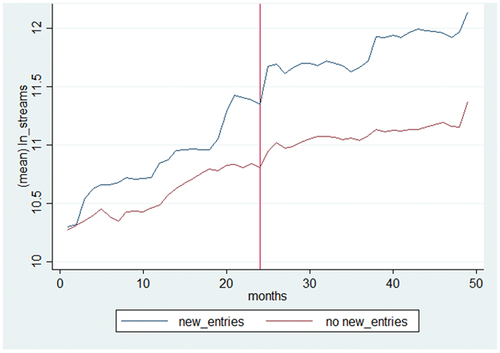
show the growth of streams for the whole sample and for the subgroups of males, European artists and artists being new entries in the dj Mag list of 2020 relative to females, non-European artists and artists who in the dj Mag list of 2019 (pre Covid-19 poll) and not in that of 2020. Figures, which are on a monthly scale, present evidence of a shift in Spotify streams for each pair of variables.Footnote4
Figure 1. Spotify streams over time.
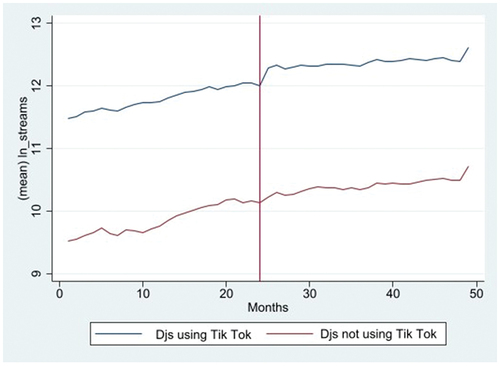
Figure 2. Spotify streams over time for male and female artists.
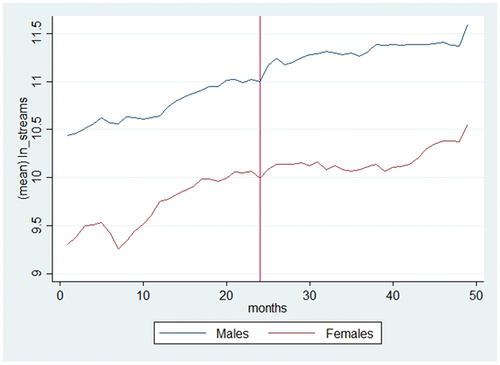
Figure 3. Spotify streams over time for European and nonEuropean artists.
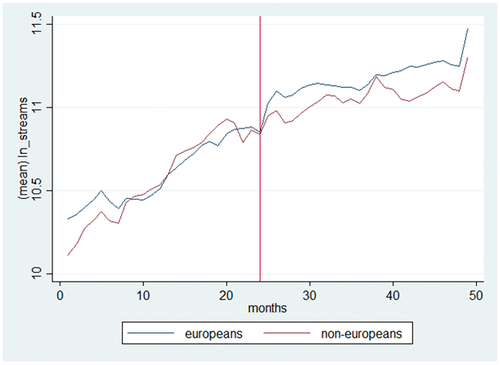
Figure 4. Spotify streams over time for new-entry artists and no-new entry artists.
III. Empirical analysis
To investigate the effect of TikTok usage on Spotify streams, we estimate the following regression model:
where ‘Streamsit’ is the number of unique streams of artist i on Spotify in day t. After indicates days after 1st of March 2020. TikToki refers to artists who used TikTok; Xi is a vector of variables, which includes demographic characteristics (i.e. age, gender); ξm is the months fixed effect; and ζi is the artist fixed effect. The coefficient of interest is β, which represents differential effects of the pandemic across artists additionally using or not using TikTok. In the simple model above, all artists in the TikTok group are implicitly considered equal in estimation, which implies β is the estimate of the additional impact of using TikTok after the pandemic. However, given that each artist in this group is also ranked by the dj Mag list of 2020, we followed the empirical strategy by Crosby, Lenten, and McKenzie (Citation2018), and we also estimated a modified regression specification as follows:
where ‘Ranked’ is the inverse of the actual ranking of the artist in the dj Mag poll and is converted to a number on the unit interval. This simple transformation associates a better outcome with a higher-ordinal number such that Ranked = [(−1)×Rank +101]/100, where Rank refers to the numeric dj Mag list rank.
includes results from the aforementioned specifications, subsequently referred to as ‘common effect’ (columns 1–4) and ‘ranked effect’ (columns (5–7). Estimates of the β coefficient confirm that artists that continued to use the TikTok app to promote their work (i.e. live acts), during the pandemic marked a 5.1% increase in Spotify streams in relation to artists who did not use TikTok (column 4). Given that, streaming is a very complex facet of the music industry, the results of the ‘ranked effect’ specifications identify dj Mag list,Footnote5 as an additional source of the increase of Spotify streams.Footnote6 Column 7 is showing the differential effect of ‘Ranked’ before and after the Covid-19 pandemic. More specifically, an artist that achieve higher rankings in the list, has an increase of their Spotify streams by 19.9%.
Table 3. Determinants of Spotify streams.
Lastly, we also explore whether certain artist attributes affect the estimations outlined above. We examined sub-samples of our data according to (i) their gender (i.e. male and female), (ii) whether the artist was European and (iii) whether the artist was a new entry on the Dj Mag 2020 list. supports a higher increase of Spotify streams for artists who are male, European and new entries. The aggregate combined results suggest an increase in stream growth, by approximately 29.6% (column 1), 17.4% (column 3) and 38.8% (column 5) for TikTok users being in the aforementioned categories, during the pandemic.
Table 4. Sub-Sample analyses by artist attributes.
Limitations
Our study comes with limitations. The main pitfall of our empirical analysis concerns the potential endogeneity issue that occur when exploring cause-and-effect relationship in our estimations. Artists’ existing trend for social media marketing strategies, may be the main reason why the error term can be correlated with the TikTok use after the Covid-19 occurrence. Hence, causality could be threatened, if dj artists coming from a particular musical genre and who are savvy about increasing Spotify streams are also the ones who are more likely to use TikTok. We tried to address this issue in three different ways. Firstly, our database consists of the most well-known dj artists, who they have more or less a similar profile of promoting their music and communicating with their audience. Secondly, we included artist and genre fixed-effects in order to minimize these sourced of potential endogeneity. Introducing individual fixed effects, allows to control for time invariant unobserved heterogeneity such as artists general interest on social media but this might rule out some artists learning more about digital apps and streaming over time. Lastly, we included in our models dj artists’ Facebook, Instagram and Resident Advisor number of fansFootnote7 as a way to control for differences on social media promotion strategies (Potts et al. Citation2008).
Conclusions
This study has studied the additional impact of using TikTok after the Covid-19 occurred and revealed that the use of TikTok as an online video sharing tool significantly increased Spotify streams, especially for male and European artists, during the pandemic. As a long-term effect, we found that the dj Mag 2020 artist ranking and the new entry status may be a result of using TikTok. While our findings are consistent with media tools affecting artist revenues and album sales, we cannot entirely rule out the influence of other contemporaneous changes in the music industry (Mortimer, Nosko, and Sorensen Citation2012).
A more general finding is that readily observable music stream metrics provide useful information that researchers can incorporate into studies of consumer behaviour and for better understanding digital music consumption (Peukert Citation2019). There are many possible practical implications of this type of data, which may establish a robust causal relationship between media tools and revenues, which we leave as an open invitation for future research outlines.
Disclosure statement
No potential conflict of interest was reported by the author(s).
Notes
1 Dj Mag list provides an important measure of success in its own right as it provides a proxy for an artist’s fan base. This metric has become as important as traditional variables used to measure appeal.
4 Different effects of the pandemic on the subgroups can shed light on the long-run effect of the pandemic on the shift in sources of revenues in the music industry.
5 This voting list is the priming source on which new dj artists and their songs become discovered.
6 Based on reports of TikTok’s prevalence on dance music industry over the last 24 months, the use of this online tool by dj artists has a strong positive correlation with their rankings on dj Mag list for year 2021, in which no dj gigs took place due to Covid-19 restrictions.
7 Data drawn by https://chartmetric.com/
8 The large value for chi-square in the Goodness of fit (gof) was an indicator that the Poisson distribution is not a good choice. A significant (p < 0.05) test statistic from the gof indicates that the Poisson model is inappropriate. We used nbreg Stata command which fits a negative binomial regression model for a nonnegative count dependent variable. In this model, the count variable is believed to be generated by a Poisson-like process, except that the variation is allowed to be greater than that of a true Poisson. This extra variation is referred to as overdispersion.
9 We expect similar to OLS results because on the distribution of Spotify we had not many zeros and low values close to zero values.
References
- Aguiar, L. 2017. “Let the Music Play? Free Streaming and Its Effects on Digital Music Consumption.” Information Economics and Policy 41: 1–14. doi:10.1016/j.infoecopol.2017.06.002.
- Aguiar, L., and B. Martens. 2016. “Digital Music Consumption on the Internet: Evidence from Clickstream Data.” Information Economics and Policy 34: 27–43. doi:10.1016/j.infoecopol.2016.01.003.
- Aly-Tovar, R., M. Bacache-Beauvallet, M. Bourreau, and F. Moreau. 2020. “Why Would Artists Favor Free Streaming?” Journal of Cultural Economics 44 (2): 255–280. doi:10.1007/s10824-019-09358-z.
- Budzinski, O., and S. Gaenssle. 2018. “The Economics of Social Media (Super-) Stars: An Empirical Investigation of Stardom and Success on YouTube.” Journal of Media Economics 31 (3–4): 75–95. doi:10.1080/08997764.2020.1849228.
- Crosby, P., L. J. Lenten, and J. McKenzie. 2018. “Social Media Followers as Music Fans: Analysis of a Music Poll Event.” Economics Letters 168: 85–89. doi:10.1016/j.econlet.2018.04.024.
- Mortimer, J. H., C. Nosko, and A. Sorensen. 2012. “Supply Responses to Digital Distribution: Recorded Music and Live Performances.” Information Economics and Policy 24 (1): 3–14. doi:10.1016/j.infoecopol.2012.01.007.
- Peukert, C. 2019. “The Next Wave of Digital Technological Change and the Cultural Industries.” Journal of Cultural Economics 43 (2): 189–210. doi:10.1007/s10824-018-9336-2.
- Potts, J., S. Cunningham, J. Hartley, and P. Ormerod. 2008. “Social Network Markets: A New Definition of the Creative Industries.” Journal of Cultural Economics 32 (3): 167–185. doi:10.1007/s10824-008-9066-y.
- Wlömert, N., and D. Papies. 2016. “On-Demand Streaming Services and Music Industry Revenues—insights from Spotify’s Market Entry.” International Journal of Research in Marketing 33 (2): 314–327. doi:10.1016/j.ijresmar.2015.11.002.
Appendix A
By taking into consideration that a musical stream data from Spotify is counted when someone listens for 30 seconds or more, we present also negative binomial regression estimatesFootnote8 in which results are based on the relevant count data (using the logarithmic values of the Spotify streams).Footnote9 shows the results.
Table A1. Negative binomial estimations on Spotify streams.
