
 ?Mathematical formulae have been encoded as MathML and are displayed in this HTML version using MathJax in order to improve their display. Uncheck the box to turn MathJax off. This feature requires Javascript. Click on a formula to zoom.
ABSTRACT
We study mildly explosive behaviour in house prices in Istanbul at both aggregate and disaggregate levels via GSADF tests. In contrast to previous studies, our results suggest multiple episodes of price exuberance in Istanbul and most districts. Most boroughs synchronically experienced explosive house prices in 2014–2015; and more powerfully during the last episodes of COVID-19. We also show that financial variables, including low mortgage interest rates and high stock prices, increased the probability of explosiveness.
I. Introduction
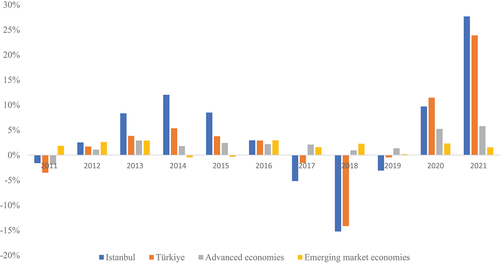
Istanbul, Europe’s largest city with a population of 15 million, leads the Turkish housing market (Gunduz and Yilmaz Citation2021). As the commercial, cultural, and historical capital, Istanbul generates 30% to Turkey’s GDP, and employs 20% of its industrial workforce. Over the past decade, Istanbul’s real estate market experienced remarkable growth (),Footnote1 particularly in the first half of the previous decade when it outpaced national averages by nearly threefold and exceeded the IMF’s global real house price index by tenfold. It is rated among the top five European markets for several years.Footnote2 During the COVID-19 pandemic, house prices in Istanbul again surged, although much of this increase was driven by rampant inflation rates.Footnote3 In response, the government passed a law in Summer 2022 capping rental price increases at a maximum of 25% of the previous year’s rent.
Figure 1. Annual growth rates of real house prices.
Also motivated by calls to study city-level housing bubbles (Coskun et al. Citation2020), this study investigates mildly explosive behaviour in house prices in Istanbul at both aggregate and disaggregate levels via the generalized supremum Augmented Dickey-Fuller (GSADF) test of Phillips et al. (Citation2015). It addresses one major issue in the existing housing literature, including Turkey, which is the reliance on aggregate/provincial data.Footnote4 Notably, this study stands out by analysing housing price dynamics at the district level. The paper has a dual purpose and novelty: firstly, it examines the presence of price exuberance in Istanbul and its densely populated districts, encompassing the period before and during the COVID-19 pandemic; secondly, it uncovers the factors driving exuberant housing prices, providing insights into the mechanisms underpinning housing bubbles. Thus, it holds substantial significance for policymakers.
In the next section, we introduce the dataset and conduct empirical analysis with relevant comments. We conclude the paper with final remarks and policy implications.
II. Data, methods and empirical analysis
Our dataset covers monthly house-price-to-rent ratios for Istanbul and its 33 districts during 2010m1-2022 m3. These ratios are based on valuation reports by real estate appraisal companies for mortgage loans by banks, representing the median price per square-metre of flats sold in Turkish Lira. We calculate the ratios using Istanbul’s monthly rent price index, following standard literature practices.Footnote5 Note that data after the introduction of the rental price cap are not included.
We employ the GSADF test of (Phillips, Shi, and Yu Citation2015) (PSY, hereafter) to detect explosive behaviour in housing markets. It is a right-tailed unit root test that performs recursive ADF regressions by allowing the sample window’s starting and ending dates to vary, thereby identifying and date-stamping the existence of explosive episodes in the house prices.Footnote6
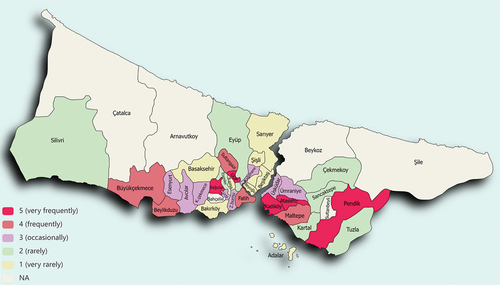
presents the results of the date-stamping procedure (backwards supremum ADF) of the test.Footnote7 The grey areas show episodes of exuberance (explosive periods) in the house price-to-rent ratio. We neglect short periods to evaluate the overall picture and require at least six consecutive months to label an explosive episode.Footnote8 Four main observations stand out. First, there is a synchronicity of explosive behaviour across most districts during 2014m7-2015m11, although the duration of exuberant episodes differs slightly across districts. Specifically, over two-thirds of the districts experienced synchronous price exuberance in 2015q1. It suggests the existence of a common factor contributing to housing price exuberance among districts, which is not explicit in aggregate-level studies. Policymakers should consider this synchronicity because it may signal a more robust transmission of the same regional or national shocks to local housing markets. Second, a remarkable distinction emerges from the explosiveness in Istanbul during 2013m1-2013m12. This bubble formation at the aggregate (city) level is absent in most districts and hence questions the relevance of employing aggregate series in housing bubble studies. In fact, Pavlidis et al. (Citation2019) show that exploiting disaggregated data can help identify such explosive episodes more successfully as aggregation lowers the power of right-tailed unit root tests. Third, a negative correlation exists between the number of explosive periods a district has and the level of house prices. That is, the districts with higher house prices experienced very little explosiveness, if any. For instance, Besiktas, Sariyer and Bakirkoy, at the top of the housing market in Istanbul with high average house prices, demonstrated explosive behaviour at the end of the COVID-19 pandemic. Geographically, these districts with scarce housing bubbles are located on the European side, most of which are also on the shores of the Bosporus Strait (). However, the differences in the length of explosive episodes across space and time deserve further study.Footnote9 Fourth, most of the districts experienced explosive house prices starting from the second half of 2021, and all districts unanimously entered 2022 with hot housing markets as soon as most pandemic restrictions were lifted.Footnote10 This phenomenon parallels what has been witnessed worldwide during the pandemic, i.e. housing prices rising globally at record levels which starkly contrasts with what happened before. Put simply, there was an increase in the number of districts having exuberant house prices as soon as the pandemic restrictions started to be lifted.
Figure 2. Date-stamping explosiveness in house-price-to-rent-prices in Istanbul and districts.
Figure 3. Classification of explosive districts.
After identifying the exact dates of exuberance in Istanbul house prices, we run dynamic probit and logit models to evaluate the in-sample predictive ability of several macroeconomic variables.Footnote11 The models are expressed by:
where the occurrence of exuberance is a dummy variable taking the value of 1 in the case of exuberance and 0 otherwise. Lagged exuberance variable
is included to control for the effect of previous period’s exuberance.Footnote12
represents the vector of predictor variables as shown in . Our choice of predictor variables is based on the literature and Turkish context but is also dictated by the availability of monthly data.
Table 1. Estimation results.
presents results using maximum likelihood.Footnote13 The dynamic models (with the lagged dependent variable) have higher R2 and lower information criterion. The results are, however, similar across all models.Footnote14 The mortgage interest rate and stock market index have strong predictive content. Put differently; easy housing loan conditions increase the likelihood of explosiveness in the housing market. Additionally, wealth effects generated via the stock market are important for urban house prices, as Kakes and Van den End (Citation2004) suggested.
III. Conclusion
This paper investigates mildly explosive behaviour in the Istanbul housing market at aggregate and disaggregate levels both prior to and during the pandemic. We find numerous instances of exuberant house prices in Istanbul and its districts over the past decade. In 2014 and 2015, most districts simultaneously witnessed explosive house prices, and almost all districts experienced hot housing markets in 2022 once pandemic restrictions were lifted. Additionally, financial factors like low mortgage rates and high stock prices increased the likelihood of housing price explosiveness. Normalization in house prices is expected if interest rates rise and policy supports are withdrawn.
Our findings yield key policy insights. District house prices influence broader trends, presenting both opportunities and challenges in addressing housing inflation. National policies, like interest rate adjustments, can effectively combat local housing price inflation, but poorly conceived local policies can become challenging national issues.
Furthermore, we find that expensive houses tend to avoid bubbles, indicating market maturity. Metro politan municipality housing policies should consider district-level characteristics rather than adopting one-size-fits-all approaches. For instance, the wealth effect from a thriving stock market may impact less affluent areas more than prosperous districts.
Finally, policymakers should prioritize local-level research and data collection to study the duration and patterns of price explosiveness in various regions and timeframes. Subsequently, they can utilize real-time monitoring techniques such as the GSADF methodology to establish early warning systems for identifying housing price exuberance (a)synchrony across districts.
Disclosure statement
No potential conflict of interest was reported by the author(s).
Notes
1 See also The Financial Times, Chart of the week: Turkey’s real estate boom isn’t slowing yet. https://www.ft.com/content/0f7b7bfd-ef4b-3625-99b0-9f8320ddcd4a
4 For example, Cagli (Citation2019) and Ceritoglu et al. (Citation2019) tested explosive behaviour in Turkish housing markets at regional (NUTS-2) levels, without exploring causes of explosiveness.
5 We also used real house prices for robustness, and our results remained consistent, only indicating fewer explosive months in some cases, which was expected because the rent price index is a subcomponent of the CPI and is comparatively more stable, whereas the CPI includes other items, such as volatile food and energy prices.
6 See PSY for a broader discussion of GSADF and alternative specifications.
7 The GSADF test results support the explosive behaviour at 5% significance in most housing markets except Bakirkoy, Besiktas, Sariyer, Beyoglu and Sisli, some of which, however, display explosiveness during the COVID-19 pandemic. These districts are all located on the European side and are mostly neighbours of each other.
8 PSY label an episode explosive when that period (a month in our case) exceeds the critical value.
9 See Genc et al. (Citation2022) for different price responses of districts to an external shock.
10 A simple bivariate regression analysis shows that easing the strictness of lockdown-style policies (stringency index at https://www.bsg.ox.ac.uk/covidtracker) explains more than two-thirds of the change in Istanbul’s districts with explosive house prices during 2020 m3–2022 m3.
11 Recently, there has been an increase in network-based models addressing the complex interconnectedness of socioeconomic systems. Once local-level data are available, it will be worth studying the drivers of explosive price interconnectedness in housing studies using multiplex network analysis. See Batrancea et al. (Citation2022) for empirical implementation in a different setting.
12 We made several attempts to find the optimal model as there is lack of guidance on selecting the form and lagged orders of dynamic probit model given limited sample size.
13 We ensured the stationarity and correct model specification.
14 Eliminating insignificant variables through the general-to-specific approach does not change our main finding.
References
- Batrancea, L. M., M. A. Balci, Ö. Akguller, and L. Gaban. 2022. “What Drives Economic Growth Across European Countries? A Multimodal Approach.” Mathematics 10 (19): 3660. https://doi.org/10.3390/math10193660.
- Cagli, E. C. 2019. “Explosive Behaviour in the Real Estate Market of Turkey.” Borsa Istanbul Review 19 (3): 258–263. https://doi.org/10.1016/j.bir.2018.10.002.
- Ceritoglu, E., S. M. Cilasun, U. Demiroglu, and A. Ganioglu. 2019. “An Analysis to Detect Exuberance and Implosion in Regional House Prices in Turkey.” Central Bank Review 19 (2): 67–82. https://doi.org/10.1016/j.cbrev.2019.06.002.
- Coskun, Y., U. Seven, H. M. Ertugrul, and A. Alp. 2020. “Housing Price Dynamics and Bubble Risk: The Case of Turkey.” Housing Studies 35 (1): 1–37. https://doi.org/10.1080/02673037.2017.1363378.
- Genc, I. H., L. Gunduz, and M. H. Yagmur. 2022. “Impact of Syrian Refugees on House Prices in Istanbul.” Applied Economics Letters 1–5. https://doi.org/10.1080/13504851.2022.2138807.
- Gunduz, L., and M. K. Yilmaz. 2021. “Club Convergence and Drivers of House Prices Across Turkish Cities.” International Journal of Emerging Markets. https://doi.org/10.1108/IJOEM-10-2020-1157.
- Kakes, J., and J. W. Van Den End. 2004. “Do Stock Prices Affect House Prices? Evidence for the Netherlands.” Applied Economics Letters 11 (12): 741–744. https://doi.org/10.1080/1350485042000254863.
- Pavlidis, E., E. Martínez-García, and V. Grossman. 2019. “Detecting Periods of Exuberance: A Look at the Role of Aggregation with an Application to House Prices.” Economic Modelling 80:87–102. https://doi.org/10.1016/j.econmod.2018.07.021.
- Phillips, P. C. B., S.-P. Shi, and J. Yu. 2015. “Testing for Multiple Bubbles: Historical Episodes of Exuberance and Collapse in the S&P 500.” International Economic Review 56 (4): 1043–1078. https://doi.org/10.1111/iere.12132.