
 ?Mathematical formulae have been encoded as MathML and are displayed in this HTML version using MathJax in order to improve their display. Uncheck the box to turn MathJax off. This feature requires Javascript. Click on a formula to zoom.
ABSTRACT
We analyse the impact on liquidity of a reduction of the minimum tick size to sub-cent levels at the Vienna Stock Exchange. We find no effect, even after controlling for the extent to which stocks were constrained by the pre-change tick size. Our results imply that regulator-imposed lower bounds on the tick size are not necessarily harmful, and they fail to confirm the existence of a u-shaped relation between tick size and illiquidity as predicted by theoretical models.
I. Introduction
The minimum tick size (MTS) affects liquidity directly (because it determines the minimum admissible bid-ask spread) and indirectly via trader behaviour. Absent MTS regulation, competing trading venues tend to reduce tick sizes (Foley, Meling, and Ødegaard Citation2023). Regulators favour economically meaningful tick sizes, as evidenced by regulations in the US and the EU.
Whether there is an ‘optimal’ MTS is an open question. Graziani and Rindi (Citation2023) propose a model in which the welfare-maximizing MTS is non-zero and depends positively on asset value and negatively on liquidity. Thus, depending on asset value and liquidity, a decrease in the MTS can be welfare-enhancing or welfare-decreasing. The authors also argue that the best available welfare proxy is the bid-ask spread, thereby supporting the usual approach of empirical studies to use the spread as the dependent variable when analysing the implications of MTS changes. Several empirical studies conclude that MTS reductions decrease spreads but decrease depth as well (e.g. Foley, Meling, and Ødegaard Citation2023; Goldstein and Kavajecz Citation2000; SEC Citation2012).
We use a difference-in-differences approach to analyse how a reduction in the MTS affects the liquidity of stocks at the Vienna Stock Exchange (VSE). Our paper makes two contributions to the literature. First, we provide evidence from a small developed country, Austria. Previous research has focused on large markets, mostly the US. Because equity markets in smaller countries may generally be less liquid, the same MTS change may (as also suggested by the model of Werner et al. Citation2022) have different implications for liquidity in small versus large countries. Second, we analyse an MTS change resulting in sub-cent tick sizes whereas most previous papers consider MTS changes involving higher tick size levels (e.g. reductions from eights to sixteenths or from sixteenths to cents (Bacidore Citation1997; Goldstein and Kavajecz Citation2000), or the MTS increase from 1 to 5 cents mandated by the SEC’s tick size pilot (Griffith and Roseman Citation2019)). Considering sub-cent tick sizes is important to understand whether there is indeed a non-monotonic relation between MTS and illiquidity. Our results are thus relevant for investors, trading venue operators and regulators alike, and they may inform future tick size regulations.
II. Institutional background and data
Trading on the Vienna Stock Exchange (VSE) takes place on XetraⓇ, an electronic open limit order book. Our sample stocks are listed in the VSE’s prime market segment. Inclusion in this segment requires that a stock has been admitted to the Official Market and meets additional requirements, such as the publication of semi-annual financial reports and the adoption of a Corporate Governance Code. Each stock in the prime market segment has at least one designated market maker.
Until 25 June 2010, the MTS was 1 €-cent for all stocks. On 28 June 2010 a new tick size regime became effective. It made the MTS a stepwise function of the price. The new MTS was €0.001 for stocks trading at prices below €10, €0.005 for stocks trading at prices between €10 and €49.995, €0.01 for stocks trading at prices between €50 and €99.99, and €0.05 for stocks trading at higher prices.
We start from all stocks listed in the VSE prime market segment. We require that all necessary data are available for 50 trading days before and after 28 June 2010, and in addition for at least 110 trading days during 2010. Of the 31 Austrian stocks in the resulting sample, 30 traded at prices below €50 and only one traded at a price above €50. Consequently, the change in the tick size regime implied a decrease of the MTS for 30 stocks and a constant tick size for only one stock. We therefore cannot use Austrian stocks as control group for a difference-in-differences analysis. We rather use German stocks. They trade on the same trading system, XetraⓇ, but did not experience an MTS change during our sample period.
To create the control sample, we apply the same criteria as for the Austrian stocks and identify 105 German stocks (included in one of the indices DAX, MDAX or SDAX). We use nearest-neighbour matching without replacement based on the variables market capitalization and price level (on 25 June 2010, sourced from Refinitiv Eikon Datastream) to find a German match for each Austrian stock. We require that data for matched stocks is available for at least 95% of the trading days in 2010 on which the corresponding Austrian stock traded. Otherwise, a new match is selected.
The data for the main analysis are from Finance Research Graz Data Services (FiRe Graz DS; Johann et al. Citation2023) for the Austrian stocks and from the Market Microstructure Database Xetra (MMDB-Xetra; Johann et al. Citation2018) for the German stocks. Both data bases contain daily aggregates, calculated from high-frequency intraday data, on various measures of trading activity and liquidity. We use as (daily) measures of market quality the percentage quoted spread (time-weighted average of intraday quoted spreads), the percentage effective spread (value-weighted average of the effective spreads of all trades during the day), and the depth at the best quotes (time-weighted average). We further use as control variables the midpoint volatility (obtained from 5-minute quote midpoint returns) and the trading value (number of shares traded multiplied by the share price and averaged over all trades of the day). MMDB-Xetra does not provide data for 29 June and 30 June, 2010. We therefore exclude these two days from the analysis.
The descriptive statistics in reveal that the matching procedure works well. The German stocks have slightly higher market capitalization (€2.24 bn versus €2.07 bn) and price level (€19.63 versus €19.29) than the Austrian stocks. The spreads of the Austrian stocks are markedly higher than those of their German matches (0.51% versus 0.29% for the quoted spread and 0.52% versus 0.30% for the effective spread). These differences cannot be explained by differences in volatility because the average volatility is very similar in both samples. Average depth is higher for Austrian stocks (€23,535 versus €16,469), as is the average trade size (€9,425 versus €7,802).
Table 1. Descriptives (based on daily observations from 2010) for 30 Austrian stocks matched with German stocks.
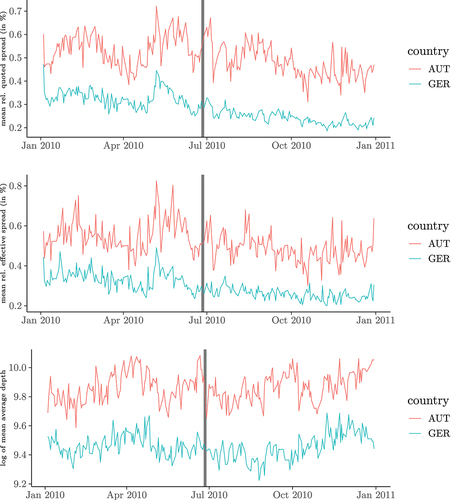
plots cross-sectional averages of our three measures of market quality for the treatment and the control group. The pre-treatment patterns are very similar, supporting the implicit assumption of parallel trends.
Figure 1. Evolution of cross-sectional average liquidity measures over time.
III. Results
We estimate standard difference-in-differences regressions,
denotes the respective liquidity measure
(i.e. relative quoted spread, relative effective spread, and logarithm of average euro depth) of stock
on day
.
equals one for each stock
from 28 June 2010 onward, and zero otherwise.
equals one [zero] for stocks in the treatment [control] group. The interaction term (
equals one for treated (=Austrian) stocks from 28 June onward, and zero otherwise. We report results for model specifications with and without the control variables (X) midpoint volatility and trading value. Standard errors are clustered at the stock level. We also estimate specifications with stock fixed effects and stock and day fixed effects. The results are similar to those of the baseline specifications.
We present the results in . The coefficients on and
indicate that quoted and effective spreads are lower after 28 June and are generally higher for Austrian stocks than for their German matches. The latter result confirms the findings from the descriptive analysis in , as does the result that depth is higher for the Austrian stocks. The coefficients on the control variables have the expected signs and are significant in all specifications. Spreads increase and depth decreases in volatility, and the reverse holds for the average trading value. Most importantly, the coefficients
on the interaction term are small and not statistically significant for all three measures of liquidity. The results thus imply that the change in the MTS at the VSE did not have a significant impact on liquidity.
Table 2. Difference-in-differences analysis for 30 Austrian stocks matched with German stocks. ’post’ is 1 [0] for each stock after [before] 28 June, 2010; ’treatment’ is 1 [0] for Austrian [German] stocks. sq/se/ln depth are the relative quoted spread/relative effective spread/logarithm of average euro depth.
These insignificant results may be a consequence of averaging over stocks with different levels of liquidity. It could be the case that the MTS reduction increased liquidity for stocks where the tick size constraint was binding in the old regime but decreased liquidity for other stocks. We therefore calculate for each Austrian sample stock the ticks per spread ratio (Foley, Meling, and Ødegaard Citation2023),
where is the quoted spread in euros on day
, and
is the MTS for Austrian stocks prior to the change in the MTS regime, i.e. €0.01. Based on the average of the
ratio (calculated over the period June 1–25, 2010) we sort the sample stocks into terciles. Stocks in the first [third] tercile are classified as ‘constrained’ [‘unconstrained’]. We then repeat the difference-in-differences analysis separately for the stocks in the first and third tercile (using the same German matches as before).
The results, shown in , are consistent with those shown before. Specifically, the coefficients on the interaction term are insignificant in all 12 specifications (three liquidity measures, first and third tercile, controls included or excluded). Thus, the reduction of the MTS did not affect the liquidity of the sample stocks irrespective of the degree to which the tick constraint was binding before the regime change.
Table 3. Difference-in-differences analysis for Austrian stocks, sorted into terciles according to their ratio, matched with German stocks. ’group 1’ (’group 3’) comprises stocks in the first (third) tercile. See caption of table 2 for further details.
Overall, our finding are inconsistent with the belief that ‘lower is better’ for the minimum tick size. However, while we do not find a liquidity improvement upon the reduction of the MTS, we also do not find a deterioration of liquidity. Our results thus do not confirm a u-shaped relation between tick size and illiquidity. There are two potential explanations for this finding. Either there is no such u-shaped relation, or it will only become visible when tick sizes are reduced even further.
Disclosure statement
No potential conflict of interest was reported by the author(s).
Additional information
Funding
References
- Bacidore, J. M. 1997. “The Impact of Decimalization on Market Quality: An Empirical Investigation of the Toronto Stock Exchange.” Journal of Financial Intermediation 6 (2): 92–120. https://doi.org/10.1006/jfin.1997.0213.
- Foley, S., T. G. Meling, and B. A. Ødegaard. 2023. “Tick Size Wars: The Market Quality Effects of Pricing Grid Competition.” Review of Finance 27 (2): 659–692. https://doi.org/10.1093/rof/rfac032.
- Goldstein, M. A., and K. A. Kavajecz. 2000. “Eighths, Sixteenths, and Market Depth: Changes in Tick Size and Liquidity Provision on the NYSE.” Journal of Financial Economics 56 (1): 125–149. https://doi.org/10.1016/S0304-405X(99)00061-6.
- Graziani, G., and B. Rindi. 2023. “Optimal Tick Size.” SSRN Electronic Journal. In: Available at. https://doi.org/10.2139/ssrn.4341374.
- Griffith, T. G., and B. S. Roseman. 2019. “Making Cents of Tick Sizes: The Effect of the 2016 US SEC Tick Size Pilot on Limit Order Book Liquidity.” Journal of Banking & Finance 101:104–121. https://doi.org/10.1016/j.jbankfin.2019.01.017.
- Johann, T., R. Mestel, S. Scharnowski, E. Theissen, C. Uhlenkamp, C. Westheide, and L. Zimmermann 2023. “Technical Document - Finance Research Graz Data Services (FiRe Graz DS) (May 30, 2023).” In: url: https://banken-finanzierung.uni-graz.at/de/datenbank-finance-research-graz-data-services-fire-graz-ds/.
- Johann, T., S. Scharnowski, E. Theissen, C. Westheide, and L. Zimmermann 2018. “Technical Document - Market Microstructure Database Xetra (October 26, 2018)”. In: url: https://www.bwl.uni-mannheim.de/media/Lehrstuehle/bwl/Theissen/Forschung/TechnicalDocument_XetraMicrostructure.pdf.
- SEC, U.S. (2012). Report to Congress on Decimalization (July 2012). In: url: https://www.sec.gov/files/decimalization-072012.pdf%20(retrieved%20Jan%209,%202024.
- Werner, I. M., B. Rindi, S. Buti, and Y. Wen. 2022. “Tick Size, Trading Strategies, and Market Quality.” Management Science. https://doi.org/10.1287/mnsc.2022.4502.