
 ?Mathematical formulae have been encoded as MathML and are displayed in this HTML version using MathJax in order to improve their display. Uncheck the box to turn MathJax off. This feature requires Javascript. Click on a formula to zoom.
ABSTRACT
Public sector wage research has evolved beyond the estimation of public sector wage premiums to investigating the nature of interrelationships between public and private wage patterns. This article seeks to extend this wage leadership research to investigate intra-industry linkages and spillovers between public and private sector wage growth in Education and Health industries, using Australia as a case study. The research employs vector error correction models to encompass tests for full wage adaptability, long-run and short-run wage leadership. Results show that the public sector is the long-run leader in all models, regardless of industry and alternative jurisdictions’ public sector wage setting policy. Our findings have important policy implications for public sector wage setting practices, demonstrating that wage policies which may be based on political motivations can have widespread effects on the private sector.
I. Introduction
Wage outcomes in Health and Education industries are important to labour economists for a number of reasons. First, over 20% of most OECD countries’ labour force are employed in these industries (OECD Citation2024). Second, they contain a significant proportion of both private and public sector workers. In Education, 50% of workers in the UK and Australia, and over 70% of workers in the US, are employed by the public sector (ABS Citation2021a; FRED Citation2023; ONS Citation2023). Similarly in Health, public sector employment accounts for 45% of workers in the UK, 25% in Australia, and 15% in the US (ABS Citation2021a; BLS Citation2023; ONS Citation2023). Therefore, any wage changes in these industries draw attention to both public and private sector wage setting practices.
A priori, we would not expect a close association between public and private sector wages. Typically, public sector wage policies are set by the government of the day, while private sector wages are determined by market forces. In some jurisdictions of Australia, public sector wage policy takes the form of ‘wage caps’, restricting maximum annual wage growth to a predetermined level. For example, from 2011 to 2022 public sector workers employed by the New South Wales (NSW) state government were restricted to a 2.5% wage cap (NSW Government Citation2014).
Historically, the study of public sector wages was limited to the estimation of wage premiums. That is, after controlling for observable characteristics, the estimation of the marginal effect of a worker’s public sector status on their wages. However, the last decade has seen a shift towards the study of the interrelationship between public and private sector wages, and the identification of wage leadership. As originally theorized by Aukrust (Citation1977), the private (tradable) sector should set wages for the public sector to follow. However, early empirical research by Lamo et al. (Citation2012), D’Adamo (Citation2014), and Camarero et al. (Citation2014) found that the public sector was equally as likely as the private sector to be identified as the leader. More recently, Dolton et al. (Citation2020) and Gjelsvik et al. (Citation2020) both established the private sector as the wage leader for the UK and Norway, respectively. Contributing factors for wage leadership include the relative size of the public sector, trade union density, and centralization of wage bargaining.
While some studies of wage leadership have employed traditional econometric models including a public (private) wage variable in a model of private (public) sector wages (Afonso and Gomes Citation2014; Black and Dowd Citation2023; Marzinotto and Turrini Citation2017), most have incorporated a higher level of dynamics with vector error correction models (VECM), comparing country level public sector wages to either private sector wages or disaggregated tradable and non-tradable private sector wages. However, we argue that this research has been too aggregate in nature and ignores two important features of contemporary labour markets. First, industries that contain a relatively high proportion of both public and private sector workers. It would be expected that intra-industry wage interrelationships may exist between the public and private sector in these industries, reflecting relatively high levels of job mobility between sectors. Second, state or provincial level public sector wage policies. For example, in Australia some occupations such as teachers and nurses receive different wages and conditions depending on their respective state government’s public sector wages policy. A public sector teacher in NSW would have been subject to the 2.5% wage cap from 2011 to 2022, while no such wage cap existed for teachers in the neighbouring state of Victoria until 2019 (Victorian Government Citation2021).
Therefore, the purpose of the present research is to address these shortcomings by exploring the interaction between public and private sector wage growth at a more disaggregated or microeconomic level, using Australia as a case study. More specifically, we model full wage adaptability, long-run leadership and short-run leadership for Education and Health industries in the states of NSW and Victoria. Given the divergent wage setting mechanisms in the public and private sectors, the determination of the wage leading sector has important policy implications. In simple terms, this determines whether wage trends are driven more by market forces or government policy. By including the jurisdictions of NSW and Victoria, we can incorporate alternative public sector wage setting policies, highlighting the potential effects of wage caps.
II. Methods and materials
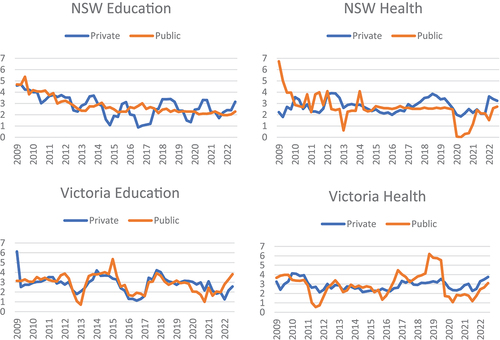
Unpublished quarterly wage price index (WPI) data was obtained from the Australian Bureau of Statistics (ABS) for Education and Training, and Health Care and Social Assistance, industries in the states of NSW and Victoria, covering September 2008 to March 2023 (see ). The main advantage of the WPI is that it tracks the same job over time and is intended to isolate wage price changes, being unaffected by changes to quantity and quality of work performed, as well as compositional changes in the labour market (ABS Citation2023b). However, the WPI is not disaggregated by sex, nor by government jurisdiction. Therefore, we are unable to directly isolate state government public sector WPI. However, it should be the dominant influence on the state-level WPI series, with the state government accounting for 75% of NSW and 66% of Victorian public sector workers in education, and 97% of public sector Health workers in both NSW and Victoria (ABS Citation2021a).
Figure 1. WPI growth by sector, industry and state (Sept 2008 to Mar 2023).
D’Adamo (Citation2014) demonstrated that VECM can incorporate three separate tests relevant to wage leadership (full wage adaptability, long-run and short-run wage leadership). After establishing that wage growth rates in the private sector Wpri and public sector Wpub are I(1) and cointegrated, the VECM is estimated as:
where the matrix with rank r < 2 represents the long-run cointegrating relation,
are the adjustment coefficients, and
are the matrices of short-run coefficients.
First, full wage adaptability can be established if both coefficients are equal to unity, implying that a one percentage point increase in wages is fully transferred to the other sector. In practice, this entails a test of
as
is set to unity by default. Second, long-run wage leadership is tested via the
adjustment coefficients. If
for a sector is zero, this implies that the sector is the wage leader as it does not react to shocks to the long-run relationship between the sectors. Alternatively, if
is less than one and of appropriate sign (negative (positive) for private (public) sector), this implies that the sector adjusts to the other and is the wage follower. Finally, short-run leadership is tested with
coefficients and standard Granger causality.
III. Results
The main results from EquationEquation (1)(1)
(1) are reported in . First, the hypothesis of full wage adaptability was rejected in the Victoria models but could not be rejected for NSW. However, with reference to the actual
coefficients, all varied between approximately 0.4 to 0.5, implying that approximately one half of the wage growth in one sector was passed through to the other sector.
Table 1. VECM estimation results1.
Second, the public sector was established to be the long-run wage leader in all four models. That is, private sector wages adjust to deviations from the long-run relationship between private and public sector wage growth; however, the public sector does not adjust in a similar fashion. The magnitude of the adjustment coefficients was relatively high (0.38 to 0.83) compared to past research, indicating that between 40% and 80% of deviations from the long-run model are corrected in the following time period. In comparison, the mean adjustment coefficient in Lamo et al. (Citation2012) was 0.27, varying between 0.06 and 0.88. Furthermore, the adjustment coefficients were higher for Victoria compared to NSW, indicating a higher level of responsiveness from the Victorian private sector to correcting deviations from the long-run model. Finally, short-term feedback effects were observed in three of the four models via the granger causality results.
IV. Discussion
In summary, this research extends empirical wage leadership literature by examining intra-industry wage dynamics in industries employing a significant proportion of public and private sector workers, in alternative public sector wage setting jurisdictions. The main finding was that the public sector was the wage leader in all models. Presumably, the relative size of the public sector contributes to this finding. Whereas the public sector employs approximately 15% of the Australian workforce in general, it employs 50% of the Education and 25% of Health. Furthermore, the estimated adjustment coefficients were relatively high and likely to be related to the high mobility of workers between public and private sectors within these industries.
The main policy implication of this research is the potentially wide reaching repercussions of public sector wage setting policies. Particularly in NSW, the finding of public sector wage leadership and full wage adaptability implies that the wage cap did not just impact public sector workers directly, but also flowed through to private sector workers. First, this implies that market forces may have been superseded by political forces in the determination of wage growth for a significant proportion of private sector workers. Second, in common with many European countries’ austerity measures (Michael and Christfides Citation2020), the NSW wage cap was intended to curtail public spending immediately following the GFC. However, extending this wage rule to 2022 may have had unintended macroeconomic consequences by contributing to the sluggish wage and economic growth observed in the late 2010’s.
It is hoped that by including intra-industry wage growth analysis and multiple public sector jurisdictions this analysis contributes new insights to our understanding of wage leadership and the dynamics between public and private sector wage growth. The next step is to look beyond these direct relationships and explore whether the public sector wage leadership in Education and Health industries spreads to private sector workers in other industries.
Disclosure statement
No potential conflict of interest was reported by the author(s).
References
- ABS 2021a. Census of Population and Housing. Accessed March 22, 2023. https://tablebuilder.abs.gov.au/webapi/jsf/dataCatalogueExplorer.xhtml.
- ABS. 2023a. Wage Price Index: Customised Report.
- ABS. 2023b. Wage Price Index Methodology. https://www.abs.gov.au/methodologies/wage-price-index-australia-methodology/sep-2023.
- Afonso, A., and P. Gomes. 2014. “Interactions Between Private and Public Sector Wages.” Journal of Macroeconomics 39:97–112. https://doi.org/10.1016/j.jmacro.2013.12.003.
- Aukrust, O. 1977. Inflation in the Open Economy: A Norwegian Model. Artikler no.96. Oslo: Statistisk Sentralbyra.
- Black, D. C., and M. R. Dowd. 2023. “Wage Leadership in US Labour Markets Between Alternative Levels of Industry and Governments.” Applied Economics 1–8. https://doi.org/10.1080/00036846.2023.2244237.
- BLS. 2023. Healthcare Occupations: Characteristics of the Employed. https://www.bls.gov/spotlight/2023/healthcare-occupations-in-2022/home.htm.
- Camarero, M., G. D’Adamo, and C. Tamarit. 2014. “Wage Leadership Models: A Country-By-Country Analysis of the EMU.” Economic Modelling 44:S2–11. https://doi.org/10.1016/j.econmod.2013.12.001.
- D’Adamo, G. 2014. “Wage Spillovers Across Sectors in Eastern Europe.” Empirical Economics 47 (2): 523–52. https://doi.org/10.1007/s00181-013-0744-z.
- Dolton, P., A. Hantzsche, and A. Kara. 2020. The Dynamics of Public and Private Sector Wages, Pay Settlements and Employment. National Institute of Economic and Social Research.
- FRED. 2023. Federal Reserve Economic Data: Current Employment Statistics (Establishment Data). https://fred.stlouisfed.org/release/tables?rid=50&eid=4881#snid=5487.
- Gjelsvik, M., R. Nymoen, and V. Sparrman. 2020. “Cointegration and Structure in Norwegian Wage–Price Dynamics.” Econometrics 8 (3): 29. https://doi.org/10.3390/econometrics8030029.
- Lamo, A., J. J. Pérez, and L. Schuknecht. 2012. “Public or Private Sector Wage Leadership? An International Perspective.” The Scandinavian Journal of Economics 114 (1): 228–244. https://doi.org/10.1111/j.1467-9442.2011.01665.x.
- Marzinotto, B., and A. Turrini. 2017. “Co-Movements Between Public and Private Wages in the EU: What Factors and with What Policy Implications?” IZA Journal of European Labor Studies 6 (1): 1–16. https://doi.org/10.1186/s40174-016-0074-1.
- Michael, M., and L. N. Christofides. 2020. “The Impact of Austerity Measures on the Public – Private Sector Wage Gap in Europe.” Labour Economics 63: 101796.
- NSW Government. 2014. NSW Public Sector Wages Policy 2011. https://www.treasury.nsw.gov.au/sites/default/files/pdf/TC14-18_NSW_Public_Sector_Wages_Policy_2011_dnd.pdf.
- OECD. 2024. OECD.Stat: Employment by Activities and Status. https://stats.oecd.org/Index.aspx?DataSetCode=ALFS_EMP#.
- ONS. 2023. Office for National Statistics: All Data Related to Employment and Employee Types. https://www.ons.gov.uk/employmentandlabourmarket/peopleinwork/employmentandemployeetypes/datalist?sortBy=release_date&query=industry&filter=datasets&fromDateDay=&fromDateMonth=&fromDateYear=&toDateDay=&toDateMonth=&toDateYear=&size=10.
- Victorian Government. 2021. Victorian Government Wages Policy and Enterprise Bargaining Framework. https://www.vic.gov.au/wages-policy-and-enterprise-bargaining-framework.