
 ?Mathematical formulae have been encoded as MathML and are displayed in this HTML version using MathJax in order to improve their display. Uncheck the box to turn MathJax off. This feature requires Javascript. Click on a formula to zoom.
Abstract
We propose a model to quantify the effect of parameter uncertainty on the option price in the Heston model. More precisely, we present a Hamilton–Jacobi–Bellman framework which allows us to evaluate best and worst-case scenarios under an uncertain market price of volatility risk. For the numerical approximation, the Hamilton–Jacobi–Bellman equation is reformulated to enable the solution with a finite element method. A case study with butterfly options exhibits how the dependence of Delta on the magnitude of the uncertainty is nonlinear and highly varied across the parameter regime.
1. Introduction
One of the main challenges in financial mathematics is to determine the fair pricing of options. Among the simplifications underlying the original Black–Scholes (BS) model is the assumption that the volatility of the stock price is constant. Analysis of the real-life data does not support this statement and so numerous attempts were made to differently model the behaviour of volatility in time. A widely used approach was proposed in Heston (Citation1993) which models the volatility through another, correlated stochastic process. However, Heston (Citation1993) introduces, compared to the BS model, additional parameters such as the market price of volatility risk.
Generally in option pricing, errors in parameter estimates can lead to inconsistent results even if the underlying model were to be accurate. This inspired the approach taken in Avellaneda, Levy, and Parás (Citation1995) where instead of trying to model and predict the behaviour of parameters, they are assumed to stay within a given tolerance interval. This allows to manage the risk by considering the worst-case scenario, leading in fact to an optimal control problem involving nonlinear PDE as shown in Karoui, Peng, and Claire Quenez (Citation1997). In Cohen and Tegnér (Citation2019) parameter uncertainty of the Heston model is examined by means of Hamilton–Jacobi–Bellman equations, with uncertainty in the risk free rate r, long-term mean γ and reversion level κ. María et al. (Citation2018) use stochastic collocation of the Heston model for the uncertainty qualification of the risk-free rate, long-term mean, reversion level, initial variance and correlation. We also refer to Ma and Forsyth (Citation2016) for a related study of two-factor uncertain volatility.
The contribution of this work is to extend the Hamilton–Jacobi–Bellman framework to quantify the effect of uncertainty in the Heston model specifically in relation to the market price of volatility risk λ. This parameter is difficult to estimate in practice. For instance, in Heston (Citation1993) a linear scaling of the market price of volatility risk is assumed and while there is an evidence of a positive correlation (see Duarte and Jones Citation2007) there does not appear to be a consensus on how to estimate the scaling factor (see Wu, Zhou, and Wang Citation2018). In fact, some authors (see for example Ikonen and Toivanen Citation2009; Forsyth, Vetzal, and Zvan Citation1998; Kunoth, Schneider, and Wiechers Citation2012) assume it to be equal to 0. However, other works indicate that this assumption may not hold up in various realistic settings such as those discussed for example in Doran (Citation2007) and Bakshi and Kapadia (Citation2003). The attempts of evaluating the market price of volatility in different financial circumstances can be found in Doran and Ronn (Citation2008) and Wu, Zhou, and Wang (Citation2018) while its impact on option pricing is investigated in Duarte and Jones (Citation2007) and Mielkie and Davison (Citation2013). Moreover, the market price of volatility risk λ is qualitatively different from those considered in Cohen and Tegnér (Citation2019) and María et al. (Citation2018) as λ is not part of the SDE modelling the price of the underlying security, and instead arises in the construction of a hedging portfolio. The main numerical challenge when computing the option price and Greeks associated with the uncertain Heston model is that one has to solve fully nonlinear PDEs with mixed boundary conditions. A numerical scheme capable of this is provided in Jaroszkowski and Jensen (Citation2021) in form of a finite element method. A crucial advantage of using a finite element method in this context is that it allows us also to ensure convergence of the gradient (Jensen Citation2017). This is of particular importance in option pricing where partial derivatives inform the construction of a hedging portfolio.
The outline of this chapter is as follows. In Section 2 we briefly state the uncertain Heston model and then show how it can be interpreted as a backward-in-time stochastic optimal control problem. By combining the methods of stochastic volatility and uncertain parameters we obtain a second-order nonlinear PDE modelling the worst and best case scenarios when a range of values of the market price of volatility risk is considered. In Section 3 we present a transformation of the Heston equation to the form required by the numerical scheme in Jaroszkowski and Jensen (Citation2021). Finally, in Section 4 we present a case study of a long butterfly option whose main goal is to investigate the impact of the uncertain market price of volatility risk on the option price and its derivatives.
2. The Uncertain Heston Model
In this section, we derive an extension of the Heston model to price European options in the presence of uncertain parameters.
Consider a stock with price S and a European option with expiry time and value V. Given a Wiener process
, we model the change of the stock price with
(1)
(1)
While in the classical Black–Scholes model the volatility σ is assumed to be constant, we follow (Heston Citation1993) and represent it by yet another, correlated Wiener process
. Then, denoting the volatility of volatility as ξ we obtain the second stochastic differential equation
(2)
(2)
where the variance
is a square of the volatility σ and ξ is assumed to be a known constant. We denote the correlation coefficient between
and
as
. Note that (Equation2
(2)
(2) ) is a mean-reverting process with a long-term mean equal to γ and a reversion level equal to κ. We take the drift coefficient μ in (Equation1
(1)
(1) ) to be constant and generally unknown.
At this point, we summarize the underlying assumptions of the model. The dividend payouts during the lifetime of the option are set to be 0. We assume it is possible to lend and borrow any amount of a risk-free asset at a known constant interest rate r. Moreover, we are allowed to trade any amount, possibly fractional, of the stock S or an option of value at any time
. We also say that the market is frictionless, which means that no such transaction generates fees. Lastly, we assume that there is no arbitrage opportunity.
It is well known (Heston Citation1993), also Wilmott (Citation2006, Chapter 51), that in this setting the existence of hedging portfolios ensures that the option price V admits the parabolic equation
(3)
(3)
for some universal function
which is common to all options. The function λ is called the market price of volatility risk because it can be interpreted as the value which market participants assign to the volatility risk. Yet, there is no agreed way to measure this function from market prices. Thus choosing the function
is extremely challenging from the theoretical point of view and as a practical task.
Heston (Citation1993) proposes that it can be chosen equal to with
being a scaling factor, i.e., in this special case λ has the meaning of a coefficient and not the whole market price of volatility risk function.
Since there is no agreed method of estimating the market price of volatility, one may argue that any such estimate will be burdened with inaccuracies. We propose therefore a new methodology to take this lack of knowledge about the market into account: We will model the market price of volatility risk as uncertain, borrowing concepts from Avellaneda, Levy, and Parás (Citation1995), where the effect of uncertain volatility is examined.
More concretely, we assume that λ is an unknown parameter contained in some interval and consider the set
of all measurable mappings from
to L. For all
, we define the linear operators
as
(4)
(4)
We define the Heston equation associated with the control
to be
(5)
(5)
Let us momentarily assume that
is known and given. Then, in order to obtain a well-posed problem, we need to also enforce boundary and the final time conditions. Throughout this chapter, given maturity T, we will use the following conditions
(6a)
(6a)
(6b)
(6b)
(6c)
(6c)
(6d)
(6d)
(6e)
(6e)
where the given function Λ is the pay-off profile of the option.
The boundary condition (Equation6d(6d)
(6d) ) for a vanishing variance can be thought of as taking limit
in the Black–Scholes equation and it is adapted directly from Heston (Citation1993). Notice on the other hand how compared to Heston (Citation1993) the Dirichlet condition for a large volatility was replaced by the Neumann condition (Equation6e
(6e)
(6e) ), which is more favourably from the numerical point of view. We motivate these Neumann conditions with the observation that as the volatility approaches extremely large values, the influence of its oscillations on the option price is negligible. Thus we impose that the rate of change of V in v-direction at this asymptotic boundary to be 0. In the literature, such approach was adopted for the pricing of American options in Clarke and Parrott (Citation1999) and Ikonen and Toivanen (Citation2008), see also Zhu and Chen (Citation2011).
Remark 2.1
Recall that for a call option with the strike price K one would choose Λ as . In order to calculate the value of a long butterfly position of width
and the strike price K the choice would be
Similarly, to consider the value of a long straddle with the strike price K one would require
.
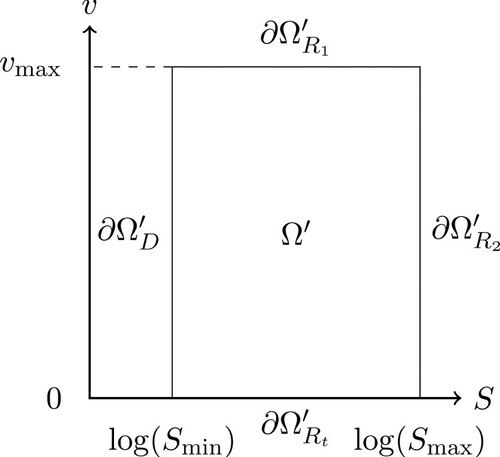
In practice, the implementation of the numerical scheme will require us to truncate the domain. Generally, we choose a rectangular domain as in Figure with
For the sake of brevity, we will also define
which we call the Heston operator:
(7)
(7)
Figure 1. Truncated domain .
![Figure 1. Truncated domain Ω=[Smin,Smax]×[0,vmax].](/cms/asset/cbf6adf1-49c5-4fb1-9167-9d347403b471/ramf_a_2125884_f0001_oc.jpg)
2.1. Extremal Behaviour Under Uncertainty
Of particular interest are the highest and lowest option price which can occur with market prices of volatility risk . For
we set
(8a)
(8a)
(8b)
(8b)
We seek an alternative characterization of the functions
and
as solution of a PDE, more precisely of a Hamilton–Jacobi–Bellman (HJB) equation in combination with final time and boundary conditions. We shall focus here on the argument for
; the corresponding analysis for
follows analogously. Notice also that the
in the notation of
refers to the
in the below HJB Equation (Equation10
(10)
(10) ), not to the
on the right-hand side of (8).
Suppose there is a minimizer of the right-hand side of (8), which we denote . Then, for
and
sufficiently smooth,
(9a)
(9a)
(9b)
(9b)
(9c)
(9c)
(9d)
(9d)
(9e)
(9e)
where (Equation9e
(9e)
(9e) ) follows from (8). After multiplication with
we find that
Assuming that
is a classical solution so that
we arrive at
(10)
(10)
Because the boundary conditions (Equation6a
(6a)
(6a) ) do not depend on λ, also
satisfies them. Hence, in summary,
solves Equation (Equation10
(10)
(10) ) subject to the boundary conditions (Equation6a
(6a)
(6a) ).
3. Transformation of the Uncertain Heston Model
We propose to use the finite element method of Jaroszkowski and Jensen (Citation2021) for the numerical approximation of . It is shown here that this method can capture the fully nonlinear structure of (Equation10
(10)
(10) ) as well as the mixed (and thus discontinuous) boundary conditions (Equation6a
(6a)
(6a) ) and that it will converge under mesh refinement to the viscosity solution of the final time boundary value problem. Importantly, this finite element approach has been shown (Jensen Citation2017) to guarantee strong convergence in the gradient of the value function, even for a degenerately elliptic HJB operator, as is the case here.
This section will now perform the transformation of the elliptic operators to their isotropic form in order to be consistent with the framework of the numerical method formulated in Chapter (Jaroszkowski and Jensen Citation2021). Our first goal is to remove the S dependence of the coefficients. In order to do that we let
. Then
where the transformed domain for x is denoted
, see Figure . Substituting into (Equation4
(4)
(4) ) we get
(11)
(11)
Similarly, with
the transformed Neumann boundary condition (Equation6c
(6c)
(6c) ) is
(12)
(12)
The boundary conditions on
and
remain as in (Equation6b
(6b)
(6b) ) and (Equation6e
(6e)
(6e) ), in the final time condition one substitutes
for S and the Robin condition on
is obtained by substituting v = 0 into (Equation11
(11)
(11) ). The Heston operator
in the new coordinates is then defined by
(13)
(13)
Figure 2. Domain after the transformation
.
In order to remove the second-order mixed derivative from we consider the following change of variables:
where
and
. The domain
is transformed into
whose shape, in general, depends on the parameters of the numerical experiment. It is depicted in Figure with the numerical values of the case study in Section 4.
For we have that
Combining those results with (Equation11
(11)
(11) ) we obtain the canonical formulation of every
,
, from (Equation5
(5)
(5) ) as required:
(14)
(14)
Now we reformulate (Equation6a
(6a)
(6a) )–(Equation6e
(6e)
(6e) ) accordingly. Since
, the Neumann boundary condition (Equation6c
(6c)
(6c) ) for large stock prices is obtained by simply substituting y and z into (Equation13
(13)
(13) ) on
which results in
(15)
(15)
Under the aforementioned change of variables the Dirichlet boundary condition (Equation6b
(6b)
(6b) ) noticing that
converts to
while for the Neumann condition (Equation6e
(6e)
(6e) ) we use the fact that
and
to obtain
Analogously to the result in Heston (Citation1993), the Robin boundary condition for
is obtained simply by substituting z = 0 into (Equation14
(14)
(14) ) which gives
(16)
(16)
We summarize the above results by introducing the transformed Heston operator
defined as follows
(17)
(17)
By replacing the Heston operator
from (Equation4
(4)
(4) ) with its transformed version from (Equation17
(17)
(17) ) and following the same argument as in the previous section we obtain an optimal control problem
(18)
(18)
analogous to (Equation6a
(6a)
(6a) ) and (Equation10
(10)
(10) ) with the structure conforming to the setting of Jaroszkowski and Jensen (Citation2021). Note that it resembles the ‘worst-case scenario’ described in Avellaneda, Levy, and Parás (Citation1995) but with λ instead of σ taking the role of the uncertain parameter. Having completed the transformation, this allows us to treat the market price of volatility risk as a control in an isotropic HJB problem.
4. Case Study
We now investigate the qualitative and quantitative effects of the market price of volatility risk on the price of an option. The computations use the finite element discretisation of Jaroszkowski and Jensen (Citation2021). The code is available from the public repository (Jaroszkowski Citation2021) under the GNU Lesser General Public License.
As a benchmark problem, we consider the parameters of the experiment described in Doran (Citation2004, Table 11). Following this setting we choose the final time T = 0.5, the strike price K = 50, the volatility of volatility , the long-term volatility mean
, the mean reversion rate
and the correlation parameter
. Since the risk-free rate r is not stated explicitly, we made a choice of r = 0.03. The domain is truncated with
and
, which results in the transformed domain seen in Figure . In the source (Doran Citation2004) a simple call option is studied, which for example with
has the constant optimal control
. Instead, we turn our attention here to a long butterfly position of width 40 which, as mentioned in Remark 2.1, is equivalent to choosing
Figure 3. Domain with parameter values
,
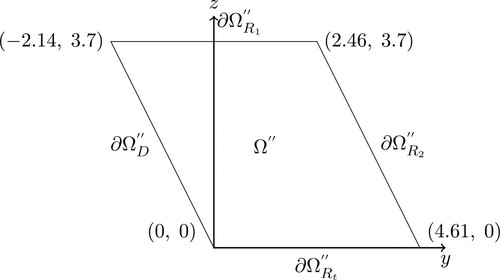
4.1. Result 1: Value Function
We let . Note how interval L is centred around the market price of volatility risk equal to
used in Doran (Citation2004). The numerical approximation of the solution to the HJB problem is performed on the transformed domain
and then the resulting function is cast back to original domain
. The outcome is depicted in Figure . Moreover, one can see in Figure (a) that the numerical method in fact selects different controls as optimal in different areas of the domain. The difference between the solution of the nonlinear problem compared to the solution of the linear evolution problem associated with one of the controls can be seen in Figure (b). This highlights the importance of using a nonlinear model.
Figure 4. Value of a long butterfly position at t = 0 with T = 0.5, K = 50 and control set .
![Figure 4. Value of a long butterfly position at t = 0 with T = 0.5, K = 50 and control set L=[−2.4,−1.6].](/cms/asset/a79afa10-bd78-4be6-a3b4-a4635765262c/ramf_a_2125884_f0004_oc.jpg)
Figure 5. Measurement of the effect of nonlinearity for a long butterfly position at with T = 0.5, K = 50 and control set
. (a) Selected optimal control; which are throughout at the extreme points of the control set, (b) difference between solutions of a nonlinear problem and linear evolution problem with a fixed control
.
![Figure 5. Measurement of the effect of nonlinearity for a long butterfly position at t≈0.39 with T = 0.5, K = 50 and control set L=[−2.4,−1.6]. (a) Selected optimal control; which are throughout at the extreme points of the control set, (b) difference between solutions of a nonlinear problem and linear evolution problem with a fixed control λ=−2.4.](/cms/asset/71a81cd6-9890-4c6a-9504-6b44f389a3c9/ramf_a_2125884_f0005_oc.jpg)
4.2. Result 2: λ Interval Testing
We now assess the impact of different choices of control sets L on the option value estimate. Indeed, we consider control sets of increasing diameter and measure the difference between the value function of the worst-case scenario and the value function
of the best case scenario. The results are shown in Figure . The computations show the significant effect of the uncertainty in the market price of volatility risk on the option price. As indicated by Figure (a) the option value of worse and best case scenario can differ up to
. Note that in this case, the control set contains values ranging between 0 and
, which were found to be used in the literature. Given the evidence (see for example findings in Bakshi and Kapadia (Citation2003)) that the market price of volatility takes negative values, the simplification of taking
may lead to erroneous estimates. On the other hand, the experiments indicate a linear correlation and in general, more negative market prices of volatility risk lead to higher option values.
Figure 6. Measurement of effect of a diameter of a control set on the value function and its derivative. Control sets are symmetrical and centred at , measurements were made at t = 0. (a) Comparison of
and
at
, (b) comparison of
and
at
, (c) comparison of
and
at
, (d) comparison of
and
at
.
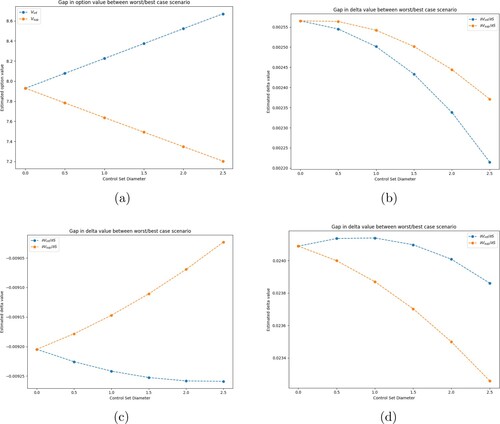
We now direct our attention to the partial derivatives of option value V since they are used to create hedging portfolios. We investigate the effect of λ on the partial derivative of the option value with respect to S. As seen in Figure (b–d) the impact of the value of λ on Delta is strongly nonlinear in the vicinity of the strike price K. We remark at this point that numerical methods which do not guarantee gradient convergence may in general fail to capture this kind of behaviour.
Figure provides a visual portrayal of the sensitivity of the price and Delta on the magnitude of the uncertainty.
4.3. Result 3: Delta Plots
In line with the results of the previous experiment, we continue to investigate the worst and the best case scenarios for the control set at time t = 0. We plot differences between the Deltas
and
for all points in
at time t = 0. The results for a call option are shown in Figure (a) and for a long butterfly option in Figure (b). Note that since
and
are both of order 1, the graphs represent a relative as well as an absolute error. We conclude that the impact of the market price of volatility risk on the delta values is significant. In the covered examples, one can expect up to
difference between the scenario where λ is neglected and the one where the HJB approach is used.
Figure 7. Comparison of plots of at time t = 0 with control set
. (a) Call option, (b) butterfly option.
![Figure 7. Comparison of plots of δ(Vsup−Vinf)/δS at time t = 0 with control set [−2.5,0.0]. (a) Call option, (b) butterfly option.](/cms/asset/99a150aa-a445-4b0d-be94-684982cfb406/ramf_a_2125884_f0007_oc.jpg)
Disclosure statement
No potential conflict of interest was reported by the author(s).
Additional information
Funding
References
- Avellaneda Marco, Levy Arnon, and Parás Antonio. 1995. “Pricing and Hedging Derivative Securities in Markets with Uncertain Volatilities.” Applied Mathematical Finance 2: 73–88.
- Bakshi Gurdip, and Kapadia Nikunj. 2003. “Delta-Hedged Gains and the Negative Volatility Risk Premium.” Review of Financial Studies 16: 527–566.
- Clarke Nigel, and Parrott Kevin. 1999. “Multigrid for American Option Pricing with Stochastic Volatility.” Applied Mathematical Finance 6 (3): 177–195. doi:10.1080/135048699334528.
- Cohen Samuel N., and Tegnér Martin. 2019. “European Option Pricing with Stochastic Volatility Models Under Parameter Uncertainty.” In Frontiers in Stochastic Analysis – BSDEs, SPDEs and Their Applications, Vol. 289 of Springer Proceedings in Mathematics & Statistics, 123–167. Cham: Springer.
- Doran James S. 2004. “On the Market Price of Volatility Risk.” PhD diss., The University of Texas at Austin.
- Doran James S. 2007. “The Influence of Tracking Error on Volatility Risk Premium Estimation.” Journal of Risk 9 (3): 1–36.
- Doran James S., and Ronn Ehud I. 2008. “Computing the Market Price of Volatility Risk in the Energy Commodity Markets.” Journal of Banking & Finance 32 (12): 2541–2552.
- Duarte Jefferson, and Jones Christopher S. 2007. “The Price of Market Volatility Risk.” AFA 2009 San Francisco Meetings Paper.
- Forsyth Peter A., Vetzal Ken R., and Zvan Robert. 1998. “Penalty Methods for American Options with Stochastic Volatility.” Journal of Computational and Applied Mathematics 91 (2): 199–218.
- Heston Steven L. 1993. “A Closed-Form Solution for Options with Stochastic Volatility with Application to Bond and Currency Options.” The Review of Financial Studies 6: 327–343.
- Ikonen Samuli, and Toivanen Jari. 2008. “Effcient Numerical Methods for Pricing American Options Under Stochastic Volatility.” Numerical Methods for Partial Differential Equations 24 (1): 104–126.
- Ikonen Samuli, and Toivanen Jari. 2009. “Operator Splitting Methods for Pricing American Options Under Stochastic Volatility.” Numerische Mathematik 113 (2): 299–324.
- Jaroszkowski Bartosz. 2021. “FEISol (2021).”
- Jaroszkowski Bartosz, and Jensen Max. 2021. “Finite Element Approximation of Hamilton–Jacobi–Bellman Equations with Nonlinear Mixed Boundary Conditions.” Preprint on arXiv.
- Jensen Max. 2017. “L2(Hγ1) Finite Element Convergence for Degenerate Isotropic Hamilton–Jacobi–Bellman Equations.” IMA Journal of Numerical Analysis 37 (3): 1300–1316.
- Karoui Nicole El, Peng Shige, and Claire Quenez Marie. 1997. “Backward Stochastic Differential Equations in Finance.” Mathematical Finance 7 (1): 1–71. doi:10.1111/1467-9965.00022.
- Kunoth Angela, Schneider Christian, and Wiechers Katharina. 2012. “Multiscale Methods for the Valuation of American Options with Stochastic Volatility.” International Journal of Computer Mathematics 89 (9): 1145–1163.
- Ma K., and Forsyth P. A. 2016. “An Unconditionally Monotone Numerical Scheme for the Two-factor Uncertain Volatility Model.” IMA Journal of Numerical Analysis 37 (2): 905–944. doi:10.1093/imanum/drw025.
- Mielkie Melissa, and Davison Matt. 2013. “Investigating the Market Price of Volatility Risk for Options in a Regime-Switching Market.” Econometric Modeling: Capital Markets – Risk EJournal. doi:10.2139/ssrn.2326534.
- María Suárez-Taboada, Witteveen Jeroen A. S., Grzelak Lech A., and Oosterlee Cornelis W. 2018. “Uncertainty Quantification and Heston Model.” Journal of Mathematics in Industry 8 (5): 12. doi:10.1186/s13362-018-0047-2.
- Wilmott Paul. 2006. Paul Wilmott on Quantitative Finance. 2nd ed. Chichester: Wiley.
- Wu Xinyu, Zhou Hailin, and Wang Shouyang. 2018. “Estimation of Market Prices of Risks in the G.A.R.C.H. Diffusion Model.” Economic Research-Ekonomska Istraživanja 31 (1): 15–36.
- Zhu Song-Ping, and Chen Wen-Ting. 2011. “A Predictor–Corrector Scheme Based on the ADI Method for Pricing American Puts with Stochastic Volatility.” Computers and Mathematics with Applications 62 (1): 1–26.