
Abstract
Introduction: AA amyloidosis develops as a result of prolonged inflammation and is characterized by deposits of N-terminal proteolytic fragments of the acute phase reactant serum amyloid A (SAA). Macrophages are usually found adjacent to amyloid, suggesting their involvement in the formation and/or degradation of the amyloid fibrils. Furthermore, accumulating evidence suggests that lipid membranes accelerate the fibrillation of different amyloid proteins.
Methods: Using an experimental mouse model of AA amyloidosis, we compared the amyloidogenic effect of liposomes and/or amyloid-enhancing factor (AEF). Inflammation was induced by subcutaneous injection of silver nitrate followed by intravenous injection of liposomes and/or AEF to accelerate amyloid formation.
Results: We showed that liposomes accelerate amyloid formation in inflamed mice, but the amyloidogenic effect of liposomes was weaker compared with AEF. Regardless of the induction method, amyloid deposits were mainly found in the marginal zones of the spleen and coincided with the depletion of marginal zone macrophages, while red pulp macrophages and metallophilic marginal zone macrophages proved insensitive to amyloid deposition.
Conclusions: We conclude that increased intracellular lipid content facilitates AA amyloid fibril formation and show that the mouse model of AA amyloidosis is a suitable system for further mechanistic studies.
Introduction
AA amyloidosis is a systemic form of amyloidosis with a worldwide distribution [Citation1] that primarily affects kidneys, spleen and liver [Citation2,Citation3]. It results from aggregation and deposition of protein AA, the N-terminal degradation product of the acute phase reactant, serum amyloid A (SAA) [Citation4]. SAA is normally secreted by the liver and circulates associated with high-density lipoprotein (HDL) [Citation2]. SAA is dramatically upregulated during inflammation and has been shown to stimulate the release of proinflammatory cytokines such as tumour necrosis factor (TNF)-α, interleukin (IL)-8 and IL-1β [Citation5,Citation6]. IL-1β is an early response cytokine with a central role in the pathogenesis of several inflammatory disorders, such as rheumatoid arthritis and atherosclerosis [Citation7,Citation8]. IL-1β is synthesized as an inactive precursor, pro-IL-1β, that undergoes activation via enzymatic cleavage by caspase-1. In turn, caspase-1 can be activated by the NALP family of inflammasomes [Citation9]. Previously, it has been shown that amyloid fibrils [Citation10] as well as SAA can activate the Nod-like receptor protein 3 (NLRP3) inflammasome [Citation11].
SAA interacts with macrophages and modulates their activity and lipid homeostasis [Citation12,Citation13]. Macrophages are often detected in close association with the amyloid and they are believed to be involved in both formation and degradation of amyloid, since they synthesize a broad range of proteases [Citation14,Citation15]. Ultrastructural analysis of mouse spleen containing AA amyloid has revealed colocalization of SAA/AA with lysosomes in murine monocytoid cells, suggesting involvement of the lysosomal system in amyloidogenesis [Citation16]. Moreover, the importance of macrophages for the formation of amyloid has been shown experimentally both in vivo [Citation17,Citation18] and in vitro [Citation19].
In the experimental mouse model of AA amyloidosis, spleen is the primary organ for amyloid deposition [Citation14]. Micro-anatomically, spleen consists of two main compartments, the red and white pulp separated by the marginal zone. Tissue-specific macrophages reside in the spleen and contribute to both innate and adaptive immunity, as well as hematopoietic cell turnover. The macrophage subpopulations include red pulp macrophages (RPMs), the marginal zone macrophages (MZMs) and metallophilic marginal zone macrophages (MMZMs) localized in the outer and inner part of the marginal zone, respectively. RPMs are characterized by expression of F4/80 [Citation20] and MZMs express the C-type lectin SIGNR1 and macrophage receptor with collagenous structure (MARCO), a type I scavenger receptor, while MMZMs express the adhesion molecules SIGLEC1 and MOMA-1 [Citation21].
Experimental AA amyloidosis is considered to be transmittable via a “seeding-nucleation” process similar to the prion diseases [Citation22]. In the experimental mouse model of AA amyloidosis, the amyloid formation is accelerated by both non-fibrillary and fibrillary substances including extracts from amyloid-loaded tissues containing amyloid fibrils, amyloid-enhancing factors (AEFs)[Citation23]. Growing evidence suggest that lipid membranes could act as catalytic surfaces for the aggregation of different amyloid proteins [Citation24,Citation25]. The cytotoxic mechanism of amyloid aggregates is still unclear. However, several studies indicate that the interaction between misfolded protein aggregates and cellular membranes cause dysregulation of the cellular homeostasis through disassembly of the lipid bilayer or formation of pore-like structures in the membranes [Citation26,Citation27].
Utilizing the murine model of AA amyloidosis, in which extract of amyloid-loaded liver is used as AEF, we have previously shown that macrophages in the marginal zone of the spleen are important for amyloid formation and that amyloid or amyloid formation is toxic to the MZMs, while MMZMs and RPMs remain unaffected [Citation17]. We also found that clodronate-filled multilayered liposomes used to eradicate macrophages accelerate amyloid formation [Citation17]. With the knowledge that lipid membranes can stimulate amyloid protein aggregation in vitro [Citation26,Citation27], we used liposomes to further study their efficiency to induce AA amyloidosis in vivo and investigated whether liposomes act by a mechanism other than AEF.
Materials and methods
Animals
Outbreed female NMRI mice (n = 204) 6–8 weeks old were obtained from Nova-SCB AB (Sollentuna, Sweden). Mice were housed in groups of five with free access to standard chow (CRM ++, Expanded, Witham, England) and water. The study was approved by the Animal Ethics Review Board, Linköping University, Sweden (No. 85-11).
Preparation and characterization of liposomes and AEF
Liposomes were prepared by dissolving cholesterol and phosphatidylcholine (Sigma-Aldrich, St. Louis, MO) in chloroform at 1:5 molar ratio as described before [Citation17]. The chloroform was evaporated, and the residual phospholipid film was dispersed in phosphate buffered saline (PBS), centrifuged, resuspended in 4 mL PBS and stored under N2 at 4 °C until used. Liposomes containing FITC (FITC-Lipo) were prepared as described above [Citation17], except that the phospholipid film was dispersed in 10 mL PBS containing 2 mg FITC. Boron-dipyrromethene (BODIPY) fluorescent-labelled liposomes (BODIPY-Lipo) were prepared by replacing 12.5% of the cholesterol with BODIPY TopFluor Cholesterol (Avanti Polar Lipids, Alabaster, AL).
AEF was isolated from mice livers with AA-amyloid as described before [Citation28]. Briefly, livers were first homogenized in 0.15 M NaCl and centrifuged at 15,000 × g for 30 min. Homogenization and centrifugation of the pellet was repeated with 0.15 M NaCl/0.05 M sodium citrate 10 times, followed by homogenization in distilled water three times. Pooled supernatants from the third water extraction were used as a source of AEF. To obtain the same concentrations during the experiments, the AEF stock solution was diluted 1:50 in PBS or liposome suspension.
Droplets of liposome suspension or AEF or a mixture of liposomes and AEF were absorbed on formvar-coated copper grid, contrasted with 2% uranyl acetate and viewed in a Jeol 1230 electron microscope at 100 kV (Jeol, Tokyo, Japan). BODIPY-Lipo was applied to an objective slide and examined at λex 495 nm/λem 507 nm in a Zeiss LSM-700 laser scanning confocal microscope (Carl Zeiss Inc., Stuttgart, Germany).
Experimental design
Mice (n = 99) were divided into five groups and intravenously injected with: 0.2 mL liposomes (groups B and D), 0.2 mL PBS (group C), 0.2 mL AEF (group E), and 0.2 mL AEF/liposomes (group F). In addition, each mouse in groups C–F received a subcutaneous injection with 0.2 mL 1% AgNO3 at the start of the experiment and on days 7 and 14. On days 4, 10 and 16, six or seven mice from groups B–F were sacrificed (). Untreated mice (group A, n = 6) were used as controls and sacrificed after 4 days.
Figure 1. Outlining of the experimental design. Mice were divided into five groups (capital letter) and inflammatory stimulus was given by subcutaneous injection of AgNO3 (1%, 0.2 mL). Amyloid enhancing factor (AEF) and/or liposomes (Lipo) were injected intravenously. Sac indicates the time point at which the mice were sacrificed; n indicates the number of mice in each group. Arrows indicate injection time point. Shorter time points were studied in groups D, E and F in a separate experiment of 72 mice in which three mice were sacrificed between 0.5 and 72 h after the treatment at day 0.
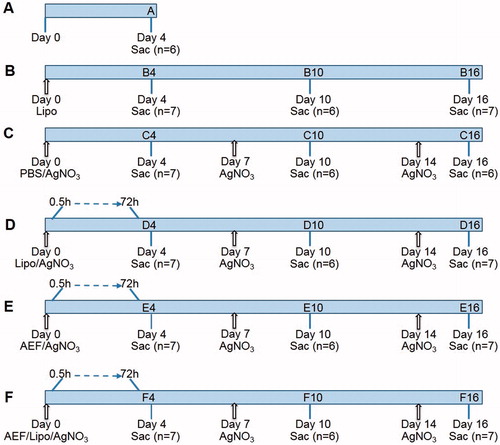
Short-time effects were studied by injecting additional 72 mice intravenously with AEF and/or liposomes (groups D–F) and subcutaneously with AgNO3 using the same volumes as described above. Three mice were sacrificed at each time point between 0.5 and 72 h ().
To study the clearance of liposomes, mice (n = 27) were injected intravenously with 0.2 mL of BODIPY-Lipo. Three mice were sacrificed at each time point (0.5–96 h).
Sampling
Animals were anesthetized with isoflurane and decapitated. Blood was collected, and serum was recovered by centrifugation at 2000 × g for 10 min. Blood smears were made from mice treated with BODIPY-Lipo. Spleen and a part of the liver were placed in Tissue-Tek OCT compound (Sacura, Zoeterwoude, Netherlands) and snap frozen. In addition, small pieces of spleen were collected for Western blot analysis. Samples were stored at −80 °C awaiting analysis.
Quantification of SAA
Serum amyloiod A concentration was analyzed colorimetrically using a commercial ELISA kit (Tridelta Development Ltd, Maynooth, Ireland) according to the supplier’s instruction. Sera from groups A and B were diluted 1:200 and from Groups C–F 1:2000. Measurements were performed in a Victor 1420 microplate reader (Perkin Elmer, Waltham, MA).
Detection and grading of amyloid
Frozen spleen and liver sections (10 µm) were fixed in 10% neutral buffered formalin for 15 min and stained first with Mayer’s haematoxylin and then with alkaline Congo red [Citation29]. The presence of amyloid was determined in polarized light on blinded slides and evaluated by three individuals. Amyloid-grading in spleen was adapted from Lundmark et al. [Citation22].
Immunodetection
RPMs, MMZMs and MZMs were identified in sections using antibodies against F4/80, MOMA-1 and SIGNR1, respectively (). For simultaneous detection of amyloid, sections were stained with Congo red solution (80% ethanol saturated with NaCl and Congo red) for 1 min. To study the presence of IL-1β in spleen, frozen sections were fixed either in 4% paraformaldehyde or in formalin for 10 min, treated in PBS + 0.3% Triton X-100, and blocked for 1 h in PBS + 2% foetal calf serum +1% bovine serum albumin. Thereafter, sections were double immunolabelled for IL-1β and splenic macrophages (either RPM or MMZM or MZM) (). Frozen kidney sections were used as positive control for the IL-1β expression. Sections were mounted with glycerol/Tris-buffered saline (TBS) containing DAPI nuclear stain (Invitrogen, Eugene, OR) and examined in a Zeiss LSM 700 confocal microscope. Images were analyzed with Image J 1.42q software (National Institute of Health, Bethesda, MD).
Table 1. Antibodies used for immunodetection.
Quantification of spleen macrophages
For quantification of RPMs, images of 10 randomly selected areas of the red pulp from each mouse were captured at 63× magnification. For quantification of MMZMs, images of 10 randomly selected marginal zones were captured at 20× magnification. Images of MZMs were captured in 10 marginal zones with amyloid at 20× magnification. Labelled areas were analyzed with Image J as described before [Citation17]. The results are presented as fold increase or decrease of the respective cell type compared to untreated control (group A).
Determination of proliferation
Spleen sections from two randomly selected mice from each group (A–F) sacrificed after 4 days were double labelled with antibodies against F4/80 and Ki-67 (). From each section, five images were captured and, in each image, three areas of 2000 µm2 were selected using Zen software (Carl Zeiss). The number of F4/80 expressing cells positive for Ki-67 was counted manually and presented as percentage of Ki-67 positive RPMs.
Western blot
Frozen spleen tissue (≈1 mg) was lyophilized, solubilized in 100 μL 70% formic acid and centrifuged at 12,000 × g for 10 min. The supernatant was recovered, dried and solubilized in 200 µL dimethyl sulphoxide (DMSO). Samples were sonicated for 3 min, mixed 1:1 with 2× Novex Tricine loading buffer (Life Technologies-Invitrogen, Carlsbad, CA) and heated at 95 °C, for 5 min. Proteins were separated on 16% Tris-Tricine SDS-polyacrylamide gel (NuPAGE, Invitrogen, Carlsbad, CA) and blotted onto a nitrocellulose membrane. After saturation with 5% non-fat dry milk (Bio-Rad, Hercules, CA) in TBS-T (TBS with 0.05% Tween) for 1 h, immunodetection of SAA/AA was performed using anti-mouse SAA/AA antibody (kindly provided by Dr J. Sponarova) [Citation30] (). The membrane was developed using the ECL Western blotting detection system (Bio-Rad, Hercules, CA) and images captured using ChemiDoc MP system (Bio-Rad, Hercules, CA).
Estimation of BODIPY-Lipo in blood, spleen and liver
From mice treated with BODIPY-Lipo, blood smears and frozen sections of spleen and liver were examined at ƛex 470 nm/ƛem 510 nm in a confocal microscope, respectively. Three images of blood smear from each mouse were captured at 40× magnification; the number of BODIPY-Lipo was counted manually and the mean values were calculated. From spleen and liver sections, three images were captured at 10× magnification from each mouse. The areas of green fluorescence were measured using Image J and mean values were calculated for each individual. Finally, the mean value was calculated for each time point.
Cell culture
The murine macrophage-like cell line J774A.1 from ATCC (Manassas, VA) was cultured in Dulbecco’s Modified Eagle Medium (DMEM) supplemented with 10% foetal bovine serum, 50 IU/mL penicillin-G and 50 µg/mL streptomycin (all from Gibco, Paisley, UK). Cells were seeded at 20,000 cells/cm2 on cover slips and incubated in 5% CO2 at 37 °C. Cells were incubated with FITC-Lipo (10 µL/mL of 1:100 dilution of FITC-Lipo was added to each well) for 2 h in 37 °C, washed with medium and incubated with 100 nM Lysotracker red (Invitrogen, Eugene, OR). After 10 min, excess Lysotracker was washed, the coverslips were mounted and the co-localization between the green and red signals was estimated by confocal microscopy.
Statistical analysis
Two-sample independent t-test was used for comparison of macrophage areas using the OpenEpi version 2.3. (http://www.openepi.com/Menu/OE_Menu.htm). One-way ANOVA, followed by Tukey’s multiple comparison post-test was performed for comparisons of SAA serum concentrations between groups using GraphPad Prism 6 Software (Version 6.05, La Jolla, CA). All p values below 0.05 were considered significant.
Results
Determination of inflammatory response
Mice were grouped into five treatment groups (B–F) (n = 6–7 in each group) and one untreated control group (group A) (n = 6). All mice except the untreated controls (group A) and the liposome-treated group (group B) were injected with AgNO3 to induce acute phase stimulation and inflammation. To enhance amyloid formation, AEF and liposomes were administrated alone or in combination (groups D–F) at start of the experiment (day 0) and to maintain the inflammatory response the AgNO3 injection was repeated at days 7 and 14 (groups C–F) ().
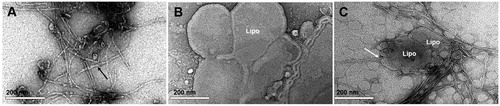
Prior to injection, the morphology of AEF and the liposome preparation were studied in the electron microscope. The AEF preparation contained unbranched fibrils of varying length () while the liposomes appeared as rounded structures with a diameter ranging from 0.02 to 2.56 μm (0.43 ± 0.45 μm; mean ± SD) (). The mixture of AEF and liposomes showed amyloid fibrils enriched at the surface of liposomes and often arranged perpendicularly to the liposome membrane surface ().
Figure 2. TEM images of liposomes and amyloid fibrils negatively stained with uranyl acetate. (A) Preparation of AEF showing unbranched fibrils of different length (black arrow). (B) Preparation of liposomes (Lipo) with rounded vesicles of varying size. (C) Mixture of liposomes and AEF showing affinity of amyloid fibrils to liposomes. The white arrow indicates the perpendicularly arrangement of fibrils to the liposomes membrane.
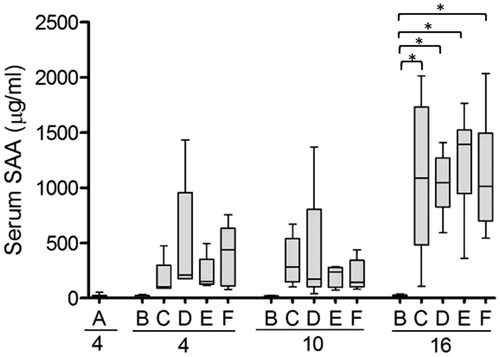
The degree of inflammation was assessed by analysis of SAA serum concentration after 4, 10 and 16 days using ELISA. The AgNO3 injection was performed on days 0, 7 and 14 () and the SAA levels were higher 2 days after injection (corresponding to animals sacrificed on day 16) than after 3 and 4 days (corresponding to days 10 and 4, respectively). In untreated mice (group A) and mice injected with liposomes only (group B), the SAA concentration never exceeded 53 µg/mL. Injection with AgNO3 alone or in combination with liposomes and/or AEF (groups C–F), showed a similar rise in SAA that was significantly higher than in groups A and B at the 16 days time-point ().
Figure 3. Serum concentration of SAA is increased in response to inflammation. SAA concentration was measured in serum from each experimental group outlined in . At start of the experiment and after 7 and 14 days, mice were injected with AgNO3 (groups C–F). Capital letters indicate the groups and the numbers indicate the day at which the mice were sacrificed. Note that mice sacrificed at day 4 were injected with AgNO3 4 days earlier, while mice sacrificed after 10 and 16 days have been injected 3 and 2 days earlier, respectively. Each box presents the values from 5 to 6 mice. The horizontal line in each box represents the median. *p ≤ 0.01.
AA amyloid development
Mice were sacrificed 4, 10 and 16 days after start of the experiment, and spleen and liver sections were prepared and analyzed for presence of amyloid deposits using Congo red staining. The amyloid load was estimated according to a 4-graded scale from 1+ (very thin focal deposits) to 4+ (extensive amyloid deposits around and between follicles) in accordance with a previous publication [Citation22]. As presented in , amyloid deposits were enhanced with time. The administration of AgNO3 in combination with AEF resulted in the highest load of deposits (group E) while administration of AgNO3 in combination with liposomes (group D) gave rise to a lower amyloid load after 10 and 16 days. In mice injected with the combination of AgNO3, AEF and liposomes (group F), the AA amyloid deposit was reduced as compare with animals in group E. Administration of liposomes only (group B) and AgNO3 only (group C) did not give rise to amyloid during the experimental period. No amyloid appeared in spleen or liver in untreated mice from group A ().
Figure 4. Liposomes and AEF enhance the AA amyloid formation. (A) Spleen sections from AA amyloid mice were stained with Congo red and amyloid was graded from 0 (no amyloid) to 4+ (intensive amount of amyloid; see Ref. [Citation22] for details). Capital letters indicate groups and numbers indicate the duration of experiment (the groups are outlined in ). (B) SAA/AA immunoblot of spleen homogenates from mice treated with AgNO3 (group C10), liposomes and AgNO3 (group D10), AEF and AgNO3 (group E10), and AEF/ liposomes and AgNO3 (group F10) sacrificed after 10 days. Immunodetection of SAA/AA revealed three bands between 8 and 12 kDa while no reactivity was detected in group A (untreated mice) and group C (mice injected with AgNO3 only). (C) Liver sections were stained with Congo red and examined for the presence of amyloid; positive staining (grey bar), and negative straining (white bar).
![Figure 4. Liposomes and AEF enhance the AA amyloid formation. (A) Spleen sections from AA amyloid mice were stained with Congo red and amyloid was graded from 0 (no amyloid) to 4+ (intensive amount of amyloid; see Ref. [Citation22] for details). Capital letters indicate groups and numbers indicate the duration of experiment (the groups are outlined in Figure 1). (B) SAA/AA immunoblot of spleen homogenates from mice treated with AgNO3 (group C10), liposomes and AgNO3 (group D10), AEF and AgNO3 (group E10), and AEF/ liposomes and AgNO3 (group F10) sacrificed after 10 days. Immunodetection of SAA/AA revealed three bands between 8 and 12 kDa while no reactivity was detected in group A (untreated mice) and group C (mice injected with AgNO3 only). (C) Liver sections were stained with Congo red and examined for the presence of amyloid; positive staining (grey bar), and negative straining (white bar).](/cms/asset/95f78e60-4f4d-45c4-9b16-57625f5a3805/iamy_a_1576606_f0004_b.jpg)
In order to compare the proteolytic degradation of SAA/AA amyloid, spleen homogenates from mice sacrificed 10 days after start of the experiment (Groups D, E and F) with amyloid score 3+ or 4+ were analyzed by Western blot. All samples revealed three bands between approximately 8 and 12 kDa (). Spleen homogenates from AgNO3-treated mice (group C) and untreated mice (group A) were used as negative controls.
Deposits of AA amyloid in liver occur secondary to spleen amyloid. Thus, in group E, amyloid was detected in liver in all mice sacrificed after 10 and 16 days, as well as in one mouse sacrificed after 4 days. In group F, only one out of six mice and four out of seven mice had liver engagement after 10 and 16 days, respectively. In accordance, in group D with lower amyloid load in spleen, liver amyloid was detected in the single mouse that exhibited score 4+ for spleen amyloid load (.
Alterations of splenic macrophages
In mice sacrificed after 4, 10 and 16 days, spleen cryo-sections were immune-labelled with fluorescent antibodies specific to RPMs, MMZMs and MZMs, respectively, and stained with Congo red (Supplementary Figure 1). The labelled area of RPMs increased significantly in all experimental groups compared with untreated mice (group A) (). Interestingly, injection of liposomes with or without concomitant acute phase stimulation (groups B and D, respectively) both resulted in an elevated level of labelled area of RPMs at day 4. In animals sacrificed at day 16, the number of RPM remained higher than in controls. To confirm that the increased RPM-labelled area corresponded to proliferation, sections from two randomly selected mice in control group A and each treatment group sacrificed at day 4 were stained with the proliferation marker Ki-67, which revealed positive Ki-67 staining in 69% of the RPMs in group A and 79–89% in groups B–F (Supplementary Figure 2).
Figure 5. RPMs but not MMZMs are increased in response to all treatments. Inflammatory response in mice was induced by AgNO3 injections and amyloid formation was stimulated by amyloid enhancing factor (AEF) and/or liposomes (Lipo) according to the outline in . RPMs and MMZMs were identified using specific antibodies against F4/80 and MOMA-1, respectively. Results are presented as fold change of untreated animals. Each bar represents the mean value for 6–7 mice. Grey bars are RPMs and white bars are MMZMs. Horizontal dotted line shows the baseline for untreated control (group A). *p ≤ 0.01, **p ≤ 0.001, ***p ≤ 0.0001.
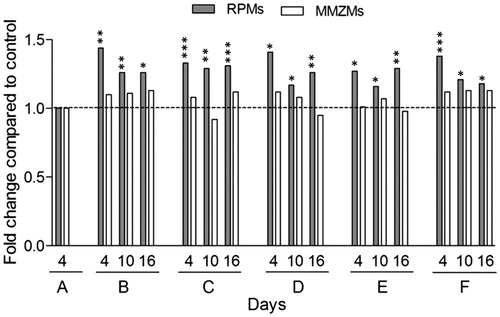
Amyloid deposits did not result in any significant changes of MMZMs-labelled area compared to untreated control irrespective amyloid induction method. Similarly, MMZMs-labelled areas were not affected by administration of AgNO3 or liposomes ().
Earlier, we have shown that amyloid formation induced by injection of AEF and AgNO3 caused depletion of MZMs in the marginal zones [Citation17]. In accordance, the MZMs-labelled areas were significantly decreased in all mice with an amyloid score ≥ 2+ (groups D, E and F) compared with untreated controls (group A). In general, the higher the amyloid score, the more pronounced reduction of MZM areas (). In mice treated with liposomes only (group B) or treated with AgNO3 only (group C), no amyloid deposits were detected. The MZM positive area showed a marginal increase of 1.07-fold (not shown), which is in accordance with our previous publication [Citation17]. MZMs were not determined in samples with an amyloid score of 1+ due to Congo red background interference in fluorescent light.
Table 2. Quantification of MZMs correlated to grading of spleen amyloid.
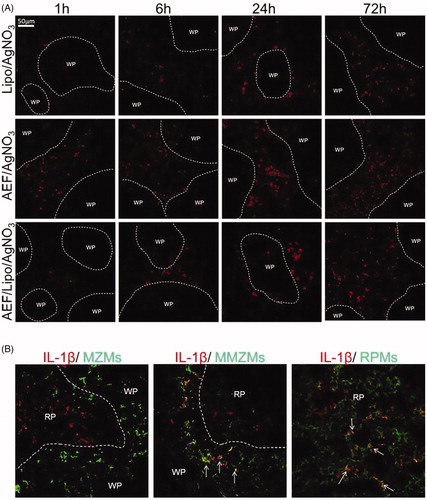
In order to investigate if inflammation and amyloid induction lead to IL-1β activation, spleen sections from short-time experiment (groups D, E and F) (0.5–72 h), were stained for IL-1β. In all groups, IL-1β was detected in the red pulp after 1 h and increased over time (). The number of IL-1β positive cells was higher in AEF and AgNO3-treated mice (group E) as compared with the inflamed mice treated with liposomes (group D) or liposomes in combination with AEF (group F). The IL-1β was co-localized with RPMs regardless of amyloid induction method (). In groups D and F, IL-1β was also co-localized with few MMZMs. However, no IL-1β was detected in MZMs in any of the treatment groups (). The IL-1β was not detected in the untreated controls (group A), nor in mice injected with AgNO3 or liposomes and sacrificed at day 4 (groups B and C).
Figure 6. (A) Expression of IL-1β in spleen in the mouse model of AA amyloidosis. Spleen sections from inflamed mice treated with AEF and/or liposomes, sacrificed after 1, 6, 24 and 72 h were stained for IL-1β. Areas of white pulp (WP) are marked with a dotted line. IL-1β was detected in the red pulp after 1 h and increased over time. IL-1β increase was more rapid in inflamed mice treated with AEF. (B) Expression of IL-1β in splenic macrophages. Spleen sections from mice treated with AEF/liposomes and AgNO3, sacrificed after 6 h were double labelled for IL-1β and MZMs, MMZMs or RPMs, respectively. Merged images are shown with macrophage marker (green), IL-1β (red) and colocalization (yellow) indicated by arrows. WP: white pulp, RP: red pulp.
Clearance of liposomes
In order to determine the degradation efficiency and organ uptake of liposomes, BODIPY-labelled cholesterol was included in the liposome preparation. Confocal analysis of the preparation revealed rounded structures with intense green fluorescence in the membrane and a diameter ranging from 0.1 to 6 μm (2.5 ± 1.9 μm; mean ± SD) ().
Figure 7. Fate of the liposomes. Mice were injected with BODIPY-fluorescence-labelled liposomes (BODIPY-Lipo) and sacrificed after indicated time points. (A) Blood smears and sections from spleen and liver were examined in a confocal microscope. Images represent the morphology of isolated BODIPY-Lipo before injection, the presence of BODIPY-Lipo in blood smears, spleen and liver sections, respectively. (B) Quantification of BODIPY-Lipo-induced fluorescence in blood, spleen and liver. (C) Liposomes colocalized with lysosomes in the macrophage cell line J774A.1. Cells were incubated with liposomes containing FITC (FITC-Lipo) for 2 h followed by incubation with Lysotracker red for 10 min. Images show FITC-Lipo in green (left), lysosomes in red (centre), and merged images presenting colocalization of liposomes with lysosomes in yellow (right).
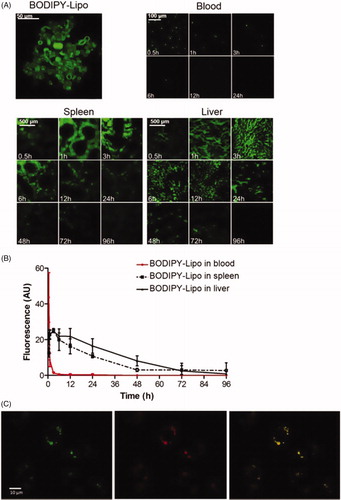
Mice were intravenously injected with BODIPY-Lipo and groups of three mice were sacrificed at selected time points from 0.5 to 96 h. Images of blood smears and sections from spleen and liver were captured, and the fluorescent area was estimated by image analysis (). The liposomes were cleared from the circulation within 1 h, while the uptake in spleen and liver peaked after 3 h. Within 4 days almost all liposomes were cleared from both spleen and liver. In J774A.1 macrophage cell line treated with liposomes containing FITC (FITC-Lipo), we found the fluorescently labelled liposomes accumulated within lysosomes ().
Discussion
The study shows that multilayered neutral liposomes accelerate amyloid formation in a mouse model of AA amyloidosis. The amyloid deposits induced by liposomes appear later and are less pronounced than deposits caused by AEF in inflamed mice, and there are no differences in degrada-tion of SAA. Similarly, to AEF/AgNO3-induced amyloid, the liposomes/AgNO3-induced amyloid is detected in the marginal zones of the spleen and is accompanied by depletion of MZMs.
The mechanism of fibril formation and the morphology of the fibrils are highly dependent on the environment in which they are formed [Citation31]. In this study, we found AA amyloid deposits regardless if AEF or liposomes were injected in the mice treated with inflammatory stimuli. AEF consists of preformed AA amyloid fibrils that serve as seeds for further fibril formation. In contrast, liposomes are not amyloid templates but offer an alternative reaction pathway for the fibrils to form from the precursor protein SAA. Studies on islet amyloid polypeptide (IAPP) have shown that fibril formation can be catalyzed in the presence of anionic phospholipids in vitro. The binding of IAPP to the membrane surface reduced the specific energy barriers and contributed to the mechanism of catalysis [Citation32]. Similarly, the interaction between Aβ peptide and small liposomes resulted in increased local concentration of the peptide that initiated nucleation [Citation33]. Thus, it is likely that the interaction between liposomes and SAA increases the SAA local concentration, which facilitates the aggregation.
The level of cholesterol might also influence fibril formation. It has been found that elevations in islet cholesterol may lead to increase IAPP aggregation [Citation34]. Likewise, it has been shown that the α-synuclein protein contains a cholesterol-binding alpha-helical domain that facilitates the formation of an oligomeric membrane channel [Citation35]. During acute inflammation in mouse, APO-A1 is decreased in HDL and in part replaced by the elevated SAA [Citation36]. Interestingly, it was recently found that SAA impairs the ability of HDL to promote sterol efflux from macrophages in a mouse injected with AgNO3 as well as in human volunteers exposed to endotoxin [Citation37]. Increased intracellular cholesterol levels might impair the function of the lysosomal system and contribute to altered macrophage function [Citation38]. The liposomes prepared in this study contained cholesterol with 20% molar ratio to phospholipid, indicating that cholesterol might influence the fibril formation.
We found increased amyloid deposits in AEF/AgNO3 and AEF/liposomes/AgNO3-treated mice. However, the amyloid load was lower in mice treated with liposomes and AEF in combination as compared with AEF only, even though the same amount of AEF was injected in these groups. Previously, we have shown that the amyloid grade depends on the dose of the seeds [Citation22]. Therefore, we speculate that AEF fibrils are less available as seeds in the presence of liposomes. The ultrastructural investigation revealed affinity of amyloid fibrils to liposomes and perpendicular arrangement of AEF-fibril ends to the liposome membrane (white arrow in ), which might reduce the number of free amyloid ends. Fibril ends are important in the fibril extension process dependent on monomer addition [Citation39]. We and others [Citation17,Citation18] have shown that also extracellular AEF is active in the marginal zone, but when AEF is bound to liposomes the uptake by macrophages might be more efficient. Furthermore, we have shown that MMZMs and MZMs are involved in amyloid formation, in contrast to RPMs [Citation17]. In the presence of liposomes, it is possible that the distribution of AEF between different kinds of tissue macrophages could be altered. If higher amount of AEF is removed from the pool of circulating amyloid fibrils by e.g. RPMs when injected together with liposomes, reduced amount of AEF is available for formation of amyloid deposits.
Liposome clearance from the circulation depends on the size and composition, as well as on the opsonic effect of serum proteins, that determine the uptake rate of the liposomes [Citation40]. Large liposomes (> 400 nm) are cleared more rapidly than smaller. In this study, we used multilayered neutral liposomes, which are directed to the reticuloendothelial system and rapidly taken up from the circulation [Citation41]. In accordance, we found BODIPY-liposomes to be cleared from the blood within 1 h and from the spleen and liver after 96 h. It has been suggested that liposomes are subject to coated pit endocytosis resulting in delivery to lysosomes [Citation42] and our experiments using J774A.1 cells confirm lysosomal localization of the liposomes. Considering that we injected liposomes intravenously and silver nitrate subcutaneously, at the same time, the liposomes were cleared from the blood stream before the SAA levels increased. It is, therefore, plausible to assume that the interaction between liposomes and SAA occurs intracellularly rather than extracellularly. With the use of FRET technique on cultures of J774A.1 cells, it was recently shown that fibril formation starts inside the cell, which supports this theory [Citation19].
Both RPMs and MMZMs appear to be insensitive to amyloid deposition regardless of induction method ( and Supplementary Figure 1). In contrast, amyloid formation is toxic to MZMs and increasing amyloid load leads to a progressive loss of this macrophage subtype. In a previous study, we detected intracellular AA amyloid deposits in all types of splenic macrophages in mice treated with AEF and AgNO3 [17]. Herein we showed that amyloid induction in inflamed mice using AEF and/or liposomes result in the expression of IL-1β by RPMs and to a lower degree by MMZMs. Interestingly, no IL-1β was detected in MZMs. It has been shown in vitro that SAA promotes the expression and secretion of IL-1β in human and mouse peritoneal macrophages [Citation11] but the in vivo activation pathway is still unclear. In mice that received AgNO3 only, no IL-1β expression was found in the spleen. Thus, it seems that additional factors are needed to induce the expression of IL-1β in vivo, and we speculate if amyloid per se might activate the inflammasome. Since we found higher expression of IL-1β in mice injected with AEF and AgNO3 compared with mice injected with liposomes and AgNO3 one hour after treatment, amyloid fibril is a possible candidate. This concept is supported by the finding that oligomers of islet amyloid polypeptide activate the NLRP3 inflammasome leading to pro-IL-1β processing [Citation10].
In cell cultures of J774A.1 cells, Claus et al. showed the presence of intracellular SAA fibrils co-localized with lysosomes and noted that cell viability was reduced when fibril formation increased [Citation19]. Lysosomal proteases including cathepsins B and K are able to process the precursor protein SAA [Citation43,Citation44] and the acidic pH in lysosomes promotes amyloid fibril formation, although the molecular underpinnings are unclear. In a recent study on murine lipid free SAA, it was shown that SAA forms unusually stable soluble oligomers at pH 3.5–4.5 that may escape from lysosomal degradation and contribute to the SAA accumulation in lysosomes and eventually participate in the formation of intracellular amyloid. In addition, lipid vesicles accelerate the conversion of these oligomers from α-helix to β-sheet which involves structural remodelling of both protein and lipid as well as disruption of lipid membrane [Citation45]. When SAA concentration is elevated, it dissociates from HDL and consequently a fraction of SAA might circulate in plasma as lipid-free SAA [Citation46]. When such lipid-free SAA is internalized and accumulates in lysosomes of macrophages, amyloid formation is favoured due to low pH. Moreover, we showed that liposomes are colocalized with lysosomes, and the interaction between liposomes and SAA may promote intracellular amyloid formation. Thus, we speculate that the mechanism for liposome-induced amyloid deposition differs from AEF, although the resulting AA amyloid accumulation and cell toxicity appear to be the same.
In conclusion, we hypothesize that liposomes are phagocytosed by macrophages and accumulates in lysosomes. The lipid metabolism and/or lipid overload interfere with the SAA degradation process leading to high concentration of SAA and incomplete SAA degradation creating a favourable milieu for aggregation and fibril formation. In addition, the presence of lipid membranes allows protein lipid membrane interaction, which further stimulates the fibril formation. Finally, the AA fibrils are released from macrophages and function extracellularly as seed for further fibril formation and fibril growth, similarly to injected amyloid fibrils in AEF.
| Abbreviations | ||
| AA | = | amyloid A protein |
| AEF | = | amyloid-enhancing factor |
| BODIPY-Lipo | = | BODIPY fluorescent-labelled liposomes |
| FITC-Lipo | = | liposomes containing FITC |
| HDL | = | high-density lipoprotein |
| IAPP | = | islet amyloid polypeptide |
| IL | = | interleukin |
| Lipo | = | liposomes |
| MMZMs | = | metallophilic marginal zone macrophages |
| MZMs | = | marginal zone macrophages |
| RPMs | = | red pulp macrophages |
| SAA | = | serum amyloid A |
| TEM | = | transmission electron microscopy |
| TNF | = | tumour necrosis factor |
Figure_1S.jpg
Download JPEG Image (601.8 KB)
Figure_2S.jpg
Download JPEG Image (146 KB)
Acknowledgement
The authors thank Elida Gusthalin for participating in the project, excellent technical assistance and scientific discussions.
Disclosure statement
No potential conflict of interest was reported by the authors.
Additional information
Funding
Related Research Data
References
- Westermark GT, Fändrich M, Westermark P. AA amyloidosis: pathogenesis and targeted therapy. Annu Rev Pathol. 2015;10:321–344.
- Röcken C, Shakespeare A. Pathology, diagnosis and pathogenesis of AA amyloidosis. Virchows Arch. 2002;440:111–122.
- Hazenberg BPC, van Gameren II, Bijzet J, et al. Diagnostic and therapeutic approach of systemic amyloidosis. Neth J Med. 2004;62:121–128.
- Sipe JD, Benson MD, Buxbaum JN, et al. Amyloid fibril proteins and amyloidosis: chemical identification and clinical classification International Society of Amyloidosis 2016 Nomenclature Guidelines. Amyloid. 2016;23:209–213.
- Furlaneto CJ, Campa A. A novel function of serum amyloid A: a potent stimulus for the release of tumor necrosis factor-alpha, interleukin-1beta, and interleukin-8 by human blood neutrophil. Biochem Biophys Res Commun. 2000;268:405–408.
- Patel H, Fellowes R, Coade S, et al. Human serum amyloid A has cytokine-like properties. Scand J Immunol. 1998;48:410–418.
- Church LD, Cook GP, McDermott MF. Primer: inflammasomes and interleukin 1beta in inflammatory disorders. Nat Clin Pract Rheumatol. 2008;4:34–42.
- Arend WP, Palmer G, Gabay C. IL-1, IL-18, and IL-33 families of cytokines. Immunol Rev. 2008;223:20–38.
- Martinon F, Burns K, Tschopp J. The inflammasome: a molecular platform triggering activation of inflammatory caspases and processing of proIL-beta. Mol Cell. 2002;10:417–426.
- Masters SL, Dunne A, Subramanian SL, et al. Activation of the NLRP3 inflammasome by islet amyloid polypeptide provides a mechanism for enhanced IL-1β in type 2 diabetes. Nat Immunol. 2010;11:897–904.
- Niemi K, Teirilä L, Lappalainen J, et al. Serum amyloid A activates the NLRP3 inflammasome via P2X7 receptor and a cathepsin B-sensitive pathway. J Immunol. 2011;186:6119–6128.
- Röcken C, Kisilevsky R. Comparison of the binding and endocytosis of high-density lipoprotein from healthy (HDL) and inflamed (HDL(SAA)) donors by murine macrophages of four different mouse strains. Virchows Arch. 1998;432:547–555.
- Ye RD, Sun L. Emerging functions of serum amyloid A in inflammation. J Leukoc Biol. 2015;98:923–929.
- Takahashi M, Yokota T, Kawano H, et al. Ultrastructural evidence for intracellular formation of amyloid fibrils in macrophages. Virchows Arch A Pathol Anat Histopathol. 1989;415:411–419.
- Nyström SN, Westermark GT. AA-amyloid is cleared by endogenous immunological mechanisms. Amyloid. 2012;19:138–145.
- Chronopoulos S, Laird DW, Ali-Khan Z. Immunolocalization of serum amyloid A and AA amyloid in lysosomes in murine monocytoid cells: confocal and immunogold electron microscopic studies. J Pathol. 1994;173:361–369.
- Lundmark K, Vahdat Shariatpanahi A, Westermark GT. Depletion of spleen macrophages delays AA amyloid development: a study performed in the rapid mouse model of AA amyloidosis. PLoS One. 2013;8:e79104.
- Kennel SJ, Macy S, Wooliver C, et al. Phagocyte depletion inhibits AA amyloid accumulation in AEF-induced huIL-6 transgenic mice. Amyloid. 2014;21:45–53.
- Claus S, Meinhardt K, Aumüller T, et al. Cellular mechanism of fibril formation from serum amyloid A1 protein. EMBO Rep. 2017;18:1352–1366.
- Austyn JM, Gordon S. F4/80, a monoclonal antibody directed specifically against the mouse macrophage. Eur J Immunol. 1981;11:805–815.
- Borges da Silva H, Fonseca R, Pereira RM, et al. Splenic macrophage subsets and their function during blood-borne infections. Front Immunol. 2015;6:480.
- Lundmark K, Westermark GT, Nyström S, et al. Transmissibility of systemic amyloidosis by a prion-like mechanism. Proc Natl Acad Sci USA. 2002;99:6979–6984.
- Kisilevsky R, Boudreau L. Kinetics of amyloid deposition. I. The effects of amyloid-enhancing factor and splenectomy. Lab Invest. 1983;48:53–59.
- Vetrivel KS, Thinakaran G. Membrane rafts in Alzheimer’s disease beta-amyloid production. Biochim Biophys Acta. 2010;1801:860–867.
- Aisenbrey C, Borowik T, Byström R, et al. How is protein aggregation in amyloidogenic diseases modulated by biological membranes? Eur Biophys J. 2008;37:247–255.
- Glabe CG, Kayed R. Common structure and toxic function of amyloid oligomers implies a common mechanism of pathogenesis. Neurology. 2006;66:S74–S78.
- Canale C, Oropesa-Nuñez R, Diaspro A, et al. Amyloid and membrane complexity: the toxic interplay revealed by AFM. Semin Cell Dev Biol. 2018;73:82–94.
- Ganowiak K, Hultman P, Engström U, et al. Fibrils from synthetic amyloid-related peptides enhance development of experimental AA-amyloidosis in mice. Biochem Biophys Res Commun. 1994;199:306–312.
- Puchtler H, Sweat F. Congo red as a stain for fluorescence microscopy of amyloid. J Histochem Cytochem. 1965;13:693–694.
- Sponarova J, Nuvolone M, Whicher C, et al. Efficient amyloid A clearance in the absence of immunoglobulins and complement factors. Am J Pathol. 2013;182:1297–1307.
- Kumar S, Mohanty SK, Udgaonkar JB. Mechanism of formation of amyloid protofibrils of barstar from soluble oligomers: evidence for multiple steps and lateral association coupled to conformational conversion. J Mol Biol. 2007;367:1186–1204.
- Knight JD, Miranker AD. Phospholipid catalysis of diabetic amyloid assembly. J Mol Biol. 2004;341:1175–1187.
- Terakawa MS, Yagi H, Adachi M, et al. Small liposomes accelerate the fibrillation of amyloid β (1-40). J Biol Chem. 2015;290:815–826.
- Wijesekara N, Kaur A, Westwell-Roper C, et al. ABCA1 deficiency and cellular cholesterol accumulation increases islet amyloidogenesis in mice. Diabetologia. 2016;59:1242–1246.
- Fantini J, Carlus D, Yahi N. The fusogenic tilted peptide (67–78) of α-synuclein is a cholesterol binding domain. Biochim Biophys Acta – Biomembr. 2011;1808:2343–2351.
- Cabana VG, Lukens JR, Rice KS, et al. HDL content and composition in acute phase response in three species: triglyceride enrichment of HDL a factor in its decrease. J Lipid Res. 1996;37:2662–2674.
- Vaisar T, Tang C, Babenko I, et al. Inflammatory remodeling of the HDL proteome impairs cholesterol efflux capacity. J Lipid Res. 2015;56:1519–1530.
- Appelqvist H, Sandin L, Björnström K, et al. Sensitivity to lysosome-dependent cell death is directly regulated by lysosomal cholesterol content. Vekrellis K, editor. PLoS One. 2012;7:e50262.
- Xue W-F, Homans SW, Radford SE. Systematic analysis of nucleation-dependent polymerization reveals new insights into the mechanism of amyloid self-assembly. Proc Natl Acad Sci U S A. 2008;105:8926–8931.
- Nogueira E, Gomes AC, Preto A, et al. Design of liposomal formulations for cell targeting. Colloids Surf B Biointerfaces. 2015;136:514–526.
- Ishida T, Harashima H, Kiwada H. Liposome clearance. Biosci Rep. 2002;22:197–224.
- Sharma S, Mishra L, Grover I, et al. Liposomes: vesicular system an overview. Int J Pharm Pharm Sci. 2010;2:11–17.
- Röcken C, Menard R, Bühling F, et al. Proteolysis of serum amyloid A and AA amyloid proteins by cysteine proteases: cathepsin B generates AA amyloid proteins and cathepsin L may prevent their formation. Ann Rheum Dis. 2005;64:808–815.
- Röcken C, Stix B, Brömme D, et al. A putative role for cathepsin K in degradation of AA and AL amyloidosis. Am J Pathol. 2001;158:1029–1038.
- Jayaraman S, Gantz DL, Haupt C, et al. Serum amyloid A forms stable oligomers that disrupt vesicles at lysosomal pH and contribute to the pathogenesis of reactive amyloidosis. Proc Natl Acad Sci USA. 2017;114:E6507–E6515.
- Das M, Gursky O. Amyloid-forming properties of human apolipoproteins: sequence analyses and structural insights HHS public access. Adv Exp Med Biol. 2015;855:175–211.