
Abstract
Amyloidosis is a shared name for several rare, complex and serious diseases caused by extra-cellular deposits of different misfolded proteins. Accurate characterization of the amyloid protein is essential for patient care. Immunoelectron microscopy (IEM) and laser microdissection followed by tandem mass spectrometry (LMD-MS) are new gold standards for molecular subtyping. Both methods perform superiorly to immunohistochemistry, but their complementarities, strengths and weaknesses across amyloid subtypes and organ biopsy origin remain undefined. Therefore, we performed a retrospective study of 106 Congo Red positive biopsies from different involved organs; heart, kidney, lung, gut mucosa, skin and bone marrow. IEM, performed with gold-labelled antibodies against kappa light chains, lambda light chains, transthyretin and amyloid A, identified specific staining of amyloid fibrils in 91.6%; in six biopsies amyloid fibrils were not identified, and in two, the fibril subtype could not be established. LMD-MS identified amyloid protein signature in 98.1%, but in nine the amyloid protein could not be clearly identified. MS identified protein subtype in 89.6%. Corresponding specificities ranged at organ level from 94–100%. Concordance was 89.6–100% for different amyloid subtypes. Importantly, combined use of both methods increased the diagnostic classification to 100%. Some variety in performances at organ level was observed.
Introduction
Amyloidosis is a shared name for a number of rare and serious disease entities that are caused by extracellular deposition of different misfolded proteins. To date, at least 36 proteins have been shown to form amyloid deposits in humans [Citation1], with immunoglobulin light chain (AL) and transthyretin (ATTR) being the most important and frequent ones. Thus, there are several causes of amyloidosis. Aetiologically, the field includes hereditary, relative early on-set forms, via clonal plasma cell disorders to secondary types, which can be caused by chronic kidney failure, chronic inflammatory diseases or chronic infections, and to senile forms.
The pathogenesis of amyloidosis is very complex and affected by multiple factors; some proteins have an intrinsic tendency to fold into an amyloid structure, whereas amyloid deposition of others is accelerated by excess production of an amyloidogenic protein, proteolytic digestion of a wild-type protein into an amyloidogenic fragment, or by either inherited or acquired mutations that change the amino acid sequence of the protein [Citation2].
Symptomatology and the clinical presentation can be very different and depend on which tissues or organs are involved and to which degree. Amyloidosis often presents as a systemic disease, and the systemic form is by far the most serious disease with a tendency to progress and cause failure of involved organs. Though the clinical presentation varies by which organs are involved, it is rather similar for the different amyloid subtypes [Citation1,Citation3]. Because treatment and prognosis are very different for the individual amyloid subtypes, precise and accurate diagnostic sub-classification of the amyloid fibrillary protein in each identified subject is mandatory.
Immunoglobulin light-chain (AL) amyloidosis is caused by plasma cell dyscrasia or B-cell malignancies, where the monoclonal plasma cells or B cells synthesize structural abnormal, misfolded kappa or lambda light chains that are able to aggregate and deposit as amyloid fibrils [Citation3]. By contrast, transthyretin (TTR) is produced by the liver cells as transport protein for the thyroid hormones thyroxine (T4) and triiodothyronine (T3). ATTR amyloidosis exists in two forms: wildtype ATTR (ATTRwt) caused by abnormal folding of the TTR protein, and hereditary ATTR caused by mutations in the gene for TTR (ATTRv) [Citation4]. Whereas there is no causal treatment for cardiac ATTRwt, treatment of ATTRv amyloidosis currently requires liver transplantation [Citation5]. Amyloid A (AA) amyloidosis is caused by chronic inflammatory conditions, eg rheumatoid arthritis or chronic infection [Citation6]. Though being less frequently clinically important in western countries, AA amyloidosis is important in developing countries. The AL kappa, AL lambda, ATTR and AA subtypes of amyloidosis account for about 98% of all subtypes, but several rare subtypes exist [Citation1].
Diagnostic classification of amyloid has traditionally been challenging. Conventional immunohistochemistry (IHC) has been abandoned in many pathology departments due to low sensitivity and low specificity, the latter caused by unspecific staining [Citation7–10]. However, some dedicated diagnostic amyloidosis centres are able to achieve sensitivity above 90% using IHC [Citation11]. Otherwise, more sensitive techniques, such as laser microdissection combined with mass spectrometry and immunoelectron microscopy have been introduced and incorporated in the diagnostic work-up at specialized amyloidosis centres.
Mass spectrometry (MS) can be performed on amyloid protein substance that is dissected by laser microscopy [Citation12–16]. Congo Red positive areas in an organ or tissue biopsy are cut free, and the proteins are proteolytically digested into peptides that are sequenced by tandem mass spectrometry. Besides identifying the amyloid subtype-specific protein the method also identifies a shared amyloid protein signature, thereby offering an internal positive quality control [Citation12]. MS for amyloid identification and subtyping is a preferred method at several centres, eg at the Mayo Clinic [Citation12] and at London Amyloidosis Centre [Citation16].
Immunoelectron microscopy (IEM) has successfully been established at some amyloidosis centres, for example, at the Amyloidosis Research and Treatment Centre, Pavia, Italy [Citation17]. The extreme microscopic magnification allows visualization of the amyloid fibrils. Moreover, after immunostaining with gold-labelled specific antibodies, it can be visualized whether the antibodies bind specifically to the amyloid fibrils or they are unspecifically bound to extracellular proteins not representing amyloid structures. In this way, the low specificity of standard IHC is overcome. Moreover, the visualization of the amyloid fibrils offers a quality control, which is analogue to the amyloid protein signature using MS.
The aim of this study was to compare the use of IEM and MS for amyloid subtyping in Congo Red positive biopsies from different involved organs. It was our hypothesis that both methods would show high sensitivity and specificity but could perform differently at organ level. Moreover, we aimed to analyse the value of the combined use of both methods.
Patients and methods
One hundred twenty Congo Red positive formalin-fixed paraffin-embedded (FFPE) biopsies were randomly selected from the diagnostic biobank at the Department of Pathology at Odense University Hospital. The biopsies were taken in the period 2007 through 2017. Seven biopsies were sampled at post-mortem section. The only criteria for selecting the biopsies were the presence of sufficient amount of material for performing both IEM and MS, eg we excluded biopsies where amyloid was only observed in a very little area of the biopsy, and that we aimed to include 20 biopsies from each of the following organs or tissues: heart, kidney, lung, gastrointestinal mucosa, skin and bone marrow. The biopsies were selected by a pathologist, who was not involved in further analyses. IEM and MS were performed blindly at the Electron Microscopy Lab at the Department of Pathology and at the Clinical Proteomics Laboratory at the Department of Clinical Biochemistry, respectively. The biopsies were marked and the only information that was offered to the labs was the organ or tissue origin of the biopsies. The project was approved be the local Ethics Committee (J.nr. S-20180128) and registered at the Danish Data Protection Agency (J.nr. 18/54959).
Immunoelectron microscopy
Re-embedding
The tissue fragments were cut out from paraffin blocks, dewaxed in three changes of xylene (3 × 30 min.), rehydrated through ethanol series, and post-fixed overnight in a fixative containing 0.5% glutaraldehyde and 2% formaldehyde in phosphate buffer. The tissue fragments were washed in phosphate buffer, stained with 1% osmium tetraoxide in phosphate buffer for 90 min., dehydrated in ethanol series and acetone and embedded in TAAB 812 Embedding Resin (T030, TAAB).
Immunostaining
Semithin (1 μm) sections were cut on Leica Ultracut UCT microtome, stained with toluidine blue and histological structures with potential amyloid deposits localized in light microscope.
Ultrathin (70 nm) sections containing these regions of interest were collected on uncoated nickel grids (M200-NI, Electron Microscope Sciences). The surface of the sections was etched in 3% H2O2 in TBS (0.15 M NaCl, 0.05 M Tris, pH 7.4) for 10 min at room temperature (RT), and the sections heated for 4 h at 60 °C floating on drops of TEG buffer (0.01 M Tris, 0.5 mM EGTA, pH 9). Unspecific binding of antibodies was blocked by incubation in blocking buffer containing 50 mM glycine and 0.1% sodium borohydride in TBS for 10 min at RT followed by incubation in Blocking Solution for Protein A/G Gold conjugates (905.001, Aurion) for 30 min at RT. The primary antibodies were diluted in TNT buffer (0.15 NaCl, 0.1 M Tris pH 7.5, Tween 0.05%) and the incubation performed at 4 °C overnight. The following antibodies were used: Rabbit Monoclonal Anti Serum Amyloid A (AC-0311A, Epitomics) 1:10, Polyclonal Rabbit Anti Human Kappa Light Chains (A0191, DAKO Denmark A/S) at 1:300, Polyclonal Rabbit Anti Human Lambda Light Chains (A0193, DAKO Denmark A/S) at 1:300, and polyclonal rabbit anti human prealbumin (A0002, Dako Denmark A/S) at 1:100. After incubation the sections were washed 6 × 5 min in TNT buffer containing 0.2% BSA-c (900.022, Aurion). The sections were subsequently incubated with Protein A - 10 nm gold conjugate (810.111, Aurion) for 2 h at RT, and washed 3 × 5 min with BSA-c/TNT buffer, twice with TNT and once with TBS. The antibody complexes were immobilized by incubation in 2% glutaraldehyde in phosphate buffer for 10 min at room temperature. The grids were washed three times with H2O and stained with 3% uranyl acetate for 10 min and 3% lead citrate (Leica Ultrostain 2) for 6 min.
The sections were analysed with JEM-1400 Plus electron microscope, equipped with Quemsa TEM CCD camera and images obtained using iTEM (TEM Imaging Platform software). The general immunostaining quality was validated by examining staining of a set of positive controls, stained in parallel with the investigated samples. shows the depicted workflow and typical examples of findings.
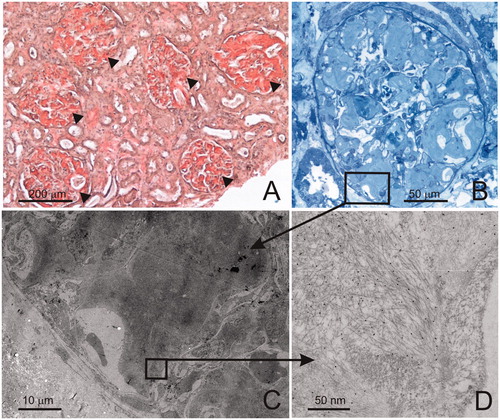
Figure 1. An example of a typical work flow in IEM analysis. A needle biopsy from kidney cortex stained with Congo red shows abundant amyloid deposits located in all glomeruli (arrowheads) and in the interstitium (A). After re-embedding of a fragment of the biopsy in epon, semithin sections are cut and stained with toluidine blue. Glomerulus shows the presence of amyloid deposits (B). Ultrathin sections with the histological structures containing amyloid are cut for the purpose of IEM analysis. In the electron microscope, the same histological structures are localized (C), rectangle in B shows the area photographed in C. The deposits are examined at high magnification for the presence of the characteristic amyloid fibrils and the presence of IEM-positive staining. 10 nm gold particles co-localizing with the fibrils indicate positive staining with antibody against lambda light chains (D). Additionally, the sections are evaluated for signs of unspecific staining (antibody binding to other tissue structures, eg blood plasma, secretory vesicles in the cells, etc.).
The staining results were assigned scores: (1) Unable to localize amyloid fibrils; (2) Amyloid fibrils can be localized by ultrastructure, but the immunostaining is negative; (3) Amyloid fibrils can be localized by ultrastructure, immunostaining positive with one of the panels of antibodies; however, the result is not indisputable (the staining intensity low compared with the positive control, other antibodies give weak staining as well, etc.); (4) Amyloid fibrils can be localized by ultrastructure, indisputable positive immunostaining with one (and only one) of the panels of antibodies.
Mass spectrometry
Microdissection and sample processing
Laser-dissected samples were prepared for proteome analysis as follows: Eight micrometre sections from formalin-fixed, paraffin-embedded tissues were cut onto MMI membrane slides (Molecular Machines and Industries, Eching, Germany), de-paraffinized and stained with Congo Red. Congo Red positive areas were micro-dissected (app. 50,000 µm2/dissection) and processed by incubation in 35 µl 10 mM Tris with 1 mM EDTA and 0,002% Zwittergent at 98 °C for 90 min followed by reduction in the presence of 50 mM dithiotretiol at 50 °C for 30 min and alkylation with 150 mM iodoacetamide for 30 min at RT in the dark. Acetone-precipitated proteins were re-dissolved in 20 µl 200 mM triethylammonium bicarbonate (TEAB) and trypsinated over night at 37 °C with 0.1 µg trypsin. The resulting tryptic peptides were purified using custom made C18 micro columns and analysed by nano-LC-MSMS as described below.
Nano-LC-MSMS analysis
Peptide samples were analysed by nano-LC-MSMS (Dionex RSLCnano 3000) coupled to a Q-Exactive Orbitrap mass spectrometer (Thermo Scientific) using a linear gradient from 95% A (0.1% formic acid) to 28% B (0,1% formic acid in 100 acetonitrile) over 30 or 46 min at a flowrate of 300 nl per minute. Mass spectra were acquired virtually as previously described [Citation18] with the following changes: Dynamic exclusion of selected sequenced ions was set to 0 s, normalized collision energy was 32 eV, intensity threshold for data-dependent MSMS analysis was 27,000 counts/second, and MSMS resolution at 200 m/z was 17,500.
Data analysis
Combined MASCOT-SEQUEST search was performed where peak lists (mgf files) were processed using the Proteome Discoverer software version 1.4.1.14. The search parameters were set to: MS accuracy 10 ppm, MSMS accuracy 0.1 Da for HCD data, with two missed cleavages allowed, fixed modification of cysteine blocked with carbamidomethyl, and variable modifications; methionine oxidation and deamidated asparagines. Tandem mass spectra were searched against the Swissprot database (downloaded 7th November 2012, 452768 entries), restricted to humans. Proteins were inferred on a basis of at least one unique peptide identified with a high confidence (FDR < 1%). For each case, the total number of peptide spectrum matches (PSMs) for the combined MASCOT and SEQUEST searches for the amyloid signature proteins (ApoA1, ApoA4, ApoE, and Serum Amyloid P) and the amyloid-associated proteins (most commonly TTR, AA, kappa, and lambda) were calculated. The true disease-state of a specimen was determined by the amyloid-associated protein with the largest number of PSMs prerequisite that at least 3 out of 4 amyloid signature proteins were also detectable in this particular specimen.
Analogue to the scoring of IEM findings each specimen was scored according to following scheme: 1. Diagnostic amyloidogenic signature not detected; 2. Diagnostic amyloidogenic signature detected, but unable to assign the amyloid proteins to a sub-type. 3: Diagnostic signature detected, but the determination of the amyloid protein uncertain, eg due to the detection of increased levels of more than one amyloid protein (eg both kappa and lambda) or weak signal for the amyloid protein in question. 4: Amyloid protein/amyloid sub-type determined with high confidence.
Statistical analyses
Descriptive statistics are presented as number and percentage (%) for categorical variables and as mean and standard deviation or median and interquartile range (p25–p75) for numerical variables.
To estimate the agreement between IEM and MS in diagnosing subtypes of amyloidosis, we calculated the sensitivity, specificity, positive-predictive value, and negative-predictive value with exact binomial confidence intervals (CI 95%) for IEM compared to MS and reverse. The reverse comparison was performed because of lack of a “gold standard”. Because of the reverse comparison sensitivity is equal to positive-predictive value, and specificity is equal to negative-predictive value in the opposite test.
All statistical analyses were performed in STATA, version 15.1 (StataCorp, College Station, TX, USA).
Results
One hundred and six biopsies from 89 patients were evaluable by both techniques. Thus, in 14 biopsies, the remaining material was insufficient to perform both analyses. Included patients were 63 males, 26 females, and median age 72 years, range 39-89 years. The biopsies originated from heart (n = 19), kidney (n = 17), lung (n = 18), gastro-intestinal mucosa (n = 15), skin (n = 15), and bone marrow (n = 22). In 45.3% of the biopsies, IHC at diagnosis was inconclusive. Moreover, 22.6% of the biopsies were stained by Congo Red only and no IHC was performed. The reason for this seemed in most cases to be that these patients were also diagnosed with plasma cell dyscrasia, and it was simply assumed that the identified amyloid deposit was associated with this, being AL types.
The IEM and MS findings are shown in . In six patients, no amyloid fibrils were detectable by IEM, and in two patients, the detected amyloid fibrils could not be subtyped. Conversely, by MS no amyloid protein signature was observed in two biopsies, and in nine patients, an amyloid signature was present, but the amyloid fibril protein could not be identified according to defined thresholds (). The findings in some biopsies of no amyloid fibrils seen by IEM/no amyloid protein signature identified by MS was probably due to small amounts or no amyloid left in the biopsies. Importantly, in all cases where an inconclusive result was obtained by one method, the amyloid fibrillary protein was identified by the other method ().
Table 1. Number and percentages of assignments to subtypes by IEM and MS analysis of 106 Congo Red positive biopsies.
An important observation was that in three patients with known plasma cell dyscrasia, multiple myeloma in two patients and MGUS in one patient, the amyloid subtype turned out to be of non-AL subtype; ATTR in two subjects and AA in one subject.
In three biopsies, there was disagreement between the findings by IEM and MS. These cases are highlighted in bold in . In all three biopsies, IEM scored the findings strength 4, whereas this was only the case for one of the biopsies with MS, the other two were scored strength 3. These three cases are briefly summarized: (1) the biopsy with strength 4 disagreement was a lung biopsy from an amyloid tumour in a patient with known sarcoidosis treated with azathioprine. MS identified AL kappa, whereas IEM identified ATTR. No B cell clonality, M-protein or serum kappa/lambda abnormality was identified in the patient. IHC had been performed and showed ATTR. Therefore, it seems likely that the IEM diagnosis is correct. (2) Subcutaneous biopsy showed ATTR by IEM (strength 4) and AL lambda by MS (strength 3). IHC was inconclusive. The patient was investigated for suspected cardiac amyloidosis. A DPD scintigraphy showed marked positive myocardial uptake [Citation19]. No B cell clonality, M-protein or serum kappa/lambda abnormality was identified. The case was interpreted as cardiac ATTR. (3) Bone marrow biopsy showed AL lambda by IEM (strength 4) and AL kappa by MS (strength 3). The patient had a small lambda-restrictive plasma cell clone in the bone marrow and imbalanced serum free light chains, kappa 36 mg/L and lambda 135 mg/L. IHC demonstrated lambda positive amyloid. The case was interpreted as AL lambda. Thus, in these three cases, IEM seemed to offer the correct answer.
In three biopsies MS identified amyloid protein that could not be identified by IEM due to the specific antibodies used (). In one case, this was IgH chain C in a biopsy where IEM had negative finding. In another biopsy, MS showed IgG heavy chain subtype 1 and 2 in addition to lambda identified by IEM and MS, and finally MS in a third biopsy showed ATTR in addition to AL kappa identified by both IEM and MS. According to the literature, this is not a rare observation [Citation20,Citation21].
The calculated performances of the methods are presented in . No real “gold standard” could a priori be defined. Therefore, the calculation of the performance of each method was done by comparing the results from one method with the findings from the other method, and vice versa.
Table 2. Sensitivity, specificity, PPV and NPV with 95% confidence intervals asymmetrically assuming both tests as the reference methods as well as concordance with 95% confidence interval.
The sensitivity (strength 3 or 4) for IEM for the amyloid subtypes ranged from 80–100%, overall 91.6%, and for MS the corresponding figures were 87.0–100%, overall 88.8%. The concordance between IEM and MS findings ranged per amyloid subtype from 89.6–100% (). The concordance between IEM and MS findings where both methods identified amyloid protein (strength 3 and 4) was 96.5% (95% CI 90%–99.3%).
At the organ or tissue level () the methods performed equally well. The most excellent and full agreement between IEM and MS (all answers strength 4) was observed for heart biopsies. Second to that IEM showed high strength 4 scores (80–86%) for kidney, skin, and bone marrow biopsies, but had lower strength 4 scores for mucosa (73%) and lung (44.4%) biopsies. For MS strength 4 scores were rather similar 56–68% for all non-cardiac biopsies.
Table 3. Subtype identification scorings divided by type of tissue sample.
At patient level two biopsies taken from different organs or tissues were included from 15 patients and three biopsies from one patient. The analyses of these biopsies from the same patient yielded consistent data by both techniques. In total, 89 patients were examined and sub-classified as AL kappa in 22, AL lambda in 46, ATTR in 19, and AA in two patients.
From a clinician´s perspective, it is essential that the laboratory report is absolutely certain and unambiguous. An answer of strength 3, which would include a “likely” or “probably” or some other expressed uncertainty in the finding, will likely be insufficient for the clinician to make a clear decision for treatment or follow-up. We therefore tested the probability that a strength 3 answer by one method would be confirmed by strength 3 or upgraded to strength 4 by the other method. For IEM, 15 biopsies were graded as strength 3, and in 14 cases (93.3%, 95% CI 68.1%–99.8%), they were confirmed or upgraded to strength 4 by MS. Conversely, for MS, 21 biopsies were graded strength 3, and in 17 cases (81.0%, 95% CI 58.1%–94.6%) they were confirmed 3 or upgraded to strength 4 by IEM.
Discussion
IEM as well as MS have been established as new gold standards for amyloid typing. Our retrospective study confirms that both methods are highly sensitive and show high specificity and predictive values. No single method is perfect, but in our study, the combined use of both methods identified the amyloid protein in all biopsies. However, it should be noted that we had to exclude 14 biopsies due to insufficient amount of material to perform both analyses. The lack of sufficient material partly reflected the retrospective character of the study as we could not rebiopsy the patient which could be done in a normal clinical setting.
In our hands, the methods performed comparably with high sensitivity and specificity for both methods, and our results for LMD-MS as well as for IEM are in accordance with the findings by other groups [Citation12–17]. A fraction of positive findings was not absolutely conclusive by both methods (score strength 3). This was the case for 15 biopsies with IEM and 21 biopsies with MS. In these cases, the supplementary use of the other method yielded confirmatory or conclusive findings in almost all cases. In three cases, we observed discordant findings; however, only in one biopsy, this was at strength 4 level. In these three patients, the additional clinical and para-clinical evaluation, as described in the result section, concluded that IEM yielded the correct answer.
Pros and cons for the use of both methods should be considered. IEM employs a number of specific antibodies to identify the amyloid proteins. In our study, we employed antibodies against kappa, lambda, TTR and amyloid A. They will cover about 98%, but not all, of the potential findings. In contrast, MS potentially identifies all proteins in a sample, and given that an amyloid protein signature is identified, MS offers identification of all present amyloid proteins. In our study, this was exemplified in three biopsies where MS identified an “extra” protein not identified by IEM. In one case, this was IgH chain C in a biopsy where the IEM finding was negative. In another biopsy, MS showed IgG heavy chain subtype 1 and 2 in addition to lambda chain identified by IEM and MS, and finally, MS in a third biopsy showed TTR in addition to kappa identified by IEM and MS. Rare amyloid subtypes were not observed by MS in our cohort, but one of the pros for MS is the fact that such cases can be elucidated, eg LECT2 [Citation22], fibrinogen-alpha [Citation23], or gelsolin [Citation24]. Thus, MS is, in principle, unbiased. Moreover, MS can detect the protein mutations responsible for protein misfolding and fibril formation, such as the detection of hereditary ATTR amyloidosis in cardiac amyloidosis [Citation25] or AGel amyloidosis in renal amyloidosis [Citation24]. Finally, MS generates an enormous wealth of proteomic data for research.
Another issue is the need for tissue amount and quality. MS requires very small amounts of tissue, 0.1 mm2 or less, but the material must be carefully laser dissected to ensure that it is representative. IEM requires more material, preferably 1 mm3 or more. The strengths of IEM involve identifying both the fibrillary structure of amyloid in relation to other tissue elements (extracellular localization, characteristic size and arrangement of fibrils) and positive labelling with antibodies against the specific type of amyloid.
Both methods can be performed on formalin-fixed paraffin-embedded material, although there are challenges for IEM in the process where the tissue fragments are re-embedded in epoxy resin. To improve the odds of re-finding scarce or focal deposits of amyloid in the electron microscope, the re-embedded tissue fragments should be carefully selected by consulting the Congo-Red stained control section, and optimally amyloid deposits localized on toluidine blue stained semi-thin sections prior to cutting ultrathin sections and IEM analysis.
Turn-around time is shorter for MS than IEM. Response time for MS can be minimized to about 2 working days, whereas IEM due to the many processes would need a minimum of 5–6 working days.
Both techniques are costly, require advanced expensive instrumentation and trained academic and technical operators.
In our hands, both methods performed well but not without limitations. IEM showed a slightly higher rate of strength 4 scores (78% vs 70%), and in three cases with discordant findings, the result obtained by IEM was evaluated to be correct. We did not observe any differences between the performances of the two methods at tissue or organ level. Both methods performed particular well on endomyocardial biopsies, and both methods had challenges in lung biopsies. Importantly, the combined use of both methods offered subtype classification of all biopsies.
Another important observation was that we, in three patients with known plasma cell dyscrasia and serum kappa/lambda imbalance, found that the amyloid subtype was of non-AL type. This highlights the necessity to ensure precise and accurate classification of amyloid subtype in all cases. A patient with monoclonal gammopathy of undetermined significance (MGUS) and a concurrent senile ATTR amyloidosis would indeed not need cytoreductive therapy. Thus, in a patient with MGUS or even multiple myeloma, it is not a reliable assumption, a priory, to interpret identified amyloid as being of AL type. Even in a multiple myeloma patient, the finding of AL vs. non-AL type will affect the management and treatment goals.
The present study suffers from some limitations. A major limitation is that it is a retrospective, single-centre study. Although all specimens were randomly collected, there is a selection bias due to the fact that all selected biopsies were known to include Congo red positive amyloid deposits. Moreover, all sample processing procedures, IEM and MS analyses, and data interpretation occurred in the centre. Thus, our study reflects “real daily life” in clinical practice.
In conclusion, we demonstrate that both IEM and MS are sensitive and specific methods for the identification of amyloid proteins in amyloid deposits in biopsies from various organs. The combined use of both methods increased the proportion of defined amyloid type from 91.6% for IEM and 88.8% for MS to 100%. Nevertheless, challenges still remain to be resolved, for example, the detection of more than one potential amyloid protein by MS that frequently occurs in sections from specific tissues, such as lung or bone marrow, or IEM analysis of scanty material. Further research is warranted, and we are performing an ongoing prospective evaluation of both methods at Odense Amyloidosis Centre.
Despite the fact that both methods are powerful tools for subtyping and diagnosis of amyloidosis, our recommendation is that both IEM and MS should be applied to the analysis of biopsies from all organs except for the heart and only in conjunction with competent clinical and pathological assessment to ensure optimal patient management. We acknowledge that routine use of both methods is costly and that both techniques cannot realistically be implemented in most centres. When established, in a centre, though, the analyses can be offered as a core facility for other hospitals. It is very easy to send formalin-fixed paraffin-embedded tissue blocks for examination with both IEM and LMD-MS. Thus, systematizing these methods will not be very cost intensive. At our centre, we offer LMD-MS for Euro 520, and IEM for Euro 461(August 2019 prices). Compared to the costs for the treatment of AL amyloidosis with bortezomib, and maybe upcoming daratumumab, or treatment of ATTR with tafamidis or upcoming small interfering molecules, the costs for diagnostics are reasonable. A few patients treated with these expensive treatments based on a wrong diagnosis will be very expensive and indeed unfortunate. In that perspective these advanced diagnostic tools are cost-effective.
| Abbreviations | ||
| ATTR | = | amyloid transthyretin |
| IEM | = | immunoelectron microscopy |
| IHC | = | immunohistochemistry |
| LMD | = | laser microdissection |
| MS | = | mass spectrometry |
Acknowledgements
The expert technical assistance of Maja Friis Waltersdorff and Christian Enggaard is highly appreciated.
Disclosure statement
The authors report no conflict of interest.
Additional information
Funding
References
- Benson MD, Buxbaum JN, Eisenberg DS, et al. Amyloid nomenclature 2018: recommendations by the International Society of Amyloidosis (ISA) nomenclature committee. Amyloid. 2018;25(4):215–219.
- Dogan A. Amyloidosis: Insights from proteomics. Annu Rev Pathol Mech Dis. 2017;12(1):277–304.
- Merlini G, Dispenzieri A, Sanchorawala V, et al. Systemic immunoglobulin light chain amyloidosis. Nat Rev Dis Primers. 2018;4(1):38.
- Ruberg FL, Berk JL. Transthyretin (ttr) cardiac amyloidosis. Circulation. 2012;126(10):1286–1300.
- Izumiya Y, Takashio S, Oda S, et al. Recent advances in diagnosis and treatment of cardiac amyloidosis. J Cardiol. 2018;71(2):135–143.
- Lane T, Pinney JH, Gilbertson JA, et al. Changing epidemiology of AA amyloidosis: clinical observations over 25 years at a single national referral centre. Amyloid. 2017;24(3):162–166.
- Solomon A, Murphy CL, Westermark P. Unreliability of immunohistochemistry for typing amyloid deposits. Arch Pathol Lab Med. 2008;132:14.
- Satoskar AA, Burdge K, Cowden DJ, et al. Typing of amyloidosis in renal biopsies: diagnostic pitfalls. Arch Pathol Lab Med. 2007;131(6):917–922.2.0.CO;2] [17550319]
- Lachmann HJ, Booth DR, Booth SE, et al. Misdiagnosis of hereditary amyloidosis as AL (primary) amyloidosis. N Engl J Med. 2002;346(23):1786–1791.
- Gilbertson JA, Theis JD, Vrana JA, et al. A comparison of immunohistochemistry and mass spectrometry for determining the amyloid fibril protein from formalin-fixed biopsy tissue. J Clin Pathol. 2015;68(4):314–317.
- Schönland SO, Hegenbart U, Bochtler T, et al. Immunohistochemistry in the classification of systemic forms of amyloidosis: a systematic investigation of 117 patients. Blood. 2012;119(2):488–493.
- Vrana JA, Gamez JD, Madden BJ, et al. Classification of amyloidosis by laser microdissection and mass spectrometry-based proteomic analysis in clinical biopsy specimens. Blood. 2009;114(24):4957–4959.
- Mollee P, Boros S, Loo D, et al. Implementation and evaluation of amyloidosis subtyping by laser-capture microdissection and tandem mass spectrometry. Clin Proteom. 2016;13(1):30.
- Loo D, Mollee PN, Renaut P, et al. Proteomics in molecular diagnosis: typing of amyloidosis. J Biomed Biotechnol. 2011;2011:1.
- Sethi S, Theis JD, Leung N, et al. Mass spectrometry-based proteomic diagnosis of renal immunoglobulin heavy chain amyloidosis. Clin J Am Soc Nephrol. 2010;5(12):2180–2187.
- Rezk T, Gilbertson JA, Mangione PP, et al. The complementary role of histology and proteomics for diagnosis and typing of systemic amyloidosis. J Pathol Clin Res. 2019;5(3):145. [Epub ahead of print].
- Fernández de Larrea C, Verga L, Morbini P, et al. A practical approach to the diagnosis of systemic amyloidoses. Blood. 2015;125(14):2239–2244.
- Beck HC, Jensen LO, Gils C, et al. Proteomic discovery and validation of the confounding effect of heparin administration on the analysis of candidate cardiovascular biomarkers. Clin Chem. 2018;64(10):1474–1484.
- Gillmore JD, Maurer MS, Falk RH, et al. Non-biopsy diagnosis of cardiac transthyretin amyloidosis. Circulation. 2016;133(24):2404–2412.
- Sidiqi MH, McPhail ED, Theis JD, et al. Two types of amyloidosis presenting in a single patient: a case series. Blood Cancer J. 2019;9(3):30.
- Mahmood S, Gilbertson JA, Rendell N, et al. Two types of amyloid in a single heart. Blood. 2014;124(19):3025–3027.
- Mereuta OM, Theis JD, Vrana JA, et al. Leukocyte cell-derived chemotaxin 2 (LECT2)-associated amyloidosis is a frequent cause of hepatic amyloidosis in the United States. Blood. 2014;123(10):1479–1482.
- Rowczenio D, Stensland M, de Souza GA, et al. Renal amyloidosis associated with 5 novel variants in the fibrinogen A alpha chain protein. Kidney Int Rep. 2017;2(3):461–469.
- Sethi S, Dasari S, Amin MS, et al. Clinical, biopsy, and mass spectrometry findings of renal gelsolin amyloidosis. Kidney Int. 2017;91(4):964–971.
- Brown EE, Lee YZJ, Halushka MK, et al. Genetic testing improves identification of transthyretin amyloid (ATTR) subtype in cardiac amyloidosis. Amyloid. 2017;24(2):92–95.