
Abstract
Amyloidosis is a disease group caused by pathological aggregation and deposition of peptides in diverse tissue sites. Apart from the fibril protein, amyloid deposits frequently enclose non-fibrillar constituents. In this study, carpal tunnel tissue sections with ATTR amyloid were analysed by quantitative mass spectrometry-based proteomics. Following manual dissection, tissue samples of equal size and with heterogeneous amyloid load were dissected and forwarded to bottom-up proteome analysis and label-free protein profiling. The amyloid-associated proteins showed significant correlations of label-free intensity profiles. A comprehensive list of 83 proteins specifically enriched in amyloid deposits was discovered. In addition to well-known signature proteins (e.g. apolipoprotein E, apolipoprotein A-IV, and vitronectin), 22 members of the complement system, including all seven components of the membrane attack complex could be associated to the disease. These data lend support to the hypothesis that the complement system is activated in ATTR amyloidosis.
Introduction
Transthyretin amyloidosis (ATTR) is one of the most common systemic forms of amyloidosis, which occurs in two distinct clinical settings, that is, non-hereditary (ATTRwt) and hereditary type (ATTRm). ATTRwt presents with restrictive cardiomyopathy, while ATTRm displays a range of organ involvements including peripheral polyneuropathy. ATTR frequently causes carpal tunnel syndrome (CTS) [Citation1]. Carpal tunnel syndrome is the most common compression syndrome of a peripheral nerve. It mostly affects patients older than 50 years and can be the first symptom of ATTR [Citation2]. It may even precede cardiac manifestation. Patients who undergo surgical treatment for CTS are associated with a higher risk of cardiac amyloidosis and heart failure [Citation3].
Apart from the fibril-forming protein, amyloid deposits often enclose various other non-amyloidogenic but seemingly disease-specific constituents, such as serum amyloid P-component (SAMP), apolipoprotein E (APOE), highly sulphated glycosaminoglycans, laminin, vitronectin (VTNC), apolipoprotein J (CLUS), among others [Citation4–6]. These non-fibrillar constituents may not be simple passive bystanders of the disease. Instead, some have shown to be active contributors to disease initiation, progression, and possibly clearance [Citation7–9]. In addition, proteomic analyses of amyloid occasionally report on the presence of members of the complement system [Citation5,Citation6,Citation10]. The complement system is one of the principal immunologically relevant effector systems that comprises over 14 soluble proteins, a number of receptors and several soluble membrane proteins performing regulatory functions. Its major target are cell membranes. A direct attack that requires participation of all nine complement components leads to irreversible damage and subsequently ultrastructural lesions [Citation11,Citation12]. The terminal pathway is the assembly of the complement components (CO) CO5b, CO6, CO7, CO8, and multiple copies of CO9 into the membrane attack complex (MAC). MAC functions as a transmembrane channel [Citation13–15], causing loss of membrane integrity leading to cell death by necrosis [Citation16].
In most previous proteomic studies, the analysis of ATTR was performed by laser microdissection (LMD) followed by discovery-based bottom-up liquid chromatography–mass spectrometry (LC-MS) analysis [Citation17,Citation18]. These approaches generate qualitative datasets, where the most evident protein identifications are usually defined as amyloidogenic. We employed an alternative approach and explored formalin-fixed and paraffin-embedded (FFPE) tissue sections with ATTRwt by label-free quantification (LFQ). Instead of accurate accumulation of amyloid protein aggregates by LMD, tissue sections similar in size but with heterogeneous amyloid content were prepared by manual microdissection. Applying a LFQ proteome analysis, we found a significant correlation of amyloid-associated proteins by label-free intensity (LFI) profiles. A comprehensive list of amyloid-associated proteins could be generated, which included well-known signature proteins as well as numerous components of the complement system. Based on our data, we propose that the complement cascade is activated locally in ATTR amyloidosis.
Material and methods
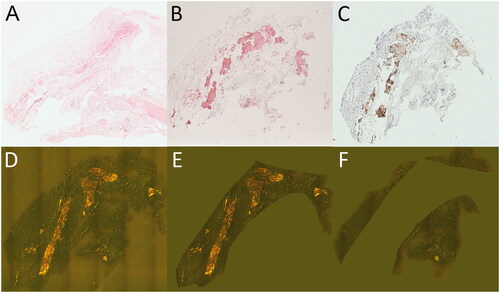
A detailed description of the patient samples, histology and immunohistochemistry, digital image analysis and proteome analysis is provided in Supplementary Material and Methods. Briefly, serial sections from paraffin blocks of carpal tunnel tissue were stained with Congo red to assess the amyloid load by digital image analysis using Congo red fluorescence [Citation19]. The amyloid type was classified immunohistochemically [Citation20] and CO9 was immunostained as described elsewhere [Citation10] (). For each of nine cases of histologically proven ATTR, consecutive tissue sections were dissected into amyloid-enriched and amyloid-depleted regions for proteome analysis (Supplementary Figure 1). The manual microdissection was performed in duplicate providing four samples for each case, which added up to 36 samples for the subsequent bottom-up proteome analysis. The sample preparation included trifluoroacetic acid (TFA) extraction, reduction, alkylation and tryptic digestion according to the SPEED protocol [Citation21]. After sample cleanup by C18 zip-tip, approximately 0.5 µg of peptides were analysed by liquid chromatography-electrospray ionization-mass spectrometry (LC-ESI MS/MS). The samples were separated over a 2 h gradient on a 50 cm C18 nano-uHPLC column and high-resolution mass spectrometry spectra were acquired with a QExactive Plus mass spectrometer. Proteome Discoverer software and the Sequest algorithm were used for peptide identification and LFQ. Statistical evaluation of LFI data was performed with the Perseus software [Citation22]. With the exception of transthyretin, which is conventionally abbreviated to TTR, all other protein names in the text and figures were abbreviated by the mnemonic protein entry names used in the UniProt database. LC-MS raw data were deposited to the ProteomeXchange Consortium via the PRIDE partner repository with the identifier PXD026492 [Citation23].
Figure 1. Carpal tunnel tissue used for quantitative proteome profiling. Formalin-fixed and paraffin-embedded carpal tunnel tissue specimens with ATTR amyloid were stained with haematoxylin and eosin (A), immunohistochemically with antibodies directed against transthyretin (B) and complement CO9 (C), and with Congo red (D–F). Congo red-stained tissue sections were scanned using a Hamamatsu NanoZoomer 2.0 RS scanner in sequential bright field and fluorescence mode (D). Digital image analysis assessed amyloid load in amyloid-enriched (21.1%; E) and amyloid-depleted (1.8%; F) areas, which were subsequently microdissected manually and forwarded to quantitative proteome profiling. Original magnifications 1.8-fold.
Results
LC-MS/MS confirms the presence of transthyretin and discovers multiple modifications of the amyloid protein
The TFA-assisted protein extraction from manually microdissected FFPE tissue sections (volume of 0.061 ± 0.042 mm3) followed by tryptic digestion yielded 4.85 ± 0.79 µg of peptides (Supplementary Figure 2). From each of nine donors, four samples (total number of samples n = 36) were analysed by LC-MS and 1,122 human proteins were identified with high confidence (protein- and peptide-level false discovery rate (FDR) < 1%). On average, LFI values were obtained for 1,001 (± 39) proteins in each sample (Supplementary Figure 3). Log2 transformation of the intensity values produced normally distributed data (Supplementary Figure 4). For each of the nine donors, an average of 928 (± 54) proteins was quantified in all four replicates. 70.4% of the proteins could be quantified in all 36 samples. Transthyretin was found in all samples with full sequence coverage and with a plethora of modifications as detailed in Supplementary Results and Supplementary Figure 5.
Label-free intensity profiles of potential amyloid-associated proteins show strong correlation with transthyretin
Guided by histochemical staining and digital image analysis, we manually microdissected tissue sections with differential ATTR content for comparative quantitative proteome analysis. However, tissue sections showed high technical and biological variability due to differences in amyloid load between different patients and a heterogeneous distribution of amyloid within each specimen. This variability compromises statistical tests evaluating population means as employed in classical comparative quantitative analyses. Therefore, we applied a correlation-based approach on the LFI profiles of quantified proteins across the analysed samples, which depends on a wide spread and distribution of data points. Assuming that the abundances of amyloid-associated proteins correlate with the abundance of the major amyloid protein, we used the profile of TTR as bait to detect associated proteins with strong correlation across the dataset.
To correlate profiles with a sufficient number of data points, the LC-MS dataset was filtered to 970 proteins with at least 26 LFI values across the 36 samples (). This cut-off value was chosen because it provided a highly consistent dataset with a frequency of missing values below 3% and correlation-based comparison of log2 LFI profiles with TTR yielded the highest number of significant results (Supplementary Figure 6). Pearson’s correlation coefficients of 970 profiles against TTR compared to the mean LFI of the protein across all samples are shown in . The data were also tested for Pearson correlation of the LFI values prior to log-transformation to detect proteins with a direct linear association and for Spearman correlation to confirm direct monotonic relationship between the detected proteins and TTR. The highest number of significant results was obtained by Pearson correlation of log-transformed LFI profiles and the results showed a near complete overlap with those obtained by Spearman correlation (D), Supplementary Figure 7).
Figure 2. Transthyretin abundance correlates with amyloid associated proteins. A histogram shows the distribution of Pearson’s correlation coefficients for log2 LFI profiles of 970 proteins compared to the profile of transthyretin (TTR) (A). The number of profiles showing a significant similarity are indicated as stacked columns. The distribution of average label-free intensities compared to Pearson’s correlation coefficients of profiles against TTR is shown in (B). Proteins with significant correlation FDR ≤ 1% and ≤ 5% are shown in green and yellow, respectively. The 14 proteins previously detected in ATTR of affected synovium are highlighted in red font. Highly abundant proteins with no correlation to TTR are indicated by blue colour. Three proteins with a strong negative correlation are orange. The distribution of log2 label-free intensity values for several proteins, and the corresponding distribution of LFI values are shown in (C,D), respectively.
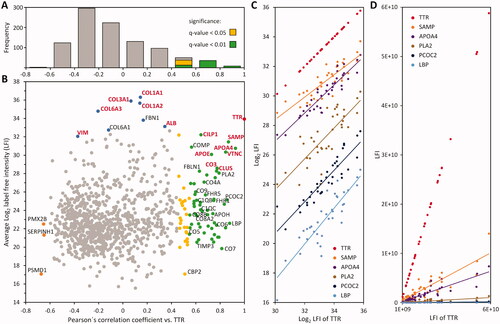
The log2 LFI profiles of 83 proteins showed a significant Pearson correlation with TTR (FDR ≤ 5%), of which 58 protein profiles correlated with an FDR ≤ 1%. Among these 83 proteins, nine proteins showed very strong (r ≥ 0.8), 36 a strong (0.8 > r ≥ 0.6) and 38 a moderate correlation (0.6 > r ≥ 0.4) to TTR. Among the latter, 13 proteins showed significant correlation with a FDR ≤ 1%, and 25 with a FDR ≤ 5% (). The complete dataset including LFQ data, correlation coefficients and protein annotations is provided in Supplementary Table 1.
Comparison with literature data
To verify the functional association of the 83 proteins with ATTR, we compared how many of these proteins were characterised as amyloid associated in previous studies. Proteome analyses of ATTR have been performed on a number of different tissues, including subcutaneous fat aspirates [Citation24,Citation25], heart muscle tissue [Citation24,Citation26–28], synovial membrane [Citation29], bone marrow [Citation30], kidney tissue [Citation31–33], as well as lymph nodes [Citation34]. In most of these studies, the sample preparation preceding proteome analysis included LMD of amyloid deposits followed by discovery-based bottom-up LC-MS analysis. These approaches generate qualitative datasets, where the most evident protein identifications are usually defined as amyloidogenic and amyloid associated. The highest intersection of detected proteins was observed with the dataset from ATTR-affected synovium, which identified 14 proteins in addition to TTR in LMD-enriched amyloid deposits (i.e. albumin, APOA4, APOE, CILP1, CLUS, collagen α-1 (I), collagen α-2 (I), collagen α-1 (III), collagen α-1 (VI), collagen α-2 (VI), CO3, SAMP, vimentin and VTNC) [Citation29]. All of these proteins were also found in our samples (). However, only seven proteins showed a significant correlation with TTR, that is, APOA4, APOE, CILP1, CLUS, CO3, SAMP, and VTNC (). The remaining seven non-correlating proteins included five collagens and albumin (ALB), which are major components of the collagen-rich extracellular matrix of carpal tunnel tissue ().
This shows that the proteins previously found in ATTR can be confidently differentiated by our approach, clearly separating proteins that correlate with the abundance of TTR from high abundant matrix proteins, which are generally most easily detected in the examined tissue (). Although collagen and ALB did not correlate with TTR in the current study, this in general does not negate their relevance to TTR; however, proteins showing such a relationship are likely associated with ATTR on a functional level. Furthermore, the linear relationship observed between log2 LFI-values shows that at least for these detected proteins, the composition of ATTR is consistent between the nine cases. In general, the LFI profiles of associated proteins showed a direct monotonic relationship and the concentration of associated proteins increased slower than the major amyloid protein TTR ().
Biological function of ATTR-associated proteins
To understand the biological context of the proteins correlating with TTR, we then performed annotation enrichment analyses. The selection of 83 proteins (FDR ≤ 5%) was compared to the complete dataset using Fisher’s exact test. Pearson’s r values were subjected to 1 D-annotation enrichment to detect a bias in the distribution of proteins associated with specific functions. A selection of significant findings is summarised in . The complete list is provided in Supplementary Table 2.
Figure 3. GO term enrichment analyses. The annotations of 83 transthyretin-associated proteins were compared to the dataset of 970 quantified proteins. Columns represent the percentage of proteins in the specified category compared to the dataset. The number of proteins annotated with the GO term is indicated inside the graph, FDR values are added to the right. (A) Molecular functions. (B) Biological process. (C) Cellular compartment. (D) Results of 1 D annotation enrichment.
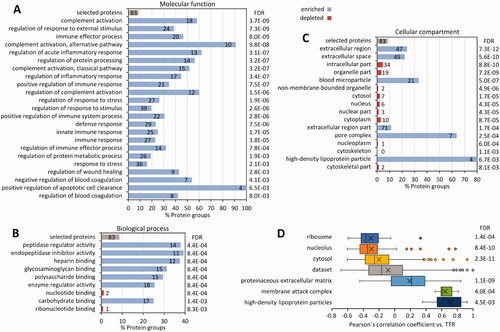
Extracellular proteins were overrepresented in the whole dataset as well as the 83 amyloid-associated proteins (q < 7.3e-12). Conversely, proteins with intracellular annotations were generally underrepresented (Supplementary Figure 3 C). 1 D annotation enrichment clearly showed that intracellular proteins correlated inversely to TTR (Supplementary Figure 3 C–D). The reduction of intracellular proteins matched nicely with the loss of cells, either due to atrophy, necrosis or apoptosis, regularly observed within and around amyloid deposits [Citation10].
The proteins associated with high-density lipoprotein particles have been linked to amyloidosis, with several studies documenting evidence, e.g. for a pathological role of APOE [Citation35] or potentially protective features of the extracellular chaperone CLUS [Citation36,Citation37] in disease development in addition to their colocalization within amyloid deposits [Citation35,Citation38,Citation39]. With four proteins among those linked to TTR (APOA4, CLUS, APOH, and APOE), we observed a significant enrichment of proteins annotated to high-density lipoprotein particles (q-value < 6.7e-3), including one apolipoprotein previously not linked to the disease (APOH). In contrast, the profiles of APOA1, APOB, APOC3, and APOD did not correlate significantly with TTR.
A highly significant finding was the enrichment of proteins involved in the complement system (q-value < 3.7e-9) (). This includes 15 proteins associated with the classical pathway (q-value < 3.2e-7) and 10 of the alternative pathway of complement activation (q-value < 9.8e-8). In addition, all seven components of the MAC (q-value < 9.7e-7) correlated with TTR. A network of the identified components of the complement system and their correlation with ATTR amyloid deposits are summarised in Supplementary Figure 8.
To ensure that the positive correlation of complement components with TTR is not caused by biased serum contamination of amyloid-enriched samples, the profile data were also tested for correlation with ALB. Although ALB did not correlate significantly with TTR, complement components showed strong correlation both with ALB (r = 0.52) and TTR (r = 0.62). However, the Pearson correlation coefficients with the latter were significantly higher (p value = 0.011). In contrast, the 13 immunoglobulin subunits, another subset of the plasma proteins in the dataset, only correlated with ALB (r = 0.58) and not with TTR (r = 0.04) (Supplementary Figure 9). This would not be expected if the observed relationship was a systematic error introduced by serum contamination of amyloid-enriched samples.
The complement-associated proteins correlating with TTR can be categorised as follows: complement components CO3–CO9, including all subunits of complement CO4 and CO8; six proteins associated with complement regulation (FHR1, FHR2, FHR5, CFAH, CLUS, and VTNC), two proteases (CFAD and C1S), and compounds associated with complement pattern recognition (C1QA, C1QB, C1QC, and SAMP). SAMP belongs to the pentraxins [Citation40] and is a known amyloid signature protein, which binds and prevents the degradation of amyloid fibrils [Citation41]. CFAB, an essential part of the alternative pathway’s C3/C5 convertase, showed a weak correlation to TTR (Pearson’s r = 0.39). Additionally, FHR3, C1R, DAF, and C4BPA were detected but did not significantly correlate with TTR. For CO5, correlation to TTR was moderate (Pearson’s r = 0.52; q-value < 0.05), whereas the remaining MAC components CO6–CO9 showed significant (q-value < 0.01) and stronger correlations with TTR abundance. A further indicator of cellular tissue damage is the enrichment of factors associated with positive regulation of apoptotic cell clearance (q-value < 6.5e-3) among proteins correlated to TTR, which included the complement components CO3, CO4A, CO4B, and lactadherin (Supplementary Figure 8). Previous immunohistochemical analyses of diverse tissues presented CO9 as a common amyloid constituent [Citation10]. Using immunohistochemistry, we independently validated the presence of CO9 within the amyloid deposits in all samples of our current series (). Kourelis et al. also described several complement proteins CO3, CO9, CFH, FHR2, and FHR5 to be part of the ATTR-specific heart proteome [Citation6]. Collectively these data provide ample evidence that members of the complement system are spatially enriched in ATTR amyloid.
Discussion
In amyloid research, proteomics has mainly been used as a diagnostic tool, with a primary focus on the identification and characterisation of the fibril-forming protein and possible diagnostic biomarkers of the disease. However, these studies may have missed low abundant proteins and peptides, which are disease-specific and could provide valuable clues to disease manifestation, progression and important pathophysiological processes operating within or in the vicinity of amyloid deposits. In order to systemically explore the nature and role of the amyloid proteome, we applied a novel approach, that is, spatial quantitative proteome profiling. The analytical approach is based on the hypothesis that the abundance of amyloid-associated proteins correlates spatially with the amyloid protein TTR allowing for their differentiation from matrix proteins. Analysis of tissues with variable amounts of amyloid dissected from nine cases of ATTR in CTS by LFQ proteomics, allowed to identify 83 (FDR ≤ 5%) and 58 proteins (FDR ≤ 1%), respectively, which significantly correlated with the log2 LFI profile of TTR as the major amyloid component. Our approach was validated by the enrichment of proteins commonly found in amyloid, some being amyloid signature proteins, that is, APOA4, APOE, and SAMP [Citation4].
Transthyretin was among the proteins with the highest LFI values in our study cohort, even without application of LMD (Supplementary Table 1). The four proteins with higher mean intensity values were collagens, which are major components of connective tissue (). The dynamic range of LFI values was used to evaluate the sensitivity of the detection method. Proteins, which could be associated to TTR with an FDR ≤ 1% cover LFI values ranging from below 9.5e5 for CO7 to above 5e9 for CILP1. When the 25 less confident proteins (FDR ≤ 5%) were included, the dynamic range covers five orders of magnitude, with the lowest intensity of 1.4e5 for the carboxypeptidase B2 (CBP2), while TTR was detected with an average intensity above 1.6e10. In direct comparison, CLUS with an LFI value above 3.2e8 was the protein with the lowest intensity among the proteins previously associated with synovial ATTR () [Citation29].
While the most abundant proteins in amyloid can be detected by accurate excision of amyloid deposits and subsequent qualitative proteome analysis, without additional control samples, it is impossible to differentiate proteins, which may be just as likely identified in unaffected tissue around the deposit. The collagens, fibrinogen, and ALB are likely among this group of factors easily detected even in specifically enriched, microdissected isolates of amyloid due to their general high abundance in the examined tissue. In addition, proteins highly specific for amyloid but only present in low abundance may have remained elusive due to the limitations in sample amount. This is also corroborated by the fact that all of the proteins previously associated to ATTR in synovial tissue [Citation29], are clustered among the proteins we identified with the highest evidence, that is, high number of peptides, sequence coverage, peptide spectrum matches and highest LFI values ().
This shows that our analytical approach, using samples of differential amyloid content, provides a deep coverage of its proteome without the need to enrich amyloid deposits by LMD. Indeed, the majority of proteins found to correlate with TTR are probably amyloid-associated proteins not detected in previous studies due to their low abundance. A functional link between these proteins and amyloid development or the associated tissue remodelling is supported by the functional annotation of the detected proteins, which shows strong associations to biological processes and molecular functions previously connected to the disease (). As it is very difficult to obtain control-tissue from healthy individuals due to ethical reasons, our method provides a more detailed view into the amyloid proteome and facilitates the exploration of its pathophysiology beyond fibril formation.
While our approach provides clear evidence of proteins correlating with TTR in ATTR, there are some limitations of the study. Low abundant proteins and peptides might be distributed unevenly within amyloid deposits carrying the risk of a sampling error. Likewise, with the applied experimental design, interindividual variability of the amyloid proteome cannot be detected. With four samples per patient the number of data points is not sufficient for a correlation-based comparison of the profiles of individual cases. This could be achieved if more samples from a single case are analysed.
Interestingly, 22 (FDR≤ 5%) and 18 (FDR ≤ 1%) proteins associated to TTR, respectively, are linked to the complement system. The comprehensive association of complement components to ATTR achieved in this study strongly suggest that the complement system is activated in ATTR, which is in line with previous observations of a regular and spatial enrichment of CO3, CO9, and other complement components in diverse types of amyloid [Citation6]. Kourelis et al. have indicated that there might be a difference between differentially expressed complement components in ATTR and AL amyloidosis with cardiac involvement [Citation6]. In amyloidosis related to neuronal disorders some complement components were associated with Alzheimer’s disease [Citation42].
The terminal pathway of the complement system is the assembly of the factors CO5b, CO6, CO7, CO8 heterotrimer, and multiple copies of CO9 into the MAC [Citation13,Citation15,Citation16]. MAC is the common end of three pathways, that is, the classical, lectin, and alternative complement pathway (Supplementary Figure 8). Also common for all three pathways is the cleavage and activation of CO3, which was also detected by our approach. Activation of the complement system converges on the generation of three broad effector systems that serve to enable the complement to fulfil its physiological functions in host defence: (1) direct lysis of targeted surfaces by MAC, (2) alerting and priming the immune system by potent proinflammatory anaphylatoxins, and (3) opsonisation and clearance of target surfaces by opsonins (CO4b, CO3b, CO3bi) and engagement of complement receptors on phagocytic cells [Citation43]. However, amyloid rarely leads to a strong local inflammatory reaction, except for the presence of macrophages and scarce multinucleated giant cells [Citation44]. Thus, despite the presence of diverse members of the complement system, counter mechanisms are operative and could explain the presence of CLUS, plasminogen, and VTNC, all three known inhibitors of the complement system [Citation45]. Additionally, complement inhibitor FHR, as well as FHR1, FHR2, and FHR5 might compete in complement cascade regulation (for a review see [Citation46]), which all correlated significantly with TTR. Dysregulation of the complement system has been linked with Alzheimer’s disease and could be a more general phenomenon [Citation47], that is, also functional in extracerebral amyloidoses. Harmful inappropriate or excessive complement activation can lead to tissue injury with serious consequences including cell death.
In summary, our study is the first to show that spatial quantitative proteome profiling of amyloid is able to provide deeper insights into disease mechanisms, which may have been missed by proteome analyses focussing primarily on the amyloid fibril protein. We found a specific and spatial enrichment of diverse members of the complement system in ATTR of the carpal tunnel tissue. Future studies are urgently needed as activation of the complement system, for example, in the heart by ATTR, may have profound effects on tissue homeostasis and patient survival. It may also open novel avenues for treatment, that is, combating the deleterious effects of the activation of the complement system in amyloidosis.
| Abbreviations | ||
| ALB | = | Albumin |
| APO | = | Apolipoprotein (APOE, APOAI, APOAIV, APOB, APOC3, APOD, APOH) |
| ATTR | = | Transthyretin amyloidosis |
| ATTRm | = | Hereditary type transthyretin amyloidosis |
| ATTRwt | = | Non-hereditary type transthyretin amyloidosis |
| C4BPA | = | C4b-binding protein alpha chain |
| CBP2 | = | Carboxypeptidase B2 |
| CFAB | = | Complement factor B |
| CFAD | = | Complement factor D |
| CFAH | = | Complement factor H |
| CILP1 | = | Cartilage intermediate layer protein 1 |
| CLUS | = | Apolipoprotein J |
| CO | = | Complement component (CO3, CO4A, CO4B, CO5, CO6, CO7, CO8A, CO8B, CO8G, CO9) |
| CTS | = | Carpal tunnel syndrome |
| C1QA | = | Complement C1q subcomponent subunit A |
| C1QB | = | Complement C1q subcomponent subunit B |
| C1QC | = | Complement C1q subcomponent subunit C |
| C1S | = | Complement C1s subcomponent |
| C1R | = | Complement C1r subcomponent |
| DAF | = | Complement decay-accelerating factor |
| FDR | = | False discovery rate |
| FHR | = | Complement factor H-related protein (FHR1, FHR2, FHR3, FHR5) |
| FFPE | = | Formalin-fixed and paraffin-embedded |
| LC-ESI MS/MS | = | Liquid chromatography-electrospray ionization-mass spectrometry |
| LC-MS | = | Liquid chromatography–mass spectrometry |
| LC-MS/MS | = | Liquid chromatography–mass spectrometry/mass spectrometry |
| LFI | = | Label-free intensity |
| LFQ | = | Label-free quantification |
| LMD | = | Laser microdissection |
| MAC | = | Membrane attack complex |
| SAMP | = | Serum amyloid P-component |
| TFA | = | Trifluoroacetic acid |
| TTR | = | Transthyretin |
| VTNC | = | Vitronectin |
Supplemental Material
Download Zip (3.5 MB)Acknowledgements
The authors thank Hans-Michael Behrens for his assistance with the digital image analysis.
Disclosure statement
The authors declare no conflict of interest.
Additional information
Funding
Related Research Data
References
- Rowczenio D, Quarta CC, Fontana M, et al. Analysis of the TTR gene in the investigation of amyloidosis: a 25-year single UK center experience. Hum Mutat. 2019;40(1):90–96.
- Hahn K, Urban P, Meliß RR, et al. Carpal tunnel syndrome and ATTR-amyloidosis. Handchir Mikrochir Plast Chir. 2018;50(5):329–334.
- Fosbol EL, Rorth R, Leicht BP, et al. Association of carpal tunnel syndrome with amyloidosis, heart failure, and adverse cardiovascular outcomes. J Am Coll Cardiol. 2019;74(1):15–23.
- Benson MD, Buxbaum JN, Eisenberg DS, et al. Amyloid nomenclature 2020: update and recommendations by the international society of amyloidosis (ISA) nomenclature committee. Amyloid. 2020;27(4):217–222.
- Brambilla F, Lavatelli F, Di Silvestre D, et al. Shotgun protein profile of human adipose tissue and its changes in relation to systemic amyloidoses. J Proteome Res. 2013;12(12):5642–5655.
- Kourelis TV, Dasari SS, Dispenzieri A, et al. A proteomic atlas of cardiac amyloid plaques. JACC Cardiooncol. 2020;2(4):632–643.
- Ancsin JB, Kisilevsky R. The heparin/heparan sulfate-binding site on apo-serum amyloid A. Implications for the therapeutic intervention of amyloidosis. J Biol Chem. 1999;274(11):7172–7181.
- Coker AR, Purvis A, Baker D, et al. Molecular chaperone properties of serum amyloid P component. FEBS Lett. 2000;473(2):199–202.
- Kisilevsky R. The relation of proteoglycans, serum amyloid P and apo E to amyloidosis current status, 2000. Amyloid. 2000;7(1):23–25.
- Lux A, Gottwald J, Behrens HM, et al. Complement 9 in amyloid deposits. Amyloid. 2021;28(3):199–208.
- Müller-Eberhard HJ. Complement. Annu Rev Biochem. 1969;38:389–414.
- Tegla CA, Cudrici C, Patel S, et al. Membrane attack by complement: the assembly and biology of terminal complement complexes. Immunol Res. 2011;51(1):45–60.
- Esser AF, Kolb WP, Podack ER, et al. Molecular reorganization of lipid bilayers by complement: a possible mechanism for membranolysis. Proc Natl Acad Sci USA. 1979;76(3):1410–1414.
- Kolb WP, Haxby JA, Arroyave CM, et al. Molecular analysis of the membrane attack mechanism of complement. J Exp Med. 1972;135(3):549–566.
- Podack ER, Müller-Eberhard HJ, Horst H, et al. Membrane attach complex of complement (MAC): three-dimensional analysis of MAC-phospholipid vesicle recombinants. J Immunol. 1982;128(5):2353–2357.
- Papadimitriou JC, Drachenberg CB, Shin ML, et al. Ultrastructural studies of complement mediated cell death: a biological reaction model to plasma membrane injury. Virchows Arch. 1994;424(6):677–685.
- Dasari S, Theis JD, Vrana JA, et al. Amyloid typing by mass spectrometry in clinical practice: a comprehensive review of 16,175 samples. Mayo Clin Proc. 2020;95(9):1852–1864.
- Vrana JA, Gamez JD, Madden BJ, et al. Classification of amyloidosis by laser microdissection and mass spectrometry-based proteomic analysis in clinical biopsy specimens. Blood. 2009;114(24):4957–4959.
- Puchtler H, Sweat F, Levine M. On the binding of Congo red by amyloid. J Histochem Cytochem. 1962;10(3):355–364.
- Hahn K, Nilsson KPR, Hammarstrom P, et al. Establishing and validating the fluorescent amyloid ligand h-FTAA (heptamer formyl thiophene acetic acid) to identify transthyretin amyloid deposits in carpal tunnel syndrome. Amyloid. 2017;24(2):78–86.
- Doellinger J, Schneider A, Hoeller M, et al. Sample preparation by easy extraction and digestion (SPEED) - a universal, rapid, and detergent-free protocol for proteomics based on acid extraction. Mol Cell Proteomics. 2020;19(1):209–222.
- Tyanova S, Cox J. Perseus: a bioinformatics platform for integrative analysis of proteomics data in cancer research. In: von Stechow L, editor. Cancer systems biology: Methods and protocols. New York (NY): Springer New York; 2018. p. 133–148.
- Vizcaino JA, Deutsch EW, Wang R, et al. ProteomeXchange provides globally coordinated proteomics data submission and dissemination. Nat Biotechnol. 2014;32(3):223–226.
- Dogan A. Classification of amyloidosis by mass spectrometry-based proteomics. Amyloid and related disorders surgical pathology and clinical correlations. Berlin/Heidelberg: Springer; 2012. p. 261–272.
- Vrana JA, Theis JD, Dasari S, et al. Clinical diagnosis and typing of systemic amyloidosis in subcutaneous fat aspirates by mass spectrometry-based proteomics. Haematologica. 2014;99(7):1239–1247.
- Helder MR, Schaff HV, Nishimura RA, et al. Impact of incidental amyloidosis on the prognosis of patients with hypertrophic cardiomyopathy undergoing septal myectomy for left ventricular outflow tract obstruction. Am J Cardiol. 2014;114(9):1396–1399.
- Maleszewski JJ, Murray DL, Dispenzieri A, et al. Relationship between monoclonal gammopathy and cardiac amyloid type. Cardiovasc Pathol. 2013;22(3):189–194.
- Rezania K, Pytel P, Smit LJ, et al. Systemic transthyretin amyloidosis in a patient with bent spine syndrome. Amyloid. 2013;20(2):131–134.
- Lavatelli F, Vrana JA. Proteomic typing of amyloid deposits in systemic amyloidoses. Amyloid. 2011;18(4):177–182.
- Puffer RC, Spinner RJ, Bi H, et al. Fatal TTR amyloidosis with neuropathy from domino liver p.Val71Ala transplant. Neurol Genet. 2019;5(5):e351.
- Sethi S, Theis JD, Leung N, et al. Mass spectrometry-based proteomic diagnosis of renal immunoglobulin heavy chain amyloidosis. Clin J Am Soc Nephrol. 2010;5(12):2180–2187.
- Sethi S, Vrana JA, Theis JD, et al. Laser microdissection and mass spectrometry-based proteomics aids the diagnosis and typing of renal amyloidosis. Kidney Int. 2012;82(2):226–234.
- Sethi S, Vrana JA, Theis JD, et al. Mass spectrometry based proteomics in the diagnosis of kidney disease. Curr Opin Nephrol Hypertens. 2013;22(3):273–280.
- D'Souza A, Theis J, Quint P, et al. Exploring the amyloid proteome in immunoglobulin-derived lymph node amyloidosis using laser microdissection/tandem mass spectrometry. Am J Hematol. 2013;88(7):577–580.
- Wisniewski T, Drummond E. APOE-amyloid interaction: therapeutic targets. Neurobiol Dis. 2020;138:104784.
- Lee KW, Lee DH, Son H, et al. Clusterin regulates transthyretin amyloidosis. Biochem Biophys Res Commun. 2009;388(2):256–260. 16
- Torres-Arancivia CM, Chang D, Hackett WE, et al. Glycosylation of serum clusterin in Wild-Type Transthyretin-Associated (ATTRwt) amyloidosis: a study of Disease-Associated compositional features using mass spectrometry analyses. Biochemistry. 2020;59(45):4367–4378.
- Gottwald J, Röcken C. The amyloid proteome: a systematic review and proposal of a protein classification system. Crit Rev Biochem Mol Biol. 2021;56(5):526–542.
- Mollee P, Boros S, Loo D, et al. Implementation and evaluation of amyloidosis subtyping by laser-capture microdissection and tandem mass spectrometry. Clin Proteomics. 2016;13:30.
- Sjoberg AP, Trouw LA, Blom AM. Complement activation and inhibition: a delicate balance. Trends Immunol. 2009;30(2):83–90.
- Pepys MB. The pentraxins. Front Immunol. 2018;9(2382):2382.
- Krance SH, Wu CY, Zou Y, et al. The complement Cascade in Alzheimer's disease: a systematic review and meta-analysis. Mol Psychiatry. 2019.
- Dunkelberger JR, Song WC. Complement and its role in innate and adaptive immune responses. Cell Res. 2010;20(1):34–50.
- Röcken C, Stix B, Brömme D, et al. A putative role for cathepsin K in degradation of AA and AL amyloidosis. Am J Pathol. 2001;158(3):1029–1038.
- Ricklin D, Hajishengallis G, Yang K, et al. Complement: a key system for immune surveillance and homeostasis. Nat Immunol. 2010;11(9):785–797.
- Cserhalmi M, Papp A, Brandus B, et al. Regulation of regulators: role of the complement factor H-related proteins. Semin Immunol. 2019;45:101341.
- Schartz ND, Tenner AJ. The good, the bad, and the opportunities of the complement system in neurodegenerative disease. J Neuroinflammation. 2020;17(1):354.