
 ?Mathematical formulae have been encoded as MathML and are displayed in this HTML version using MathJax in order to improve their display. Uncheck the box to turn MathJax off. This feature requires Javascript. Click on a formula to zoom.
Abstract
Background
Tafamidis inhibits progression of transthyretin (TTR) amyloid cardiomyopathy (ATTR-CM) by binding TTR tetramer and inhibiting dissociation to monomers capable of denaturation and deposition in cardiac tissue. While the phase 3 ATTR-ACT trial demonstrated the efficacy of tafamidis, the degree to which the approved dose captures the full potential of the mechanism has yet to be assessed.
Methods
We developed a model of dynamic TTR concentrations in plasma to relate TTR occupancy by tafamidis to TTR stabilisation. We then developed population pharmacokinetic–pharmacodynamic models to characterise the relationship between stabilisation and measures of disease progression.
Results
Modelling individual patient data of tafamidis exposure and increased plasma TTR confirmed that single-site binding provides complete tetramer stabilisation in vivo. The approved dose was estimated to reduce unbound TTR tetramer by 92%, and was associated with 53%, 56% and 49% decreases in the rate of change in NT-proBNP, KCCQ-OS, and six-minute walk test disease progression measures, respectively. Simulating complete TTR stabilisation predicted slightly greater reductions of 58%, 61% and 54%, respectively.
Conclusions
These findings support the value of TTR stabilisation as a clinically beneficial treatment option in ATTR-CM and the ability of tafamidis to realise nearly the full therapeutic benefit of this mechanism.
Clinicaltrials.gov identifier
NCT01994889
Introduction
Transthyretin (TTR; also known as prealbumin) is a secreted homotetrameric protein that binds retinol-binding protein and thyroxine, facilitating their conveyance in blood, cerebrospinal fluid and vitreous humour. The liver is the major site of TTR synthesis in the periphery. Assembly of TTR monomers, which occurs in the endoplasmic reticulum, produces the homotetramer that is capable of binding two molecules of retinol-binding protein and two molecules of thyroxine [Citation1].
Transthyretin-mediated amyloidosis (ATTR amyloidosis) is caused when circulating TTR dissociates to monomer, misfolds and abnormally deposits in tissues. Amyloid deposition occurs in a variety of tissues and organs throughout the body including peripheral nerves and the heart, resulting in the two main presentations of disease [Citation2]: transthyretin amyloid polyneuropathy (ATTR-PN, formerly called familial amyloid polyneuropathy) and transthyretin amyloid cardiomyopathy (ATTR-CM). ATTR-CM can be caused by wild-type TTR (formerly called senile systemic amyloidosis) or variant TTR [Citation2] (formerly called familial amyloid cardiomyopathy). Inheritance of variant TTR is autosomal dominant. ATTR-PN is always hereditary while ATTR-CM has both hereditary and non-hereditary origins. The most common variant causing hereditary ATTR-CM is Val122Ile, which is present in 3.4% of African Americans [Citation3]. The non-hereditary form of ATTR-CM is caused by the deposition of wild-type TTR that presents predominantly as heart failure with preserved ejection fraction in the elderly. Symptoms include shortness of breath, fatigue, heart failure, loss of consciousness and abnormal heart rhythms. Median survival for untreated ATTR-CM is ∼3–5 years after diagnosis [Citation4,Citation5]. Prevalence in the US is ∼120,000, of which only ∼4% of patients are diagnosed [Citation6].
It is well established that dissociation and aggregation of TTR is a hallmark of TTR amyloidosis, and these processes have been extensively studied [Citation7]. In brief, circulating TTR tetramer dissociates at the dimer–dimer interface, followed by formation of folded monomer. This is a transient species that can reform tetramer or misfold, forming a species with the potential to irreversibly aggregate and deposit as amyloid in tissue. In ATTR-CM, disease-causing variants, such as Val122Ile, destabilise the native tetramer, accelerating amyloid deposition.
Tafamidis is a first-in-class molecule designed to inhibit the dissociation of TTR to monomeric forms. Currently, it is also the only approved drug for the treatment of wild-type and hereditary ATTR-CM. The findings from the phase 3 Transthyretin Cardiomyopathy Clinical Trial (ATTR-ACT) demonstrated that tafamidis is an effective and safe therapy for treating patients with ATTR-CM [Citation8]. Tafamidis and other molecules from this class, known as TTR stabilisers, bind in one or both of the two thyroxine-binding pockets at the TTR dimer–dimer interface and inhibit tetramer dissociation, resulting in stabilisation and increased abundance of the tetramer [Citation9]. While the primary pharmacology is thought to be via the reduction in TTR monomer, it is possible the increase in tetramer TTR may also impact disease progression. In the present study, TTR stabilisation is defined as the degree to which the tetramer dissociation rate is decreased in human plasma following 20 mg or the approved 80 mg once-daily (qd) doses of tafamidis [Citation10]. This definition was chosen because the change in TTR dissociation rate under therapeutic and physiologic conditions is the most clinically relevant measure of pharmacologic activity for this class. However, in the literature, the term TTR stabilisation has various meanings and often is applied to methods that do not measure the tetramer dissociation rate and/or employ non-physiological conditions such as addition of denaturants [Citation11,Citation12]. The only published method that measures actual TTR stabilisation under physiological conditions, such as in human plasma, is subunit fraction exchange [Citation13,Citation14]. In this assay, the appearance of mixed tetramer species from a starting solution of labelled and unlabelled homotetramers is assessed over time to provide a direct measure of the rate of tetramer dissociation. Results from subunit fraction exchange have clearly demonstrated single-site binding is sufficient for maximal TTR stabilisation in vitro [Citation15].
Herein, we have comprehensively leveraged physiologically relevant measures of tafamidis binding to TTR tetramer and albumin along with therapeutically relevant individual patient data from the phase 3 ATTR-ACT trial to characterise the relationship between TTR occupancy, TTR stabilisation, and measures of disease progression in patients with ATTR-CM treated with tafamidis. The model-based characterisation of these data is, in turn, used to assess the degree to which the clinically approved daily 80 mg dose of tafamidis achieves the inherent potential for this overall class of TTR kinetic stabilisers.
Methods
Recombinant TTR expression and purification
Untagged TTR and N-terminally tagged 2 × FLAG-TTR were each cloned into a pET-29a vector. Each construct was transformed into BL21-CodonPlus-RIPL Escherichia coli cells [Agilent]. Transformed cells were grown at 37 °C in Luria–Bertani–kanamycin media to an optical density 600 of 0.6–0.8, induced with 1 mM isopropyl β-D-1-thiogalactopyranoside, and expressed overnight at 20 °C.
For 2 × FLAG-TTR, cell pellets were resuspended in lysis buffer 1 (25 mM Tris pH 8.0, protease inhibitor cocktail tablet [Pierce], Benzonase® Nuclease [Millipore], 1 mM beta-mercaptoethanol) and lysed by microfluidizer. The lysate was then spun down and the supernatant was ammonium sulphate precipitated in two steps using 50% and 90% ammonium sulphate. The 90% pellet was resuspended in 25 mM Tris pH 8.0 and dialysed against the same buffer at 4 °C overnight. The sample was then incubated at 60 °C for 30 min to precipitate contaminant proteins, then spun down and purified by anion exchange using a HiTrap® Q FF column [Cytiva], followed by size-exclusion chromatography using a HiLoad® 16/600 Superdex® 75 pg column [Cytiva] equilibrated in 100 mM potassium chloride, 10 mM sodium phosphate pH 7.6. Untagged TTR was purified in an identical manner, but with the heat purification step excluded.
Isothermal titration calorimetry
Consistent with previously published methods [Citation16], recombinant wild-type TTR was diluted to 12.5 µM in 100 mM potassium chloride, 10 mM sodium phosphate pH 7.6 and 2.5% (volume per volume) dimethyl sulphoxide. Tafamidis was diluted to 200 µM in an identical buffer then injected, 2 µL at a time, into the protein solution at 25 °C with a reference power of 10 µCal/s and 150 s spacing between injections using a MicroCal PEAQ-ITC automated isothermal titration calorimeter [Malvern Panalytical]. Integrated heats were best fit with a co-operative binding model with two affinity sites with independent enthalpy changes ().
Subunit fraction exchange
Human plasma was isolated from pooled blood samples from five male and five female donors aged 43–65 years and stored at −20 °C. Prior to initiating subunit exchange experiments, plasma samples were thawed overnight at 4 °C, spun in a microcentrifuge at 14,000 rpm for 10 min, and mixed with 0.05% sodium azide (100× dilution of sodium azide). Consistent with previously published methods [Citation13], tafamidis in dimethyl sulphoxide was diluted 100-fold into plasma at the indicated concentrations. To initiate subunit exchange, 1 µM of recombinant 2 × FLAG-TTR was added to the plasma and the samples were incubated at room temperature. At the indicated time points, 10 µL of each sample was added to 3 µL of 1.04 mM of the TTR-specific covalent fluorophore stilbene A2, incubated overnight at room temperature and diluted the following day with 52 µL of 50 µM sodium phosphate pH 7.6. The samples were then injected into a Sepax Proteomix® SAX-NP1.7 anion exchange column (1.7 μm nonporous particle size, 2.1 × 50 mm column) and eluted using the non-linear gradient shown in Supplementary Table S1. Stilbene A2 fluorescence was monitored with excitation wavelength 328 nm and emission wavelength 430 nm, and each peak corresponding to the five different TTR homo- and hetero-tetramers was integrated to measure the relative abundance of each tetrameric species.
Albumin binding
Binding of tafamidis to human serum albumin (HSA, 5 µM) in Dulbecco’s phosphate-buffered saline (DPBS) pH 7.4 was determined with AmiKa® MicroEquilibrium Dialysers (500 μL chamber volume). Ultrathin membranes (molecular weight cut-off 5000 Da) were rinsed with distilled water, then placed in DPBS and allowed to soak for 1 h. Tafamidis stock solutions of 5 µL in 50% acetonitrile in water were diluted into 2.5 mL of 5 µM HSA in DPBS to final concentrations between 0.3 and 100 µM. The pre-soaked membranes were placed into the dialysis chambers, DPBS (500 μL) was added to one side of the chamber, and the 5 µM HSA matrix (500 μL) containing the test compound was added to the other side of the chamber. The chambers were then placed into an enclosed, heated rocker, which was pre-warmed to 37 °C and allowed to incubate overnight. After 24 h of incubation, both sides were sampled. Aliquots were removed from the donor (50 μL) and receiver (250 μL) chambers and placed into 96-well deep plates. Blank 5 µM HSA (50 μL) was added to the wells containing the receiver samples, and blank DPBS (250 μL) was added to the wells containing the donor samples, then two volumes of acetonitrile (600 μL) were added to each well. The plates were vortexed and centrifuged at 2000 g for 10 min. Aliquots of the supernatant were removed and analysed by standard liquid chromatography-tandem mass spectrometry methods. The fraction unbound () was calculated according to EquationEquation 1
(1)
(1) :
(1)
(1)
General model development procedures
Model optimisation was performed with NONMEM 7.4.3 using the first-order conditional estimation method with interaction and minimisation of the −2 log-likelihood objective function value. Model results were visualised with R v4.0.3 and RStudio v1.4.1717. Throughout model development, addition and subtraction of model parameters was assessed using the likelihood ratio test where significance is determined by the change in the objective function value based on an distribution with degrees of freedom equal to the difference in the number of estimated parameters. Generally, a
value ≤.05 was considered significant for addition of a new parameter and a
value ≤.001 was considered significant for removal of a parameter. Population model covariates considered included age, body weight, height, sex, race, TTR genotype, baseline Kansas City Cardiomyopathy Questionnaire Overall Summary (KCCQ-OS) score and baseline New York Heart Association (NYHA) class. Continuous covariates were normalised to their approximate population median value. Model parameter confidence intervals were determined via Perl-speaks-NONMEM v4.9.0 by either nonparametric bootstrapping (∼1000 bootstraps) stratified by tafamidis treatment or by log-likelihood profiling.
 estimation from isothermal titration calorimetry, subunit fraction exchange and albumin-binding data
Data obtained from isothermal titration calorimetry (ITC), subunit fraction exchange and albumin-binding experiments were simultaneously modelled to estimate a common set of tafamidis-binding dissociation constants to TTR ( and
) and albumin (
) across all three experiments. This required construction of a set of ordinary differential equations (ODEs) to describe each experimental condition as a function of tafamidis binding to TTR and albumin according to Supplementary Equations S1–S59.
Predicted ITC isotherms were calculated following the equations described in Freiburger et al. [Citation17] for two-site co-operative binding to TTR tetramer, with minor modifications. A scaling factor was calibrated for each of the four ITC replicates to account for experimental variability of the TTR protein concentration in the starting solution. ITC data were modelled simultaneously with subunit fraction exchange and albumin-binding data to characterise the results as a function of and
according to Supplementary Equations S1–S17. Residual model error was delineated as an additive normal distribution.
Subunit fraction exchange was calculated as previously reported [Citation13], with minor modifications. To account for daily instrumentation variability, the predicted area of each peak was determined based on the total peak area of each daily measurement rather than the total peak area on day 0. The fraction of unlabelled TTR in each of the three subunit exchange replicate experiments was calibrated against the known addition of 2 × FLAG-TTR (1 µM). Subunit fraction exchange data were modelled simultaneously with ITC and albumin-binding data to characterise the results as a function of
and
according to Supplementary Equations S18–S51. The model was fit to peak 3 data, corresponding to the tetramer species with two native and two 2 × FLAG-TTR subunits, as it had the lowest error of the five subunit species peaks. Residual model error was delineated as an additive normal distribution.
Albumin-binding data were modelled simultaneously with ITC and subunit fraction exchange data to characterise the results as a function of according to Supplementary Equations S52–S59. Residual model error was delineated as an additive normal distribution.
Prediction of unbound tafamidis fraction in human plasma
Assuming TTR and albumin represent the only binding partners in plasma, estimates of
and
were used to predict unbound tafamidis fraction as a function of tafamidis concentration in human plasma obtained from healthy donors. Consistent with the midpoint of normal ranges, plasma albumin and TTR concentrations were presumed to be 640 and 4 µM, respectively [Citation18]. In order to validate the assumption regarding binding partners and the accuracy of the estimated binding constants, predictions were compared with unbound fractions determined in human plasma (
) via standard equilibrium dialysis methods over a range of tafamidis concentrations (3–300 µM) [Citation19].
Clinical data for analysis
Clinical data from the phase 3 ATTR-ACT (NCT01994889) trial were used in this analysis. This double-blinded, placebo-controlled, 30-month clinical trial consisted of two tafamidis meglumine treatment groups (20 and 80 mg). The placebo and 20 and 80 mg tafamidis groups, respectively, consisted of 133, 67 and 131 wild-type TTR genotype patients, and 43, 19 and 41 variant TTR genotype patients. This study was conducted in compliance with the ethical principles originating in or derived from the Declaration of Helsinki and in compliance with all International Conference on Harmonisation (ICH) Good Clinical Practice (GCP) Guidelines. All study participants provided a signed and dated informed consent document (ICD) and release of medical information (ROMI) form.
Development of a population albumin concentration–time model
Individual albumin concentrations demonstrated time dependency ranging from individuals with slight elevations with time to individuals with marked declines with time. To account for these variable time dependencies of albumin, a single-state ordinary differential model was constructed (Supplementary Equations S60–S68). The model presumed a fixed albumin degradation rate () calculated from a degradation half-life (t½, deg,
) of 21 days [Citation20]. The time dependency of albumin concentration was modelled as a linear slope of change (
) of the albumin production rate (
). Interindividual variability (IIV) consisted of proportional variability on the initial albumin concentration (
) and additive variability on
The additive IIV of
allowed individuals to have increasing, decreasing or negligible changes in albumin concentration with time. The
IIV required a Box–Cox distribution-shaping transformation (
< .001) and had covariates of age (
< .001), race (
= .02), TTR genotype (
< .001) and baseline NYHA class (
= .01). The
IIV did not require inclusion of any covariates. Residual model error was delineated as a lognormal distribution.
Development of a population TTR binding and concentration–time model
Like albumin, TTR concentrations in patients treated with placebo displayed IIV in baseline values and time dependency. However, unlike albumin, tafamidis is expected to affect TTR concentrations directly via inhibition of dissociation to less stable monomers. As such, TTR concentrations over time were simultaneously characterised as a function of IIV in TTR production rate, and also as a function of tafamidis concentration. Individual TTR concentrations for patients treated with placebo demonstrated time dependency ranging from individuals with slight elevations over time to individuals with marked declines over time. To account for these variable time dependencies of TTR, a linear slope of change () in the TTR production rate (
) was estimated. The model presumed a fixed unbound TTR overall elimination rate (
) with an elimination half-life (t½, el,
) of 2.67 days [Citation21] for the wild-type TTR genotype. The unbound TTR dissociation rate to monomer (
) was presumed to be TTR genotype dependent. Consistent with results reported from physiologically relevant in vitro studies, tafamidis-bound TTR dissociation rates to monomer were assumed to be negligible for both single (
) and double (
) occupancy [Citation15]. The appropriateness of this assumption in the context of the phase 3 ATTR-ACT trial data was also explored through estimation of a dissociation rate for singly bound TTR. The association rate of monomer back to tetramer (
) was assumed to be much slower than the monomer degradation rate (
), thus allowing removal of these two non-identifiable parameters from the model. The degradation rate of unbound TTR (
) was assumed to be independent of TTR genotype and tafamidis occupancy, and taken as the difference between
and wild-type
Albumin kinetic parameters of individual patients (
and
) were taken from the aforementioned albumin concentration–time model. The degradation rate of tafamidis-bound albumin was assumed to be equivalent to unbound albumin. Binding dissociation constants of tafamidis to TTR and albumin were fixed to those estimated from the aforementioned simultaneous modelling of the ITC, subunit fraction exchange and albumin-binding data. The final model structure used to characterise the relationship between tafamidis and TTR concentrations is depicted in . Six ODE states were required to portray the binding of tafamidis to TTR and albumin and their synthesis and elimination kinetics. The pharmacokinetics of tafamidis was simplified to the use of each individual’s average steady-state tafamidis plasma concentrations (
). This was deemed a reasonable simplification since tafamidis has a shallow peak-to-trough ratio associated with daily dosing [Citation22]. Model IIVs consisted of proportional variability on
and additive variability on
The additive IIV of
allowed individuals to have increasing, decreasing or negligible changes in TTR concentration with time. The
IIV had covariates of age (
= .003) and baseline NYHA class (
= .002). The
IIV did not require inclusion of any covariates. To compute the fractional change from baseline of total TTR (
), unbound unstabilised TTR (
), and TTR monomer (
) concentrations of individual patients, an additional ODE state was simulated for TTR in the absence of any tafamidis binding. Residual model error was delineated as a lognormal distribution. Data were characterised according to Supplementary Equations S69–S100.
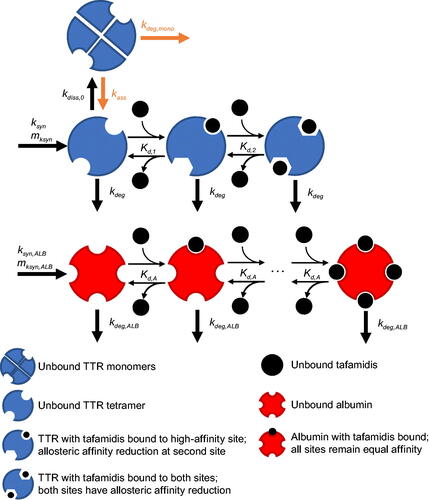
Figure 1. Schematic of plasma TTR and albumin concentration–time models.
Development of population disease progression response–time models
Independent population pharmacodynamic models were developed to describe the disease progression measures of N-terminal pro-B-type natriuretic peptide (NT-proBNP) plasma concentration, KCCQ-OS score and six-minute walk test (6MWT) distance. For all three measures, a simple model of linear change in response over time was sufficient to characterise observed placebo data. These linear models consisted of two estimated parameters, an initial baseline value, and a slope of change with time. Both parameters included IIV. The effect of tafamidis on these three response measures was incorporated into the slope of change with time via attenuation by each individual patient’s estimates from the aforementioned TTR concentration–time model and a maximum effect scaling parameter (
).
NT-proBNP concentration–time model
The NT-proBNP model IIVs consisted of lognormal variability on both the initial concentration () and the linear slope of change with time (
). The
IIV had covariates of age (
<.001), baseline body weight (
<.001) and baseline KCCQ-OS score (
<.001). The
IIV required a Box–Cox distribution-shaping transformation (
=.003) but did not require inclusion of any covariates. A correlation term was required between the two IIVs (
<.001). Residual model error was delineated as a lognormal distribution. Data were characterised according to Supplementary Equations S101–S106.
KCCQ-OS score–time model
The KCCQ-OS model IIVs consisted of logit-normal variability with bounds of 0 and 101 on the initial score () and lognormal variability on the linear slope of change with time (
). The
IIV had a covariate baseline NYHA class (
<.001) while the
IIV required no covariates. Both the
and
IIVs required Box–Cox distribution-shaping transformations (
<.001 each). Residual model error was delineated as a logit-normal distribution with bounds of 0 and 101. Data were characterised according to Supplementary Equations S107–S113.
6MWT distance–time model
The 6MWT model IIVs consisted of lognormal variability on both the initial distance () and the linear slope of change with time (
). The
IIV had covariates of age (
<.001), sex (
<.001), TTR genotype (
<.001), baseline body weight (
<.001), baseline NYHA class (
<.001) and baseline KCCQ-OS score (
<.001). The
IIV did not require inclusion of any covariates. Both the
and
IIVs required Box–Cox distribution-shaping transformations (
<.001 and
=.005, respectively). Residual model error was delineated as an additive normal distribution. Data were characterised according to Supplementary Equations S114–S119.
Results
Characterisation of tafamidis binding to TTR and albumin in plasma
Our goal was to develop a binding model () for the association of tafamidis with TTR incorporating the two binding sites of tafamidis to TTR as well as the binding of tafamidis to albumin. This required determination of the binding constants of tafamidis to TTR and albumin. Simultaneous modelling of data obtained from ITC, subunit fraction exchange and albumin-binding experiments provided precise estimates of tafamidis-binding affinities to TTR of 5.08 (4.1–6.3) and 203 (160–250) nM ( and
), and to albumin of 3.53 (3.0–4.2) µM (
) (). A full list of parameter estimates (Supplementary Tables S2–S4) and goodness-of-fit plots (Supplementary Figures S1–S3) of the binding experiments are provided in Supplementary Materials. The estimated Kds align well with literature reported values [Citation10,Citation11] as well as data from surface plasma resonance (data not presented). The good fit to experiments performed in buffer as well as human plasma suggests binding factors in plasma, such as thyroxine and retinal binding protein 4, are not significantly affecting tafamidis binding to TTR. Consistent with previous reports [Citation15], modelling the data with estimation of a TTR dissociation rate in the presence of singly bound tafamidis (
) provided a negligible estimate close to zero (dissociation half-life greater than a decade) and demonstrated an insignificant improvement in the model fit (
=.97). Predictions of tafamidis
at concentrations between 3 and 300 µM (Supplementary Figure S4) were well within the experimental variability associated with compounds exhibiting extensive (
≤ 0.01) binding in plasma, suggesting all significant binding events were captured by the model [Citation23].
Figure 2. Data and modelling of in vitro binding experiments. Model fit (line) of tafamidis:TTR molar ratio ITC thermogram data (ΔQ, green circles) (A). Model fit (line) of tafamidis:TTR subunit fraction exchange in human plasma data (coloured circles) with time (B). Model fit (line) of unbound albumin unbound fraction () data (green circles) as a function of total tafamidis concentration (C).
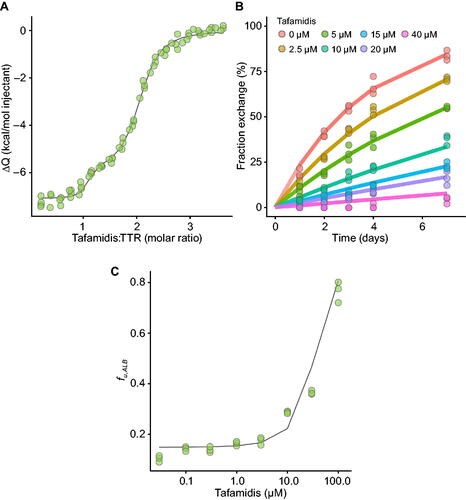
Figure 3. TTR concentration–time profiles per tafamidis meglumine dose per TTR genotype. Observed TTR concentrations (green circles), individual predictions (gray lines) and population predictions of individual’s demographics (orange lines).
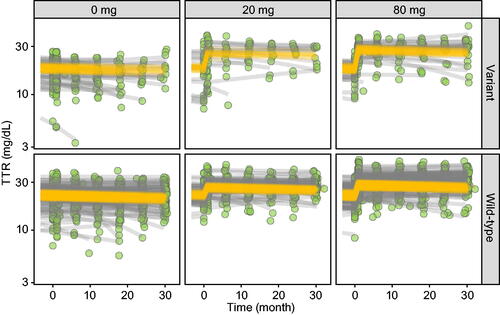
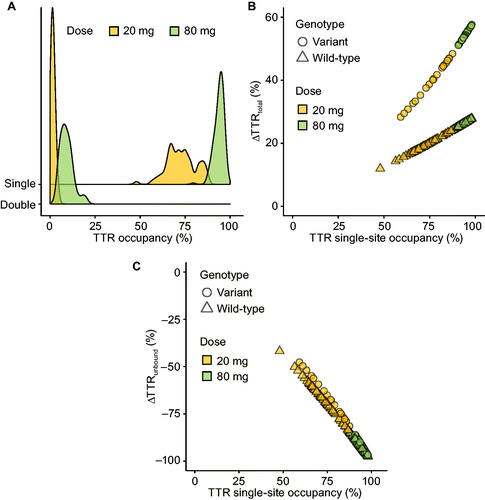
Figure 4. TTR single- and double-site occupancy histograms per tafamidis meglumine dose (A). Relationship between the change in total TTR from baseline () and single-site TTR occupancy per TTR genotype and per tafamidis meglumine dose with 100% occupancy estimates shown with tick marks (B). Relationship between the change in unbound unstabilised TTR from baseline (
) and single-site TTR occupancy per TTR genotype and per tafamidis meglumine dose (C).
Population albumin concentration–time model
Sufficient numbers of study patients demonstrated systematic time varying albumin concentrations to warrant model description. A model of albumin concentration versus time was developed where a linear model provided the best fit of the data. At study initiation, the population average albumin concentration was 4.03 g/dL (605 µM). The average rate of change in albumin concentration across the population was estimated to be −0.0567 g/dL/y, with a range of −0.531 to +0.123 g/dL/y across individuals (Supplementary Figure S5). Parameter estimates (Supplementary Table S5) and goodness-of-fit plots (Supplementary Figure S5) are provided in Supplementary Materials.
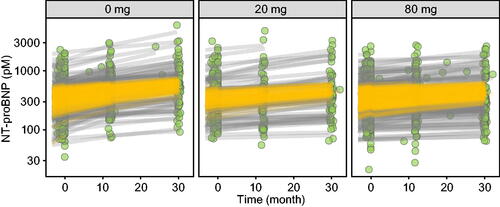
Figure 5. NT-proBNP concentration–time profiles per tafamidis meglumine dose. Observed NT-proBNP concentrations (green circles), individual predictions (gray lines) and population predictions of individual’s demographics (orange lines).
Population TTR binding and concentration–time model
The final model structure used to characterise the relationship between tafamidis and TTR concentrations is depicted in . At study initiation, the population average TTR concentrations for wild-type and variant TTR genotypes were 22.6 and 17.1 mg/dL (4.10 and 3.11 µM), respectively. Consistent with the known propensity for dissociation among variants, the lower initial TTR concentration in patients with a variant genotype was captured via a roughly two-fold faster unbound tetramer to monomer dissociation rate as compared with patients with a wild-type genotype (0.00500 vs. 0.00241 1/h ). As with albumin, TTR concentrations were found to systematically vary with time in placebo patients and a linear model was developed to account for this change in concentration with time. The average rate of change in TTR concentration in untreated patients was estimated to be −0.600 mg/dL/y, with a range of −10.8 to +3.37 mg/dL/y across individuals (). Parameter estimates (Supplementary Table S6) and goodness-of-fit plots (Supplementary Figure S6) are provided in Supplementary Materials.
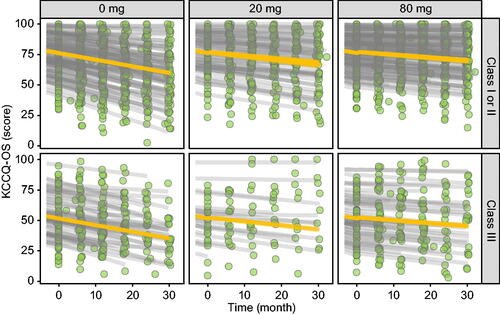
Figure 6. KCCQ-OS score–time profiles per tafamidis meglumine dose per baseline NYHA class. Observed KCCQ-OS scores (green circles), individual predictions (gray lines) and population predictions of individual’s demographics (orange lines).
Fractional TTR occupancy
Population average plasma tafamidis concentrations associated with 20 and 80 mg qd doses were 8.8 and 35 µM. Based on individual exposures and the aforementioned binding affinity constants derived from in vitro studies (
and
), tafamidis meglumine doses of 20 and 80 mg are estimated to achieve average population single-site TTR occupancy of 73% and 94%, and dual-site TTR occupancy of 1% and 9% ().
Effect of tafamidis on total and unbound TTR concentrations
Tafamidis meglumine doses of 20 and 80 mg increased total TTR concentration by respective population averages of 19% and 26% in patients with a wild-type TTR genotype and by 40% and 55% in patients with a variant TTR genotype. The fractional change from baseline in total TTR ( was genotype-dependent and approximately linear with single-site TTR occupancy (). Modelling the data with allowance of a TTR dissociation rate for singly bound TTR (
) >0 resulted in an estimated rate that was <10% of that estimated of unbound TTR (
) and did not improve the model fit to a degree that would warrant its inclusion (
=.29). This result is consistent with our in vitro results and literature reports, indicating that the dissociation rate of TTR in the presence of singly bound tafamidis is, effectively, negligible. The theoretical maximum
with 100% TTR occupancy is predicted to be only slightly higher than the population average achieved with 80 mg tafamidis meglumine (i.e. 26% vs. 29% in patients with wild-type TTR and 55% vs. 59% in patients expressing variant TTR).
Unbound TTR concentrations are estimated to have decreased by an average of 67% and 92% with tafamidis meglumine doses of 20 and 80 mg (). The variability of the decline in unbound TTR was low in the 80 mg group, with only a single individual having <85% reduction. The estimated fractional change from baseline in unbound TTR concentration () was essentially independent of TTR genotype and approximately linear with single-site TTR occupancy.
Population disease progression response–time models
Population pharmacokinetic–pharmacodynamic models were developed to characterise the relationship between TTR tetramer binding, TTR stabilisation and three measures of ATTR-CM disease progression, namely plasma NT-proBNP concentration, KCCQ-OS score and 6MWT distance. The change in all three measures of disease progression were best described by a linear model where the rate of change had a linear relationship with the fractional change from baseline in TTR monomer concentrations as an effect of tafamidis treatment.
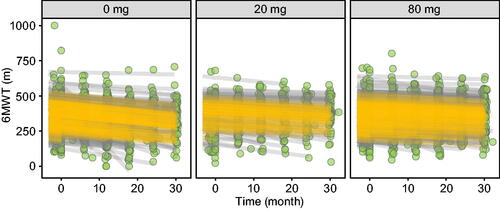
For NT-proBNP concentrations, the population average at study initiation was 441 pM, and the average rate of change was + 93.3 pM/y in untreated patients, with a range of + 4.41 to + 1220 pM/y across individuals (). Tafamidis meglumine doses of 20 and 80 mg were estimated to inhibit this increase in NT-proBNP by 39% and 53%, respectively. For KCCQ-OS scores, the population averages at study initiation were 76.2 and 52.3 for baseline NYHA I/II and NYHA III individuals, respectively. The average rate of change was + 6.28 y−1 in untreated patients, with a range of + 0.0345 to + 12.0 y−1 across individuals (). Tafamidis meglumine doses of 20 and 80 mg were estimated to inhibit this decline in KCCQ-OS by 41% and 56%, respectively. And for 6MWT distances, the population average at study initiation was 347 m, and the average rate of change was −47.3 m/y in untreated patients, with a range of −6.21 to −342 m/y across individuals (). Tafamidis meglumine doses of 20 and 80 mg inhibited this decline in 6MWT by 36% and 49%, respectively.
Figure 7. 6MWT distance–time profiles per tafamidis meglumine dose. Observed 6MWT distances (green circles), individual predictions (gray lines) and population predictions of individual’s demographics (orange lines).
The maximal effect on NT-proBNP concentration, KCCQ-OS score and 6MWT distance that could be achieved by 100% occupancy of TTR by a small molecule were estimated using the model to be 58%, 61% and 54%, respectively, compared with 53%, 56% and 49% obtained with the 80 mg dose of tafamidis. Thus, the approved dose of tafamidis realised >90% of the theoretical maximal effect on these three clinically meaningful measures of ATTR-CM disease progression.
A full list of NT-proBNP, KCCQ-OS and 6MWT model parameter estimates are provided in Supplementary Tables S7 − S9, respectively, along with model goodness-of-fit plots (Supplementary Figures S7–S9).
Discussion
The degree to which first-in-class drugs unlock the therapeutic potential of novel molecular mechanisms of action largely defines the remaining within-class opportunity for pharmaceutical research and development. Unrealised value to patients results from a suboptimal balance in the pharmacology—absorption, distribution, metabolism and excretion, and/or safety characteristics of such molecules—which, in turn, provides the basis for clinically meaningful best-in-class design strategies. Because the demonstration of differentiation often requires long-term and costly clinical trials, best-in-class design strategies should be underwritten by a robust evaluation of data from first-in-class molecules. This work describes such an evaluation for tafamidis, a first-in-class TTR stabiliser.
Tafamidis binds to the interface of two component proteins of the TTR tetramer, thereby slowing the dissociation to component monomers involved in the formation of pathogenic protein aggregates known as amyloid fibrils. As such, an assessment of the TTR occupancy achieved at the clinically approved doses of tafamidis is a critical component of this assessment. To this end, plasma concentration measurements from the phase 3 ATTR-ACT trial were used to infer TTR occupancy based on in vitro estimates of the binding affinity to the two known binding partners in human plasma, TTR ( and
) and albumin (
). Consistent with that reported previously, modelling data from ITC, subunit fraction exchange and equilibrium dialysis studies () provided
and
estimates of 5.08 and 203 nM, respectively [Citation11]. As expected from its anionic nature at physiological pH, tafamidis was also determined to bind extensively to albumin as characterised by a
value of 3.53 µM for four independent binding sites (). Use of these values provided reasonably accurate predictions of the concentration-dependent unbound fraction of tafamidis in human plasma measured over a concentration range of 3–300 µM, and provided confidence in the TTR occupancies inferred by these parameters (Supplementary Figure S4). Based on these parameters, 20 and 80 mg daily doses provided near maximal first site occupancy (73% and 94%, respectively) and very little second site occupancy (1% and 9%, respectively). Because the occupancies of the two sites are so disparate, it is critical to understand the relative contribution of first- and second-site binding to overall TTR stabilisation. While kinetic stabilisation experiments have demonstrated that single-site binding is sufficient to effectively stop dissociation in vitro, such a conclusion has not been examined based on in vivo data. We therefore developed a concentration–time model of TTR to investigate the relationship between occupancy and stabilisation in vivo.
Dissociation of TTR to component monomers is one of the established clearance pathways for TTR, with patients expressing variant TTR having lower circulating TTR concentrations. As such, changes in circulating TTR concentrations represent the degree to which TTR has been stabilised, and therefore, a means by which the occupancy–stabilisation relationship can be examined in vivo. However, such an exercise is complicated by interindividual differences in baseline TTR concentrations as well as drug-independent changes in TTR concentration over the course of the 30-month phase 3 ATTR-ACT trial. Occupancy calculations are likewise complicated by interindividual differences in baseline albumin concentrations and changes over the course of 30 months. As such, a population model of albumin and TTR concentrations was constructed in order to infer TTR occupancy over 30 months based on individual measures of tafamidis, TTR and albumin concentrations. This also allowed for delineation of the effect of occupancy on circulating TTR concentrations over 30 months of tafamidis treatment as a measure of in vivo stabilisation in the phase 3 ATTR-ACT trial. Our results indicate that the approved dose of tafamidis provides an elevation in TTR concentrations in patients with wild-type (26%) and variant (55%) subjects that is near what would be expected with complete stabilisation of TTR (29% and 59%, respectively). This finding indicates that the approved dose of tafamidis provides a degree of stabilisation that is near the maximum achievable within the class (i.e. TTR dissociation <10%).
In order to better understand the extent to which the approved dose of tafamidis realises the full potential of the class in terms of patient-relevant outcomes, the model was extended to measures of ATTR-CM severity and progression. These included disease-relevant measures at the level of biochemical biomarkers (NT-proBNP concentration), patient reports (KCCQ-OS score) and objective functional measures (6MWT distance). While it would have been ideal to also include an analysis of mortality, the binary and stochastic nature of mortality data provided insufficient power to perform such an analysis. Consistent with the disease pathology and molecular mechanism of TTR stabilisation, these endpoints were modelled as a function of the fractional change from baseline of TTR monomer concentrations (). In the model, this fractional change in monomer concentrations is the product of the increase in total TTR concentration and the extent to which the rate of dissociation to component monomers has been inhibited. The
in the presence of tafamidis proportionally decreased the rates of change (slopes) of these biomarkers over the 30 months of treatment. The results of this exercise suggest that the approved dose of tafamidis inhibited the rate of increase in NT-proBNP concentration by 53%, the rate of decline in KCCQ-OS score by 56%, and the rate of decline in 6MWT distance by 49%. These estimates are very close to those predicted assuming complete ablation of monomer concentrations (58%, 61% and 54%, respectively). Consistent with the effect on TTR stabilisation, this finding indicates that the approved dose of tafamidis provides a beneficial effect on disease-relevant measures that is near the maximum achievable within the class. It should be noted that a role of bound TTR tetramers in disease progression cannot be excluded. Data from in vitro experiments using purified recombinant TTR and trypsin suggest stabilised native tetramer can contribute to fibril formation via proteolytic cleavage [Citation24]. If this mechanism is active in vivo, treatments utilising mechanisms different from TTR stabilisation may have different maximal efficacy by also inhibiting the contribution of stabilised tetramers.
In conclusion, these results indicate that the clinically approved dose of tafamidis achieves a near-maximum (>90%) effect on both TTR stabilisation and disease-relevant measures (NT-proBNP concentration, KCCQ-OS score and 6MWT distance) for the class. As such, identifying differentiated medicines within the class of molecules broadly classified as TTR stabilisers might be challenging.
| Abbreviations | ||
| 6MWT | = | six-minute walk test |
| ATTR-ACT | = | Tafamidis in Transthyretin Cardiomyopathy Clinical Trial |
| ATTR-CM | = | transthyretin amyloid cardiomyopathy |
| ATTR-PN | = | transthyretin amyloid polyneuropathy |
| DPBS | = | Dulbecco’s phosphate-buffered saline |
| HSA | = | human serum albumin |
| IIV | = | interindividual variability |
| ITC | = | isothermal titration calorimetry |
| KCCQ-OS | = | Kansas City Cardiomyopathy Questionnaire Overall Summary |
| NT-proBNP | = | N-terminal pro-B-type natriuretic peptide |
| NYHA | = | New York Heart Association |
| ODE | = | ordinary differential equation |
| qd | = | once daily |
| TTR | = | transthyretin |
Supplemental Material
Download MS Word (3.1 MB)Acknowledgements
The authors thank Zachary Johnson and Laura Byrnes for executing and providing the data for the subunit fraction exchange and ITC experiments. Manuscript formatting support was provided by and funded by Pfizer; no contribution was made to editorial content.
Disclosure statement
D.A.T., T.S.M., Z.L., C.B., J.F. and A.T.M. are employees of Pfizer and hold stock/options.
Data availability statement
Upon request, and subject to review, Pfizer will provide the data that support the findings of this study. Subject to certain criteria, conditions and exceptions, Pfizer may also provide access to the related individual anonymised participant data. See https://www.pfizer.com/science/clinical-trials/trial-data-and-results for more information.
Additional information
Funding
References
- Liz MA, Mar FM, Franquinho F, et al. Aboard transthyretin: from transport to cleavage. IUBMB Life. 2010;62(6):429–435.
- Galant NJ, Westermark P, Higaki JN, et al. Transthyretin amyloidosis: an under-recognized neuropathy and cardiomyopathy. Clin Sci. 2017;131(5):395–409.
- Ruberg FL, Grogan M, Hanna M, et al. Transthyretin amyloid cardiomyopathy: JACC state-of-the-art review. J Am Coll Cardiol. 2019;73(22):2872–2891.
- Lane T, Fontana M, Martinez-Naharro A, et al. Natural history, quality of life, and outcome in cardiac transthyretin amyloidosis. Circulation 2019;140(1):16–26.
- Grogan M, Scott CG, Kyle RA, et al. Natural history of wild-type transthyretin cardiac amyloidosis and risk stratification using a novel staging system. J Am Coll Cardiol. 2016;68(10):1014–1020.
- Porcari A, Merlo M, Rapezzi C, et al. Transthyretin amyloid cardiomyopathy: an uncharted territory awaiting discovery. Eur J Intern Med. 2020;82:7–15.
- Johnson SM, Connelly S, Fearns C, et al. The transthyretin amyloidoses: from delineating the molecular mechanism of aggregation linked to pathology to a regulatory-agency-approved drug. J Mol Biol. 2012;421(2-3):185–203.
- Maurer MS, Schwartz JH, Gundapaneni B, ATTR-ACT Study Investigators, et al. Tafamidis treatment for patients with transthyretin amyloid cardiomyopathy. N Engl J Med. 2018;379(11):1007–1016.
- Maurer MS, Grogan DR, Judge DP, et al. Tafamidis in transthyretin amyloid cardiomyopathy: effects on transthyretin stabilization and clinical outcomes. Circ Heart Fail. 2015;8(3):519–526.
- Nelson LT, Paxman RJ, Xu J, et al. Blinded potency comparison of transthyretin kinetic stabilisers by subunit exchange in human plasma. Amyloid 2021;28(1):24–29.
- Bulawa CE, Connelly S, DeVit M, et al. Tafamidis, a potent and selective transthyretin kinetic stabilizer that inhibits the amyloid Cascade. Proc Natl Acad Sci USA 2012;109(24):9629–9634.
- Sekijima Y, Dendle MA, Kelly JW. Orally administered diflunisal stabilizes transthyretin against dissociation required for amyloidogenesis. Amyloid 2006;13(4):236–249.
- Rappley I, Monteiro C, Novais M, et al. Quantification of transthyretin kinetic stability in human plasma using subunit exchange. Biochemistry 2014;53(12):1993–2006.
- Kelly J, Powers E. Response. Amyloid 2021;28(2):140–141.
- Wiseman RL, Green NS, Kelly JW. Kinetic stabilization of an oligomeric protein under physiological conditions demonstrated by a lack of subunit exchange: implications for transthyretin amyloidosis. Biochemistry 2005;44(25):9265–9274.
- Petrassi HM, Klabunde T, Sacchettini J, et al. Structure-based design of N-phenyl phenoxazine transthyretin amyloid fibril inhibitors. J Am Chem Soc. 2000;122(10):2178–2192.
- Freiburger L, Auclair K, Mittermaier A. Global ITC fitting methods in studies of protein allostery. Methods 2015;76:149–161.
- Levitt DG, Levitt MD. Human serum albumin homeostasis: a new look at the roles of synthesis, catabolism, renal and gastrointestinal excretion, and the clinical value of serum albumin measurements. Int J Gen Med. 2016;9:229–255.
- Banker MJ, Clark TH, Williams JA. Development and validation of a 96-well equilibrium dialysis apparatus for measuring plasma protein binding. J Pharm Sci. 2003;92(5):967–974.
- Nilsen J, Trabjerg E, Grevys A, et al. An intact C-terminal end of albumin is required for its long half-life in humans. Commun Biol. 2020;3(1):181.
- Socolow EL, Woeber KA, Purdy RH, et al. Preparation of I-131-labeled human serum prealbumin and its metabolism in normal and sick patients. J Clin Invest. 1965;44(10):1600–1609.
- Huh Y, Riley S, Harnisch L, et al. Population pharmacokinetic modelling and simulation of tafamidis in healthy subjects and patients with transthyretin amyloidosis. Br J Clin Pharmacol. 2021;87(9):3574–3587.
- Di L, Breen C, Chambers R, et al. Industry perspective on contemporary protein-binding methodologies: considerations for regulatory drug-drug interaction and related guidelines on highly bound drugs. J Pharm Sci. 2017;106(12):3442–3452.
- Verona G, Mangione PP, Raimondi S, et al. Inhibition of the mechano-enzymatic amyloidogenesis of transthyretin: role of ligand affinity, binding cooperativity and occupancy of the inner channel. Sci Rep. 2017;7(1):182.