
ABSTRACT
Previous composite face studies have shown that an unattended face half that differs in identity or in expression from the attended face half distracts face perception. These studies have typically not controlled for the amount of information in different face halves. We investigated feature integration while participants discriminated angry and happy expressions. The stimuli were scaled using individual thresholds to control the expression strength in face halves. In the first experiment, we varied the relative amount of information in upper and lower parts. In the second experiment, participants tried to ignore one half of the face, which was either congruent or incongruent with the attended half. We found both beneficial and obligatory integration of face halves. A robust face composite effect was found both when attending eyes or mouth, and both for congruent and incongruent expressions, suggesting similar processing of face halves when the amount of information is controlled for.
Introduction
Faces contain several features or cues that can be used to recognize identities and expressions. Hence, one of the key questions in face perception has been how the upper and lower parts of faces are integrated. Studies using the composite-face task have shown that one face half affects the perception of the other half even when it is task-irrelevant (Murphy et al., Citation2017; Young et al., Citation1987). On the other hand, the presence of a whole-face template enhances recognition of a face part, although the whole-face template provides no additional information (Tanaka & Farah, Citation1993; Tanaka & Simonyi, Citation2016; but see also: Leder & Carbon, Citation2005; Logan et al., Citation2017). Thus, a face is perceived as a whole and the different face parts are integrated even when it is detrimental to task performance. This is often termed as holistic processing, although there is no widely-accepted definition for holisticity (Burton et al., Citation2015; Maurer et al., Citation2002; Richler et al., Citation2012). While the first studies using composite faces used identity combinations, similar effects have been found with expression combinations (Calvo & Fernández-Martín, Citation2013; Calvo et al., Citation2013; Tanaka et al., Citation2012). Since facial expressions are dynamic, features can change rapidly and the expressions can be subtle, efficient perceptual mechanisms are needed for identifying them. Indeed, composite face effect has been found to be very fast, happening in a single fixation and supporting emotional gist perception (Gregory et al., Citation2021). Some emotions, for example happiness, are more efficiently decoded from the bottom half, while the decoding of other emotions, for example anger, relies more on the top half (Calder et al., Citation2000; Calvo & Fernández-Martín, Citation2013; Calvo & Nummenmaa, Citation2008; Smith et al., Citation2005). However, the top and bottom halves of faces interact in many complex ways in the emotion recognition process, and these interactions may dynamically change (Chen & Cheung, Citation2021; Jack et al., Citation2014; Kilpeläinen & Salmela, Citation2020; Luo et al., Citation2010). It has been suggested that the early processing stages of expressions are more susceptible for confusions while later stages provide the diagnostic information (Jack et al., Citation2014). Many previous composite face studies have only analysed conditions where diagnostic features (e.g., happy mouth, angry eyes) are present, and left out conditions involving non-diagnostic features (e.g., happy eyes, angry mouth). While the role of diagnostic features is well established in face perception, it is not known whether information carried by the non-diagnostic features is also used. Several possibilities exist. For example, it could be that information from the non-diagnostic features is completely ignored, or that it is used, but given much less weight than the diagnostic information. To investigate this question, the face stimuli must be constructed in a way that both diagnostic and non-diagnostic features are equally informative.
Notably, most earlier composite face studies have used expressions with full intensity and have not systematically varied or controlled the information content (i.e., expression strength) of the facial features. However, even subtle expressions present in supposedly neutral faces have been shown to enhance the face composite effect in an identity task (Gray et al., Citation2017). Furthermore, one study using sophisticated methods to investigate the dynamic progress of expressions (Jack et al., Citation2014) showed that the basic emotions are not coded in a simple, categorical way; rather, the information content in face expressions varies in time in a complex manner depending on the emotion. These studies thus stress the importance of varying the face stimuli more meticulously. One possible method to investigate the integration of features is the cue integration paradigm, which has been used in many other sensory/perceptual tasks. The cue integration paradigm has been established as a framework for testing human performance in integration tasks. Studies using these methods have provided quantitative estimates of integration strength, as well as strong hypotheses about the underlying mechanisms (e.g., Ernst & Banks, Citation2002; Helbig & Ernst, Citation2007; Knill & Saunders, Citation2003; Landy et al., Citation1995; Young et al., Citation1993).
In this study, we apply the cue integration paradigm to study how humans integrate emotional expression information from the cues provided by the upper and lower face halves. Previously, a few studies have used cue integration methods to study perception of faces. Gold et al. (Citation2012, Citation2014; see also Dal Martello & Maloney, Citation2006) tested whether the whole face is more than the sum of its parts in identity recognition (Gold et al., Citation2012; Richler et al., Citation2012), and concluded that the performance for a whole face can be explained as a sum of the performance for the face parts (but see Shen and Palmeri, Citation2015). Two other studies have found beneficial integration in combining identity information of face shape and idiosyncratic movement (Dobs et al., Citation2017) and sub-optimal integration of top and bottom halves of a face in identity recognition (Hotaling et al., Citation2015). Using reverse correlation and Bayesian classifiers, Jack et al. (Citation2014) were able to separate the time courses of confusing and diagnostic face features for emotion discrimination.
Although some beneficial integration of face expressions has been reported (e.g., Gregory et al., Citation2021; Tanaka et al., Citation2012), it has not been tested directly by systematically varying the relative strength of the two cues (upper/lower part of the face). In addition, previous studies have not tested whether the differences between expressions are due to the differences in the amount of information instead of the expressions per se. For example, if happiness is more difficult to recognize from an incongruent composite face containing happy eyes and angry mouth than from a congruent face, it could be due to a lower amount of “happiness” information in incongruent (happy eyes only) than in congruent (happy eyes + happy mouth) face. The amount of overall information could be controlled for, for example, by comparing the incongruent (100% happy eyes) face with a congruent but less happy (50% happy eyes + 50% happy mouth) face.
The upper and lower part of the face could be integrated in different ways. First, optimal integration of cues (weighted average according to the cue reliability) predicts no effect for varying the amount of information in eyes and mouth (if the overall information is held constant). Secondly, simple averaging of the information from eyes and mouth predicts strong composite effects if the other cue is uninformative (e.g., neutral). Consistent with the cue-integration literature (e.g., Saarela & Landy, Citation2015), we refer to this sort of holistic processing here as obligatory integration. Thirdly, choosing the best cue predicts that only one cue affects performance and thus no composite face effect at all. A traditional face composite task, which uses full-intensity expressions, cannot distinguish between the three alternatives, and in full intensity faces the diagnostic region and the most informative region always overlaps. In real life, expressions are often subtle or some parts of the face can be hidden (e.g., with sunglasses or face masks), and the information distribution in different face parts might differ from that found in full-intensity expressions. We aimed to answer whether participants always use the “diagnostic region” in expression recognition regardless of how much it contains information, or whether face parts are utilized based on their information content.
We examined how observers integrate expressions from the top and bottom halves of a face when the amount of information (intensity of happy/angry expressions) in the eye and mouth areas is separately varied. Due to independent variation of the eyes and mouth regions, it was important to prevent biases in the placement of fixation (and the superior foveal spatial resolution). Thus, eye-movements to the eyes or the mouth were not allowed, and participants always fixated on the nose, approximately half-way between eyes and mouth. We used angry and happy expressions as they contain different diagnostic features and have been often used in face composite studies. In the cue integration experiment, we tested beneficial integration of the cues and varied the strength of expression in two face halves, and participants were instructed to use information in both face halves in the best possible way. In the cue selection experiment, we tested whether participants were able to selectively and covertly attend to one cue (upper or lower face half) and ignore the other cue, while the expressions in the face halves were either congruent or incongruent.
Cue integration experiment
Participants
Sixteen subjects (10 females, age 20–31 years) participated in the experiments. All participants had normal or corrected to normal vision, provided written informed consent, and received a study credit for participating in the experiments. The experiments were conducted according to the Declaration of Helsinki and approved by the Ethics Review Board in the Humanities and Social and Behavioural Sciences of the University of Helsinki.
We aimed for high accuracy (Lakens, Citation2021) and used small n design (Smith & Little, Citation2018) with extensive sampling (Naselaris et al., Citation2021), and therefore recruited relatively few participants (n = 16). Each participant practised the tasks and completed four sessions on different days (the gap between the sessions was 1–3 days). The total duration of measurements was 4–6 h/participant and the experiments consisted of ca. 3000 trials for each participant (48,000 trials in total were completed in two experiments).
Stimuli
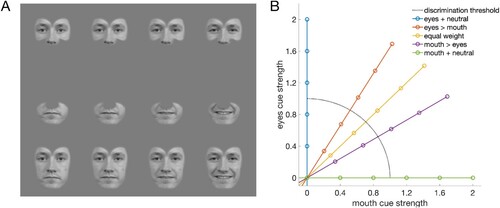
The stimuli were face images of 60 different identities (half female) from the Radboud (Langner et al., Citation2010) and FACES (Ebner et al., Citation2010) databases. The images were scaled to equal size, aligned spatially, and morphed with Fantamorph software from neutral to angry and from neutral to happy expressions with 1% steps, resulting in 12,000 images in total. The images were then converted to grey scale and the faces were cropped (i.e., hair and background was removed). Finally, each facial feature (left and right eye, nose, and mouth) was smoothly cropped (A). The images used in the experiments were reconstructed from the cropped features. As the images were spatially aligned and then smoothly cropped, a combination of different intensity/morph levels (e.g., 10% angry mouth with 60% angry eyes) in the same image did not produce any visible transitions and the images looked like original photographs (A, A). The height/width of the face was 12.5/8.5 degrees, and the root-mean-square contrast of the faces was 0.2.
Figure 1. Stimuli. (A) The regions around the eyes and mouth were independently manipulated. (B) Schematic stimulus space. The strength of expressions (angry/happy) in the eyes and mouth were systematically varied relative to the discrimination threshold measured with isolated cues (eyes/mouth). Each coloured line represents one combination of mouth and eyes in the cue integration task, with each dot representing one intensity level used while measuring psychometric functions for expression discrimination of whole faces.
The Psychtoolbox (Brainard, Citation1997) extension of Matlab controlled the stimulus presentation on a VIEWPixx display (VPixx Technologies Inc., Canada; 1200 × 1920 resolution, size: 22.5-inch, 19.1 × 30.1 degrees). The viewing distance was 90 cm, and it was held constant with a chin-rest. Participants’ eye movements were tracked (right eye) with an EyeLink 1000 tracker at 1000 Hz.
Procedure
In each trial, a face was shown in the middle of the display (with 0.25-degree random spatial jitter) and the participant’s task was to say whether the expression of the stimulus was angry or happy. Discrimination thresholds for facial expressions were measured with a method of constant stimuli. The following 11 different intensity (morph) levels were used: five angry, one neutral, and five happy expressions. Each intensity level was repeated at least 15 times. The intensity levels of the stimuli were individually set for each participant to scale the stimuli according to how much information the eyes and mouth contained. To this end, we measured the discrimination thresholds for isolated upper and lower face halves before the main experiments with identical experimental setup. The expression strength of isolated halves was varied from neutral (0%) to angry/happy with morph steps of 12%, 24%, 36%, 48%, and 72%. The sd of the fitted psychometric functions was used for scaling of the stimuli in the main experiments, from neutral to 2 sds in steps of 0.4 sds, and thus the morph/intensity levels in the main experiment were neutral and 0.4, 0.8, 1.2, 1.6, and 2.0 in units of sd (B).
Expression discrimination was measured in five different conditions, in which the relative strength of the expression in eyes and mouth was systematically varied (lines in B). In the baseline condition, both the mouth and eyes contained an equal amount of information (M = E; diagonal line in B). In the next two conditions, we decreased the relative information in eyes and increased the information in mouth (M > E; 30-degree line in B), and further decreased the strength of eyes to an uninformative neutral (M + N; 0-degree line in B). In the fourth and fifth conditions, we decreased the relative information in the mouth and increased the information in the eyes (E > M; 60-degree line in B) and further decreased the strength of mouth to neutral (E + N; 90-degree line in B). In these five conditions (0, 30, 45, 60, and 90 degrees), the intensity of the eyes was multiplied with 1.0, 0.866, 0.7071, 0.5, and 0.0, respectively, and the intensity of the mouth was multiplied with 0.0, 0.5, 0.7071, 0.866, and 1.0, respectively. For example, if the individual sd was 20% morph for eyes and 10% for mouth, then the actual stimulus presented in 30 deg condition 1.2 sd away from neutral was 21% eyes (1.2*20*0.866) combined with 6% mouth (1.2*10*0.5).
The stimulus duration was 500 ms, and the next trial started 250 ms after the response. Feedback (red exclamation mark) was provided after incorrect trials. The participants were instructed to fixate on a cross on the nose at equal distance from the eyes and mouth. If the fixation during the stimulus presentation was not within 1 degree from the fixation cross, the trial data was discarded, and the same trial was repeated at the end of the measurement. If the fixation failed again, the trials were excluded from the data analysis.
Additionally, we tested the effect of variability of identities in the stimulus set. For one half of the subjects, the variability of face identity was high (60 different identities were used). For the other half of the subjects, the variability of identity was low (16 different identities were used). The identity variability did not have any significant main effects for the sd (F(1,14) = 0.020, p = .89) or mean (F(1,14) = 1.498, p = .241) of the psychometric functions, and thus the data from both subject groups was combined.
Statistical analysis
In total, only 246 out of 27,830 trials (0.9%) were excluded from the data analyses due to failed fixation. The psychometric functions were fitted to the data as follows. The frequencies of happy and angry responses were calculated for different intensity levels (five angry, neutral and five happy expressions). A cumulative Gaussian function was then fitted to the data using the fit-function in Matlab by minimizing the sum of squared errors, separately for happy and angry faces. Each function was fitted with two free parameters (mean and standard deviation). The functions were set to vary from guess rate (0.5) to 1, with means and standard deviations (sd) restricted to vary between 0.1 and 6.4 in units of sd. The unit of sd refers to the standard deviation of the psychometric function for discrimination of isolated features, which was used to individually scale the stimulus intensities. The functions were fitted separately for each measured block of each condition (each subject measured at least two blocks in each condition). The differences in the means and standard deviations of psychometric functions were tested with repeated-measures ANOVA and Bayesian repeated-measures ANOVA.
Results
We tested whether the integration of face features is based on selecting the most informative cue, simply averaging the cues, or by calculating weighted average. To this end, we first measured psychometric functions in five conditions where the relative information was varied (). Then we compared the sds/slopes the functions to the predictions of the different types of integration ().
Figure 2. Psychometric functions for whole faces when the relative amount of information of eyes and mouth cues were varied, but overall information was kept constant. Separate functions were fitted for angry (purple) and happy (green) faces. An intensity of zero depicts a neutral face. (A) equal amount of information in mouth and eyes (M = E), (B) more information in eyes than mouth (E > M), (C) information only in eyes, neural mouth (E + N), (D), more information in mouth than in eyes (M > E), and (E) information only in mouth, neutral eyes (M + N).
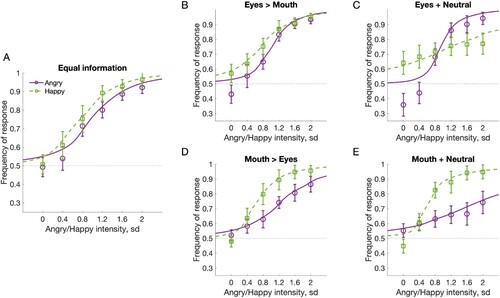
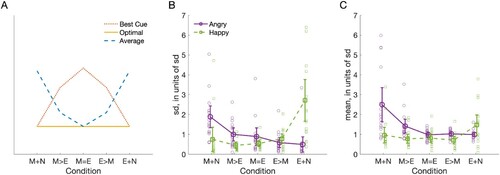
Figure 3. (A) Schematic prediction of different types of feature integration. These models assume that overall the cues (eyes & mouth) are equally informative for both emotions, and predictions are normalized across conditions. (B) Standard deviations and (C) means of the psychometric functions shown in . Purple indicates angry and green happy faces. Conditions: all expression information in mouth and neutral eyes (M + N) and vice versa (E + N); more information in mouth than eyes (M > E) and vice versa (E > M); equal information in eyes and mouth (M = E). Both individual data and average data are shown. Error bars depict 95% confidence intervals.
Two psychometric functions were fitted to each condition, one for the angry faces (, purple lines) and one for the happy faces (, green lines). A shows that when there was an equal amount of information in the eyes and mouth, the psychometric functions behaved as expected, ranging from 0.5 (guess rate) to 1 with relatively similar functions for happy and angry faces. Thus, subjects were able to accurately discriminate angry and happy expressions. However, when the information in eyes and mouth was differently weighted, the functions for happy and angry faces started to separate (B, C), although the same amount of expression information was always available. Specifically, when information from the mouth was completely eliminated (C), the discrimination performance for happy faces started to decrease. The same was observed for angry faces in the opposite condition, where information from eyes was reduced (D) and eliminated (E). The strengths of the cues were individually set based on discriminability of isolated mouths and eyes. Therefore, the strong flattening of psychometric functions in conditions containing a neutral cue was surprising and suggests that the neutral cue interfered with expression discrimination, i.e. the participants failed to ignore the uninformative cue or failed to rely only on the informative cue. Interestingly, the effect was only found for happy eyes and angry mouth, but not for angry eyes and happy mouth. In addition, a strong bias towards happy responses for neutral faces was found in eyes combined with neutral mouth (C), further suggesting that the neutral cue strongly interfered with participants’ performance.
To quantify the differences in psychometric functions, we compared the fitted standard deviations and means between the different conditions and facial expressions (). The standard deviations (B) showed opposite effects for angry and happy faces, with better performance for happy faces when information in the mouth was increased, and better performance for angry faces when information in the eyes was increased. Specifically for the sds, ANOVA with within-subject factors of expression (happy, angry) and information location (M + N, M > E, M = E, E > M, E + N) showed no main effect for expression (F(1,15) = 0.210, p = .653), a main effect for information location (F(1.566,23.492) = 8.409, p = .003, η2 = .36), and an interaction between the expression and location (F(1.776,26.644) = 16.188, p < .001, η2 = .52). Post-hoc tests showed higher sds for M + N than M > E (p = .013, all Bonferroni corrected), M = E (p = .036) and E > M (p = .005), and for E + N than M = E (p = .044) and E > M (p = .022) and no other significant differences. For means of the psychometric functions (C), the effects of expression (F(1,15) = 10.034, p = .006, η2 = .40), condition (F(1.543,23.147) = 5.326, p = .036, η2 = .22), and their interaction (F(2.659,39.890) = 2.932, p < .001, η2 = .33) were all significant. However, none of the pair-wise post-hoc tests was significant (all p > .05).
The discrimination performance was weakest in the conditions where all information was in one face half and the other half was uninformative neutral (M + N and E + N). While the overall performance did not differ between expressions, a significant interaction showed better performance for happy than angry faces when information was in the mouth, and vice versa when information was in the eyes. In these conditions, an informative cue was combined (A, average model) with an uninformative cue, showing disadvantageous integration of facial cues.
Furthermore, we tested whether the discrimination in the best single-cue condition (M + N or E + N) differed from discrimination in the equal information condition (M = E). If participants used only the best available cue in each condition and ignored the other cue, this would result in superior performance in the single-cue conditions since the cue strength is highest in the single cue condition (A, best cue). The best single cue was selected separately for each subject and expression, taking the condition (M + N or E + N) with better discrimination performance. We used Bayesian instead of frequentist repeated-measures ANOVA since we wanted to obtain evidence on the similarity of conditions in addition to the difference between the conditions. The null hypothesis (BF subscript 0) was that min (M + N, E + N) = (M = E). The alternative hypothesis (BF subscript 1) was that min (M + N, E + N) ∼ = (M = E). Bayesian repeated-measures ANOVA with factors of expression (happy, angry) and cue (best single cue, M = E) showed moderate evidence in favour of the null model against the expression (BF01 = 3850) and condition (BF01 = 3.712) models, and strong evidence in favour of the null model against the expression + condition (BF01 = 14.609) and expression + condition + interaction (BF01 = 34.717) models. The error percentages were < 2.5% suggesting good stability of obtained BFs. Thus, the Bayesian analysis supported the null hypothesis, indicating that similar discrimination thresholds were found in best single cue and equal cue conditions. This suggests that participants did not use only the best cue for expression discrimination.
Discussion
We tested integration of face halves by manipulating the relative information in the eyes and the mouth of angry and happy faces. Importantly, we kept the overall information of the whole face constant and individually scaled the information in eyes and mouth. When both eyes and mouth contained a similar amount of information, all participants were able to accurately discriminate angry and happy expressions. However, when the relative information between face halves was varied, an interaction of expression and cue location was found. Surprisingly, most participants almost completely failed in the discrimination task for happy eyes (+neutral mouth) and angry mouth (+neutral eyes).
There are several possible ways how observers could integrate (or not integrate) information from eyes and mouth (A). First, if the observers integrated the cues in an optimal fashion, they would weigh the cues according to how informative the cues were. For example, in the eyes/mouth + neutral condition, they would rely only on eyes/mouth and discard the information of the neutral half completely (A, optimal). This was clearly not the case in our data. Secondly, if the observers did not integrate the cues at all, the optimal strategy would be to always use the best available cue. This would result in best performance in the conditions where all information was in one cue (M + N and E + N), and weaker performance in the other conditions (e.g., M = E) where the information is divided between the two cues (A, best cue). Clearly, this was not the case either. In contrast, our results showed that the performance for the better cue (eyes for angry and mouth for happy for most subjects) was no better than performance when the information was divided between two cues, suggesting integration of the cues.
Overall, our data suggests either advantageous integration of information from two cues in the conditions where both cues are informative, or disadvantageous integration in the conditions where all information was in one cue and the other cue was neutral. Thus, none of the models (optimal, average, best cue) was able to explain all our results, suggesting that two different types of integration of features were used. One possibility is that observers were able to optimally combine information if the face contained diagnostic features – when the mouth was happy or the eyes were angry – but relied on equal weighing of cues in other conditions, e.g., when the mouth was angry or the eyes were happy.
Since the strong effect of the neutral cue suggests disadvantageous integration, we tested this in the next cue selection experiment. In particular, we investigated whether integration of cues is obligatory or whether observers can use attention to select only the informative cue.
Cue selection experiment
Participants and stimuli
All participants of the cue integration experiment also conducted the cue selection experiments. Face stimuli were similarly constructed as in the cue integration experiment.
Procedure
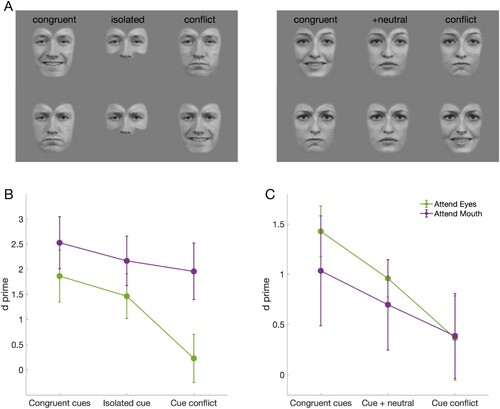
In the cue selection experiment, participants were instructed to keep gaze on fixation and covertly focus attention only on the expression in either the lower or upper half of a shown face and ignore the expression in the other half. Their task was to select whether the expression in the attended half was angry or happy. This discrimination performance was measured with composite faces in which the two face halves were either congruent or in conflict with each other. For the first half of the participants, a third condition with a missing unattended half was used as baseline condition. For the second half of the participants, baseline with a neutral unattended half was used instead. Thus, there were the following six different types of stimuli in total: angry attended half with angry (1), neutral/missing (2), or happy irrelevant half (3), and happy attended half with happy (4), neutral/missing (5), or angry irrelevant half (6), corresponding to congruent, baseline, and conflict conditions, respectively.
The two attention conditions (attend eyes/mouth) were measured in separate blocks. The expression strength of the cues were individually set, separately for eyes and mouth, and were 0.5 (for the first half of the participants) or 0.6 (for the second half) times the discrimination threshold (sd) of isolated cues. Each participant measured at least five blocks for both attend eyes and attend mouth tasks. Each block contained at least 96 trials.
Statistical analyses
In total, 1052 out of 20,286 trials (5.2%) were excluded from the data analyses due to failed fixations. A criterion-free discrimination index d’ was calculated by subtracting the z-score of false alarms (happy response to angry expression) from the z-score of hits (happy response to happy expression). The decision criterion c was calculated by taking a negative of the average of these z-scores. The false alarms and hits were calculated relative to the expression on the attended feature (eyes/mouth), irrespective of the expression in the unattended and irrelevant feature. The differences in the d’ indices were tested with repeated-measures ANOVA.
Results
We investigated whether we could use covert attention to select only relevant/attended facial features and suppress irrelevant/unattended features. Especially, we tested whether unattended congruent features improve and unattended incongruent features impair participants’ performance in comparison to baseline condition.
Attentional selection in feature integration was tested in a task where participants were instructed to attend only to one face half, while the unattended, task-irrelevant face half provided either conflicting, neutral/missing, or congruent information. shows that performance was best in the congruent condition, poorest in the incongruent condition, and in between in the baseline condition. This was true whether the baseline had a missing (B) or a neutral unattended half (C). Specifically, a 3 × 2 ANOVA for the missing half baseline group showed a significant main effect for condition (congruent, baseline, conflict; F(1.417, 9.920) = 26.134, p < .001, η2 = .79, all Greenhouse-Geisser corrected), significant effect for attention location (eyes, mouth; F(1,7) = 14.687, p = .006, η2 = .68), and a significant interaction between the two (F(1.307,9.147) = 6.830, p = .022, η2 = .49). Post-hoc comparisons showed that all three conditions differed from each other; d’ values were higher in the congruent than in the baseline (p = .03, all Bonferroni-corrected) or the conflict (p = .002) condition, and higher in the baseline than in the conflict condition (p = .006). When the baseline had a neutral unattended half instead of a missing half, condition had a significant main effect (F(1.064, 7.446) = 20.945, p = .002, η2 = .75), while attention location (F(1,7) = 0.536, p = .45) or their interaction (F(1.274,8.915) = 1.632, p = .24) had no effect. Importantly, post-hoc tests showed again that performance was better in congruent than in baseline (p = .009) or in conflict (p = .007) conditions, and better in baseline than in conflict condition (p = .009). Thus, in every condition, a congruent cue improved and an incongruent cue decreased the discrimination performance, suggesting obligatory integration of facial cues in expression discrimination.
Figure 4. Stimuli and results of cue selection experiments. (A) examples of congruent, baseline, and conflict stimuli. Discriminability of expression measured when attending to the first cue and the second cue was (B) isolated, congruent, or in conflict with the first cue. (C) neutral, congruent, or in conflict with the first cue.
In the first experiment, we found quite a strong response bias in eye + neutral conditions (C). The d’ discriminability index is a relatively bias free measure, but the bias can be estimated from the decision criterion. When attention was towards the mouth, the criterion did not differ from zero in congruent (c = -0.087, t(15) = −1.34, p = .200), neutral/isolated (c = 0.089, t(15) = 1.64, p = .122), or incongruent conditions (c = −0.083, t(15) = −1.35, p = .196). When attention was towards the eyes, the criterion differed from zero, but the bias towards “happy” response was similar in congruent (c = −0.21, t(15) = −2.83, p = .013), neutral/isolated (c = −0.19,t(15) = −2.46, p = .026) and incongruent (c = −0.26, t(15) = −4.59, p < .001) conditions.
Discussion
We tested obligatory integration of face halves in a composite face task where participants tried to discriminate the expression in one face half while ignoring the other. We found robust evidence for obligatory integration, namely, the participants were unable to ignore the task-irrelevant face half. The congruent task-irrelevant half improved, and the conflicting, incongruent half weakened performance compared to a baseline with a neutral or missing task-irrelevant half.
General discussion
We studied how information in facial expressions is integrated from the top and bottom halves of a face. We used novel stimuli where the emotional expression strength in the top and bottom halves were separately scaled relative to their discrimination thresholds. This allowed us to study whether the dominance of mouth in the perception of happy expression and the dominance of eyes in the perception of angry expressions is due to a diagnostic role of that feature, or whether it occurs simply because the threshold for identifying a particular expression is different for the mouth and the eyes in happy and angry expressions. In traditional face composite studies, the eyes and mouth are taken from the same image, and therefore the eyes are more critical/diagnostic for anger and mouth for happiness. We varied the strength of expression in the eye and mouth regions independently in our stimuli, which allowed us to provide a quantitative estimate of integration strength. We found that neither feature diagnosticity nor information strength alone can explain cue integration in emotional expression perception under all conditions, but both play a role. Our results showed robust obligatory and some beneficial integration of the face halves and suggest that our perceptual system combines different parts of a face when evaluating expressions, and this integration cannot be ignored even when it is a disadvantage for the task.
While more recent studies have shown that subtle expressions affect the composite effect in identities (Gray et al., Citation2017) and that the information content in expressive faces varies in a complex way in time (Jack et al., Citation2014), most previous composite face studies have used expressions with full intensity. These studies have shown that the task-irrelevant face half affects the perception of the other half, both for identities (Murphy et al., Citation2017; Young et al., Citation1987) and for expressions (Calvo & Fernández-Martín, Citation2013; Calvo et al., Citation2013; Tanaka et al., Citation2012), and that some expressions are easier to recognize from the top and some from the bottom half (Calder et al., Citation2000; Smith et al., Citation2005). When the upper and lower parts contain different expressions, the results vary. For example, some studies have revealed a congruency advantage for happy but not for angry or sad faces when attending eyes (Calvo & Fernández-Martín, Citation2013) and others have found no differences in recognition accuracy between congruent and neutral expressions, but a lower accuracy for incongruent expressions (Tanaka et al., Citation2012). This led Tanaka et al. (Citation2012) to argue that incongruent expressions are processed holistically, but congruent expressions are not, since they contain information mainly in one half. Another explanation for this difference could be a ceiling effect caused by a full-strength expression in the diagnostic face half. Our results show that when the amount of information in the face halves is controlled for, much of the difference disappears. We found that recognition was always weakened for incongruent faces and enhanced when the halves were congruent, irrespective of attention location (see ). This suggests that when the use of facial cues is limited, for example due to a face mask or sunglasses, the recognition of expression is impaired even if the diagnostic features were clearly visible.
In addition to detrimental obligatory integration, integration of cues is often beneficial. While beneficial or optimal integration has been studied rigorously in various perceptual tasks (Ernst & Banks, Citation2002; Helbig & Ernst, Citation2007; Knill & Saunders, Citation2003; Landy et al., Citation1995; Saarela & Landy, Citation2015) and in a few studies for facial identities (Dobs et al., Citation2017; Gold et al., Citation2014, Citation2012; Hotaling et al., Citation2015; Logan et al., Citation2019; Shen & Palmeri, Citation2015), no studies have tested optimal integration for facial expressions (but see Jack et al., Citation2014). We found some evidence of beneficial integration. Specifically, the performance was best when information was divided between the face halves and better than would be expected if observers had relied only on the best available cue. Overall, none of the three models (optimal, best cue, averaging) of integration could explain all our results. Instead, our results suggest different type of integration, partly depending on whether the faces contain diagnostic features or not.
Since we manipulated the relative information in eyes and mouth, controlling the eye movements was critical, and we used tasks involving covert attention. In previous composite face studies, both overt (e.g., Calvo & Fernández-Martín, Citation2013) and covert (e.g., Tanaka et al., 2012) attention tasks have been used. The covert attention task – fixation at nose – might have affected the task performance simply due to the peripheral stimulus presentation (lower spatial acuity) or unnatural nature of the task (eyes/mouth capture attention more efficiently than nose). Especially in our second experiment, allowing overt attention might have reduced the effect of incongruent unattended features. However, it would probably have reduced the effect of congruent unattended features also. Thus, as we wanted to study how composite faces both improve and impair recognition performance, a task involving covert attention was better suited.
Our study has some limitations. In the data, the performance for angry faces was better when more information was in the eyes than in the mouth, and vice versa for happy faces (). However, although we used stimuli scaled to individual discrimination thresholds, the scaling was done separately only for eyes and mouth but not separately for angry and happy faces. Thus, the difference between the expressions could result from differences in the stimuli strengths and not differences in perception. Since the discriminability of expressions is rapid (Gregory et al., Citation2021) and can change over time (Jack et al., Citation2014), it would be important to extend the cue integration methods to dynamic faces in the future studies. We used several identities (60 or 16 for different subjects) but did not measure separate discrimination thresholds for each identity. However, while this adds noise to the measurements, the amount of identities (60 or 16) did not affect the results. Furthermore, our scaling was based on linear morphing steps, which provide an objective scale for the expression strength. However, subjective perception of expression strengths might not be linear (Gray et al., Citation2020).
In conclusion, we showed that the two face halves are integrated in an obligatory fashion, and this integration can be beneficial or detrimental depending on the task. We expanded the results of classic face-composite studies by using stimuli scaled to the individual discrimination thresholds and more precisely varying the relative information in upper and lower parts of the face. This allowed us to show that some of the discrepancies between attention locations and stimuli congruency, as found in previous studies, disappear when the information amount in the different halves is controlled for. We found no evidence for observers always using the most informative cue. Instead, our results suggest that different face parts are always integrated, regardless of attention focus (mouth or eyes) or congruency of expression (congruent or incongruent). Sometimes this integration of features is beneficial and sometimes it is detrimental.
Acknowledgements
The study was funded by Academy of Finland (grant number 298329).
Disclosure statement
No potential conflict of interest was reported by the author(s).
Additional information
Funding
References
- Brainard, D. H. (1997). The psychophysics toolbox. Spatial Vision, 10(4), 433–436. https://doi.org/https://doi.org/10.1163/156856897X00357
- Burton, A. M., Schweinberger, S. R., Jenkins, R., & Kaufmann, J. M. (2015). Arguments against a configural processing account of familiar face recognition. Perspectives on Psychological Science, 10(4), 482–496. https://doi.org/https://doi.org/10.1177/1745691615583129
- Calder, A. J., Keane, J., Young, A. W., & Dean, M. (2000). Configural information in facial expression perception. Journal of Experimental Psychology: Human Perception and Performance, 26(2), 527–551. https://doi.org/https://doi.org/10.1037/0096-1523.26.2.527
- Calvo, M. G., & Fernández-Martín, A. (2013). Can the eyes reveal a person’s emotions? Biasing role of the mouth expression. Motivation and Emotion, 37(1), 202–211. https://doi.org/https://doi.org/10.1007/s11031-012-9298-1
- Calvo, M. G., Fernández-Martín, A., & Nummenmaa, L. (2013). A smile biases the recognition of eye expressions: Configural projection from a salient mouth. Quarterly Journal of Experimental Psychology, 66(6), 1159–1181. https://doi.org/https://doi.org/10.1080/17470218.2012.732586
- Calvo, M. G., & Nummenmaa, L. (2008). Detection of emotional faces: Salient physical features guide effective visual search. Journal of Experimental Psychology: General, 137(3), 471–494. https://doi.org/https://doi.org/10.1037/a0012771
- Chen, W., & Cheung, O. S. (2021). Flexible face processing: Holistic processing of facial identity is modulated by task-irrelevant facial expression. Vision Research, 178, 18–27. https://doi.org/https://doi.org/10.1016/j.visres.2020.09.008
- Dal Martello, M. F., & Maloney, L. T. (2006). Where are kin recognition signals in the human face? Journal of Vision, 6(12), 2. https://doi.org/https://doi.org/10.1167/6.12.2
- Dobs, K., Ma, W. J., & Reddy, L. (2017). Near-optimal integration of facial form and motion. Scientific Reports, 7(1), 1–9. https://doi.org/https://doi.org/10.1038/s41598-017-10885-y
- Ebner, N. C., Riediger, M., & Lindenberger, U. (2010). FACES - A database of facial expressions in young, middle-aged, and older women and men: Development and validation. Behavior Research Methods, 42(1), 351–362. https://doi.org/https://doi.org/10.3758/BRM.42.1.351
- Ernst, M. O., & Banks, M. S. (2002). Humans integrate visual and haptic information in a statistically optimal fashion. Nature, 415(January), 429–433. https://doi.org/https://doi.org/10.1038/415429a
- Gold, J. M., Barker, J. D., Barr, S., Bittner, J. L., Bratch, A., Bromfield, W. D., … , Srinath, A. (2014). The perception of a familiar face is no more than the sum of its parts. Psychonomic Bulletin and Review, 21(6), 1465–1472. https://doi.org/https://doi.org/10.3758/s13423-014-0632-3
- Gold, J. M., Mundy, P. J., & Tjan, B. S. (2012). The perception of a face is no more than the sum of its parts. Psychological Science, 23(4), 427–434. https://doi.org/https://doi.org/10.1177/0956797611427407
- Gray, K. L. H., Flack, T. R., Yu, M., Lygo, F. A., & Baker, D. H. (2020). Nonlinear transduction of emotional facial expression. Vision Research, 170(July 2019), 1–11. https://doi.org/https://doi.org/10.1016/j.visres.2020.03.004
- Gray, K. L. H., Murphy, J., Marsh, J. E., & Cook, R. (2017). Modulation of the composite face effect by unintended emotion cues. Royal Society Open Science, 4(4), 160867. https://doi.org/https://doi.org/10.1098/rsos.160867
- Gregory, E., Tanaka, J. W., & Liu, X. (2021). Emotional gist: The rapid perception of facial expressions. Cognition and Emotion, 35(2), 385–392. https://doi.org/https://doi.org/10.1080/02699931.2020.1823322
- Helbig, H. B., & Ernst, M. O. (2007). Optimal integration of shape information from vision and touch. Experimental Brain Research, 179(4), 595–606. https://doi.org/https://doi.org/10.1007/s00221-006-0814-y
- Hotaling, J. M., Cohen, A. L., Shiffrin, R. M., & Busemeyer, J. R. (2015). The dilution effect and information integration in perceptual decision making. PLoS ONE, 10(9), e0138481. https://doi.org/https://doi.org/10.1371/journal.pone.0138481
- Jack, R. E., Garrod, O. G. B., & Schyns, P. G. (2014). Dynamic facial expressions of emotion transmit an evolving hierarchy of signals over time. Current Biology, 24(2), 187–192. https://doi.org/https://doi.org/10.1016/j.cub.2013.11.064
- Kilpeläinen, M., & Salmela, V. (2020). Perceived emotional expressions of composite faces. PLoS One, 15(3), e0230039. https://doi.org/https://doi.org/10.1371/journal.pone.0230039
- Knill, D. C., & Saunders, J. A. (2003). Do humans optimally integrate stereo and texture information for judgments of surface slant? Vision Research, 43(24), 2539–2558. https://doi.org/https://doi.org/10.1016/S0042-6989(03)00458-9
- Lakens, D. (2021). Sample size justification. Collabra: Psychology.
- Landy, M. S., Maloney, L. T., Johnston, E. B., & Young, M. (1995). Measurement and modeling of depth cue combination: In defense of weak fusion. Vision Research, 35(3), 389–412. https://doi.org/https://doi.org/10.1016/0042-6989(94)00176-M
- Langner, O., Dotsch, R., Bijlstra, G., Wigboldus, D. H. J., Hawk, S. T., & van Knippenberg, A. (2010). Presentation and validation of the radboud faces database. Cognition and Emotion, 24(8), 1377–1388. https://doi.org/https://doi.org/10.1080/02699930903485076
- Leder, H., & Carbon, C. C. (2005). When context hinders! learn-test compatibility in face recognition. Quarterly Journal of Experimental Psychology Section A: Human Experimental Psychology, 58(2), 235–250. https://doi.org/https://doi.org/10.1080/02724980343000936
- Logan, A. J., Gordon, G. E., & Loffler, G. (2017). Contributions of individual face features to face discrimination. Vision Research, 137, 29–39. https://doi.org/https://doi.org/10.1016/J.VISRES.2017.05.011
- Logan, A. J., Gordon, G. E., & Loffler, G. (2019). From individual features to full faces : Combining aspects of face information. Journal of Vision, 19(4), 23. https://doi.org/https://doi.org/10.1167/19.4.23
- Luo, W., Feng, W., He, W., Wang, N.-Y., & Luo, Y.-J. (2010). Three stages of facial expression processing: ERP study with rapid serial visual presentation. NeuroImage, 49(2), 1857–1867. https://doi.org/https://doi.org/10.1016/j.neuroimage.2009.09.018
- Maurer, D., Le Grand, R., & Mondloch, C. J. (2002). The many faces of configural processing. Trends in Cognitive Sciences, 6(6), 255–260. https://doi.org/https://doi.org/10.1016/s1364-6613(02)01903-4
- Murphy, J., Gray, K. L. H., & Cook, R. (2017). The composite face illusion. Psychonomic Bulletin and Review, 24(2), 245–261. https://doi.org/https://doi.org/10.3758/s13423-016-1131-5
- Naselaris, T., Allen, E., & Kay, K. (2021). Extensive sampling for complete models of individual brains. Current Opinion in Behavioral Sciences, 40, 45–51. https://doi.org/https://doi.org/10.1016/j.cobeha.2020.12.008
- Richler, J. J., Palmeri, T. J., & Gauthier, I. (2012). Meanings, mechanisms, and measures of holistic processing. Frontiers in Psychology, 3(DEC), 1–6. https://doi.org/https://doi.org/10.3389/fpsyg.2012.00553
- Saarela, T. P., & Landy, M. S. (2015). Integration trumps selection in object recognition. Current Biology, 25(7), 920–927. https://doi.org/https://doi.org/10.1016/j.cub.2015.01.068
- Shen, J., & Palmeri, T. J. (2015). The perception of a face can be greater than the sum of its parts. Psychonomic Bulletin & Review, 22(3), 710–716. https://doi.org/https://doi.org/10.3758/s13423-014-0726-y
- Smith, M. L., Gosselin, F., Cottrell, G. W., & Schyns, P. G. (2005). Transmitting and decoding facial expressions of emotion. Psychological Science, 16(3), 184–189. https://doi.org/https://doi.org/10.1111/j.0956-7976.2005.00801.x
- Smith, P. L., & Little, D. R. (2018). Small is beautiful: In defense of the small-N design. Psychonomic Bulletin and Review, 25(6), 2083–2101. https://doi.org/https://doi.org/10.3758/s13423-018-1451-8
- Tanaka, J. W., & Farah, M. J. (1993). Parts and wholes in face recognition. The Quarterly Journal of Experimental Psychology, 46(2), 225–245. https://doi.org/https://doi.org/10.1080/14640749308401045
- Tanaka, J. W., Kaiser, M. D., Butler, S., & Le Grand, R. (2012). Mixed emotions: Holistic and analytic perception of facial expressions. Cognition and Emotion, 26(6), 961–977. https://doi.org/https://doi.org/10.1080/02699931.2011.630933
- Tanaka, J. W., & Simonyi, D. (2016). The “parts and wholes” of face recognition: A review of the literature. Quarterly Journal of Experimental Psychology, 69(10), 1876–1889. https://doi.org/https://doi.org/10.1080/17470218.2016.1146780
- Young, A. W., Hellawell, D., & Hay, D. C. (1987). Configurational information in face perception. Perception, 16(6), 747–759. https://doi.org/https://doi.org/10.1068/p160747
- Young, M. J., Landy, M. S., & Maloney, L. T. (1993). A perturbation analysis of depth perception from combinations of texture and motion cues. Vision Research, 33(18), 2685–2696. https://doi.org/https://doi.org/10.1016/0042-6989(93)90228-O