
ABSTRACT
Rapid extraction of temporal and spatial patterns from repeated experience is known as statistical learning (SL). Studies on SL show that after few minutes of exposure, observers exhibit knowledge of regularities hidden in a sequence or array of objects. Previous findings suggest that visuo-spatial statistical learning might relate to numerical processing mechanisms. Hence, the current study examines for the first time visuo-spatial SL in a population with a deficiency in the numerical system: individuals with mathematical learning difficulties (MLD). Thirty-two female participants (16 with MLD and 16 matched controls) were tested on a visuo-spatial statistical learning task. The results revealed that visuo-spatial SL was significantly worse in the MLD group than in a control group, although MLD performed as well as controls in a visual discrimination task. In addition, whereas the control group showed reliable visuo-spatial SL above chance, the MLD group did not. Because learned regularities can broadly facilitate cognitive processing, individuals with MLD may thus suffer from additional behavioural challenges beyond their numerical difficulties.
Introduction
Humans have lived in very similar natural environments throughout evolutionary history. Because of this stability, sensory systems in the brain have adapted to the kinds of input that are most likely to appear (statistical regularities). For example, the receptive field properties of the primary visual cortex can be regenerated from scratch by decomposing a set of natural images into sparse independent components (Olshausen & Field, Citation1996). Analogously, we repeatedly encounter particular natural and artificial environments during our lifetime, and each of these environments has its own idiosyncratic regularities. For example, when moving to a new town, the sequence of landmarks encountered when navigating to the office is likely different than before. Although extensive experience is required for some types of perceptual learning (Gilbert et al., Citation2001; Watanabe et al., Citation2001), temporal sequences and spatial configurations of objects in our environments can be learned surprisingly quickly.
This rapid extraction of temporal and spatial patterns from repeated experience is known as statistical learning (SL; e.g., Saffran et al., Citation1996; Turk-Browne et al., Citation2009). In studies of visuo-spatial SL, observers are presented with a sequence or array of objects that, unbeknownst to them, contains hidden regularities in terms of which objects appear nearby in time or space, respectively. Critically, the only clue that objects are related comes from the statistical co-occurrence of objects over repeated experiences. In other words, at any single point in the sequence or location in the array, an object could appear next to several other objects; but across extended sequences and multiple arrays, it is more likely to appear with one or more specific other shapes. After a few minutes of exposure, observers exhibit knowledge of these regularities in familiarity, response time, and brain imaging measures.
Research suggests that SL is ubiquitous: it operates in multiple modalities and dimensions (Conway & Christiansen, Citation2006; Turk-Browne & Scholl, Citation2009); over many features such as shape (e.g., Fiser & Aslin, Citation2001), spatial location (e.g., Chun & Jiang, Citation1998), colour (e.g., Turk-Browne et al., Citation2008), and action (e.g., Baldwin et al., Citation2008); throughout development from infants (Kirkham et al., Citation2002) to the elderly (Campbell et al., Citation2010); and even in non-human species (e.g., Toro & Trobalón, Citation2005). In addition, SL operates both within and between objects (Turk-Browne et al., Citation2008), transfers flexibly between space and time (Turk-Browne & Scholl, Citation2009), occurs rapidly after a handful of repetitions (Turk-Browne et al., Citation2009), and facilitates perception by allowing us to anticipate the future (Turk-Browne et al., Citation2010). Moreover, SL is more robust for attended input but proceeds automatically, without intent or conscious awareness of regularities (Turk-Browne et al., Citation2005; Campbell et al., Citation2010; Emberson et al., Citation2011; Musz et al., Citation2015). That is, selective attention to individual stimuli allows for SL between stimuli, as was found in measures of both accuracy and speed. However, after the attention system is selectively directed to task-relevant stimuli, SL itself occurs without intent or conscious awareness. For example, during working memory or other cover tasks over a stream of shapes, observers incidentally learn regularities embedded in the stream that are irrelevant to the task, and report no awareness or knowledge of the regularities (Turk-Browne et al., Citation2005, Citation2009).
SL is related to other cognitive processes. For example, visuo-spatial SL interacts with statistical summary perception (SSP) – our ability to immediately perceive summary properties (e.g., average size) from a set of objects (Ariely, Citation2001; Chong & Treisman, Citation2005; Alvarez & Oliva, Citation2008). Visuo-spatial SL and SSP have been shown to mutually interfere with each other. In a task that examined visuo-spatial SL between oriented lines, estimating the mean orientation of the lines (a form of SSP) impaired learning of the regularities. This pattern of results did not result merely from the fact that SSP was a dual task, as was shown by stronger SL during another dual task that did not involve SSP. Moreover, engaging (unknowingly) in SL impaired SSP compared to a condition in which participants were conducting SSP after already being exposed to the regularities in advance (thus eliminating the need for concurrent SL) (Zhao et al., Citation2011). These findings suggest that visuo-spatial SL and SSP rely upon similar statistical computations, which cannot be used simultaneously by both processes.
Beyond summary statistics about the features of objects, visuo-spatial SL also interacts with the extraction of other set properties, such as numerosity. Estimates of the number of coloured circles in an array were reliably worse when the array contained pairs of colours that repeated across arrays (allowing for SL) compared to arrays with no colour regularities (preventing SL); moreover, such numerosity estimation impaired SL of the colour pairs, relative to other control tasks (Zhao & Yu, Citation2016). Thus, as with visuo-spatial SL and SSP, visuo-spatial SL and numerosity estimation also interfere with one another, suggesting that they may also rely on a shared mechanism. Neuroimaging findings are consistent with this interpretation. Namely, the intraparietal sulcus (IPS) is specialized for processing numbers and quantities (e.g., Dehaene et al., Citation2003; Piazza et al., Citation2004; Piazza et al., Citation2007) and nearby Brodmann area 40 is more strongly activated by streams of shapes with vs. without regularities (Turk-Browne et al., Citation2009). Moreover, IPS activity in response to an object that predicts what will come next in a sequence as a result of SL correlates with the magnitude of behavioural priming for the next object (Turk-Browne et al., Citation2010).
In sum, both behavioural and neuroimaging findings point to a relationship between visuo-spatial SL and numerical processing. This raises interesting questions about how visuo-spatial SL is affected by impairments in numerical processing, for example, as a result of mathematical learning difficulties (MLD).
Individuals with MLD are characterized as having mathematical skills far below those predicted based on their age, intelligence, and education (e.g., Butterworth et al., Citation2011). They can have difficulties in simple counting tasks (Geary et al., Citation2009), deficiencies in processing numerical quantities and magnitudes, failures in number identification, and have trouble associating magnitudes with symbols (for an extensive review, see Rubinsten & Henik, Citation2009).
The estimated prevalence of MLD is about 3–6% of school-age children (similar to the prevalence of dyslexia and ADHD), and in many cases the numerical difficulties associated with MLD persist into adulthood (e.g., Shalev et al., Citation2000; Shalev et al., Citation2005). Difficulties in the arithmetic domain affect the performance of the individual at school as well as in everyday life (Butterworth, Citation2009). Fairly simple tasks such as calculating change in a grocery store, can be difficult and confusing for people with MLD even in adulthood. MLD has been chracterized extensively in prior work (e.g., Price & Ansari, Citation2013), including evidence that dysfunction of IPS may be partly responsible (Cohen-Kadosh et al., Citation2007; Price et al., Citation2007).
The goal of the current study is to examine visuo-spatial SL in a population with MLD. As described, visuo-spatial SL and numerosity estimation were found to interfere with one another, suggesting a shared mechanism for these two cognitive processes (Zhao & Yu, Citation2016). Other studies also point to the role of SL in relation to processing quantities and numerosities in our surroundings (Walsh, Citation2003; Rinaldi & Girelli, Citation2017). Despite these findings, visuo-spatial SL has never before been studied in a population with difficulties in numerical processing. Our hypothesis is that because numerical processes and visuo-spatial SL might rely on the same underlying computations, and MLD results from a deficit in these computations, individuals with MLD might show weaker visuo-spatial SL than a matched control group with no learning difficulties.
Method
Participants
Sixteen females with MLD and a matched control group of 16 female adults with no learning difficulties or attention disorders aged 20–35 participated in the experiment. This sample size per group is comparable to prior SL studies (Turk-Browne et al., Citation2008; Zhao et al., Citation2011), and to a study on SL and dyslexia (Gabay et al., Citation2015). It is also bigger than necessary taking into account the effect size of Cohen's d of 1.39 found in Zhao et al. (Citation2011) in the control condition, which is similar to the demands of the task in this study. Based on statistical power calculations in G-power software (Faul et al., Citation2007), for one sample t-test with alpha of 0.05, power of 0.80 and effect size of 1.39 (based on Zhao et al., Citation2011) the total sample size needed is 5 participants. Hence, the sample size of 16 participants in each group is sufficient for this study. None of the participants were colour-blind. All participants provided written informed consent and were paid for their participation (approximately $16–22, according to the actual time they spent in the experiment room). The Ethical Committee of Haifa University approved all the study procedures.
Classification and assessment
Classification of the MLD group was performed using computerized numerical tests from the “Israeli learning function diagnosis system” (MATAL, Citation2007) for high school and higher education students. This system was developed by the National Institute for Testing and Evaluation, and it contains a large set of nationally normalized tests that is used to diagnose learning difficulties, including MLD, among high school and higher education students. In this study participants from the MLD group underwent two numerical tests, which included simple calculation tasks (e.g., 2 + 2 = 4, 2*2 = 5, 8-4 = 4, 6:4 = 2) and procedural knowledge calculation tasks (e.g., 750 + 10 = 760, 204-5 = 201, 20*20 = 400, 400:5 = 45). In both tasks the participants were asked to report whether the equation appearing on the screen was correct. Each of the tasks produced two measures: reaction time and accuracy. To be included in the MLD group, the average of all four measures had to be below the 20th percentile (none of the individual measures was above the 33rd percentile). This cut-off was chosen according to previous studies that used the numerical tests from the MATAL for classifying mathematical difficulties (Rubinsten et al., Citation2020). As mentioned, the MATAL is a nationally normalized test that is used to diagnose MLD, among high school and higher education students. The current cut off reflects below the norm performance in diagnosing mathematical difficulties in Israel. Inclusion in the MLD group did not require other prior diagnoses. In addition, participants in the MLD group completed a short interview by a learning disability diagnostician in which they were asked about their developmental history regarding academic abilities and attention prior to the experiment. All described significant difficulties solely in the arithmetic field, from the early years of elementary school through high school and until the current time.
All participants underwent a series of tests to assess abilities including: reading, non-verbal reasoning, retrieval, attention, and basic arithmetic. These tests were chosen to ensure that both groups would differ only in their numerical abilities and not in other relevant cognitive aspects. Therefore, the tests were used for between-group comparisons (and not as inclusion/exclusion criteria). Assessment of reading abilities was conducted using the One-minute test for words (Shatil, Citation1997a), in which participants were asked to read aloud as many correct words as possible in one minute, and the One-minute test for pseudo-words (Shatil, Citation1997b), in which the participants were asked to read aloud as many correct pseudo-words as possible in one minute. Non-verbal reasoning was assessed using the Raven Progressive Matrices (Raven, Citation1960). Retrieval abilities were assessed using the following tests by Kave (Citation2006): the semantic fluency test, in which participants were asked to say as many words as possible in a specific category in one minute, and the phonological fluency test, in which participants were asked to say as many words as possible that begin with a specific letter in one minute. For basic arithmetic abilities participants underwent a 2-minute calculation test that consists of one-digit exercises in addition, subtraction, multiplication, and division (Openhaim–Biton & Breznitz, Citation2004). The participants were asked to solve correctly as many exercises as possible in two minutes. Assessment of attention was performed through an attention questionnaire based on the Diagnostic and Statistical Manual of Mental Disorders (DSM-V) (American Psychiatric Association, Citation2013). The use of a rating scale for attention measurement (as opposed to a performance-based measure) was chosen because it is based on the questionnaire used for diagnoses of ADHD.
The order of the tests was counterbalanced between participants with the following exceptions. In the reading tests, the One-minute test for pseudo-words always followed the One-minute test for words, in the retrieval tests the phonological fluency test always followed the semantic fluency test, and the attention questionnaire was always last (to avoid a priming effect).
Apparatus
An HP Compaq computer was used to present stimuli and to collect the data. The experiment was presented using Matlab (Mathworks, Natick, MA) and the Psychophysics Toolbox (Brainard, Citation1997; Pelli, Citation1997). Stimuli were presented on a 22-inch Samsung monitor, while participants sat at a distance of about 60 cm from the screen. A keyboard on which participants conveyed their answer was placed on a table next to the screen.
Statistical learning task
The visuo-spatial SL task was adapted form Zhao and Yu (Citation2016). Circular disks subtending 1.4° of visual angle appeared in one of ten colours (colour name and R/G/B values: red, 255/0/0; green, 0/255/0; blue, 0/0/255; yellow, 255/255/0; magenta, 255/0/255; cyan, 0/255/255; gray, 185/185/185; orange, 255/140/0; brown, 103/29/0; black, 0/0/0). The circles were presented on a white screen (255/255/255). Of the ten coloured circles, eight were randomly selected at the beginning of each experiment to create four pairs, which were grouped together into a fixed horizontal, vertical, and diagonal structure. These combinations varied across participants. The remaining two colours were not paired ((a)).
Figure 1. (A) Examples of the coloured pairs. (B) An example of trial sequence of the exposure phase and the corresponding correct responses. Participants were asked to report whether there were two circles of identical colour in the display. (C) An example of trial sequence of the test phase and the corresponding correct responses. Participants were asked to report which of two pairs (correct and foil) was more familiar.
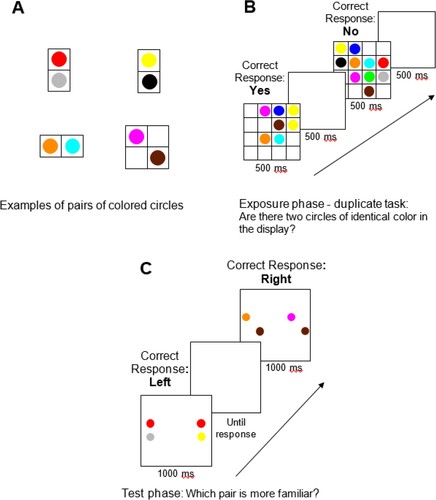
In every trial, a display of 2–10 (but never 6) coloured circles appeared on the screen. Displays with an odd number of circles (3, 5, 7, and 9) contained unique colour pairs (1, 2, 3, and 4, respectively) and 1 additional single circle. For displays with an even number of circles (4 and 8), two options were created. Half of these displays contained only pairs (2 and 4, respectively), and the other half contained both pairs (1 and 3, respectively) and 2 additional single circles. Displays with 2 circles always contained 2 single circles in order to avoid a colour paired being presented by itself. Displays with 10 circles contained all 4 pairs and the two single circles. The display was created on an invisible 4X4 grid (subtending 18.1 × 18.1°). In order to ensure that SL could be determined only by co-occurrence and no other spatial segmentation cues, each pair on the invisible grid had to be next to at least one of the other pairs or one of the single circles.
Each number of coloured circles (2-10, with the exception of 6) appeared 50 times, creating a total of 400 trials presented in a random order for each participant. In 20% of the displays, a randomly selected pair was modified so both circles appeared in the same colour by randomly changing one colour to the other. These displays were inserted to enable the cover task described below.
The experiment consisted of two phases: exposure and test. In the exposure phase, participants were presented with 400 displays of coloured circles as described above. Each display appeared on screen for 500 ms, followed by a blank interval of 500 ms. Participants performed a colour duplicate detection task, pressing the “/” button on the keyboard if the display contained two circles of the same colour and the “z” button if the display contained no circles of the same colour. This cover task from prior SL studies (Zhao et al., Citation2011; Yu & Zhao, Citation2018) ensured that participants in both groups attended to the displays without making the regularities to be learned (in this case, pairs of different colours) themselves task-relevant. Participants were asked to respond as accurately as possible while the display was still on the screen and before the stimuli changed ((b)).
Immediately after the exposure phase, the participants completed the test phase. In each trial, two circles were shown for 1000 ms on both the left and right sides of the screen ((c)). On one side was a pair that had appeared many times in the exposure phase, whereas on the other side was a foil containing one of the same colours as the pair with a colour from a different exposure pair. The two colours assembled to create each foil had never appeared in that spatial configuration in the exposure phase. Two foils were created for each of the four exposure pairs, one for each of the two colours. Each pair was tested separately against both foils, and all combinations were tested twice for a total of 16 test trials. These trials were presented in random order and the location of the correct pair on the screen (left or right) was counterbalanced across trials.
Participants were asked to decide which side contained two colours whose combination was more familiar based on the first part of the experiment. They pressed either the “1” or “0” button on top of the keyboard for the left or right side, respectively. Participants could respond either while the stimuli were on the screen or afterwards, during a blank screen. A new trial began only after a response from the participant. All colours were presented an equal number of times in both the exposure and test phases. This ensured that test performance reflected familiarity with the pairs rather than the individual colours. Accuracy in the exposure phase and in the test phase were obtained by the computer, and then calculated as a percentage for each participant.
After the computerized experiment, participants were asked to answer a short questionnaire about whether they had noticed the pairs during the exposure phase and about their feeling of confidence in familiarity responses during the test phase. Each participant was tested individually and the experiment took about 20 minutes in total.
Results
Cognitive assessment
As shown in , independent samples t-tests revealed no significant difference between the MLD group and the control group in all assessments (ps > 0.15) except for the 2-minute calculation test. In this test, as expected, the MLD group performed significantly worse compared to the control group.
Table 1. Mean and SD in the assessment tests for each group, independent t-test scores, p values and BFs.
Colour duplicate detection
All participants performed above 90% accuracy in the exposure phase. In addition the A’ was calculated for each participant, treating a “yes” response to duplicate trials as a hit and a “yes” response to non-duplicate trials as a false alarm. No significant difference was found between the MLD group (M = 0.98, SD = 0.01) and the control group (M = 0.97, SD = 0.01) [t(30) = 0.91, p = 0.37, Cohen's d = 0.32].
Familiarity test
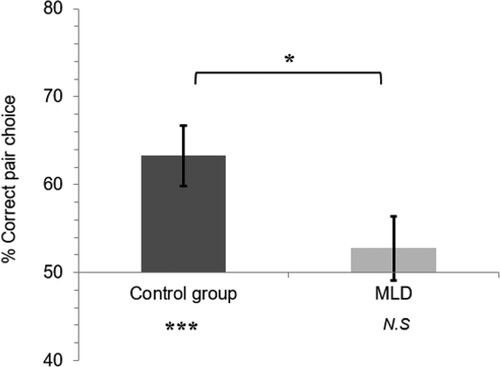
To compare the two groups on SL of the colour pairs from the exposure phase, an independent samples t-test was conducted for accuracy in choosing the pair over the foil across trials in the test phase. As shown in , SL was significantly worse in the MLD group (M = 52.73, SD = 14.43) than in the control group (M = 63.28, SD = 13.86) [t(30) = 2.11, p = .02, Cohen's d = 0.75]. In addition, one sample t-tests against chance (50%) revealed evidence of learning in the control group [t(15) = 3.83, p < .001, Cohen's d = 0.96] but not in the MLD group [t(15) = 0.76, p = .46, Cohen's d = 0.19].
Figure 2. Statistical learning for MLD & Control groups. Error bars represent ± one standard error of the mean; *p < .05, ***p < .001, N.S = not significant.
Bayesian analysis
The finding that the MLD group did not exhibit significant statistical learning could be due to difficulties in visuo-spatial SL in this population or due to data insensitivity (e.g., noise). Because these two possibilities cannot be distinguished using orthodox statistical methods, Bayesian statistical analyses were conducted. In addition, given the relatively small number of participants, the current analysis provides further context and support for the results.
Bayes factors (BF) were calculated using JASP statistical software (version 0.9.2 with default priors; Rouder et al., Citation2012). Analyzing the significant difference in visuo-spatial SL between the two groups revealed a BF10 of 3.346. This can be interpreted as suggesting that, given the data, the research hypothesis – that visuo-spatial SL would be higher in the control vs. MLD group – is 3.346 times more likely than the alternative. This value is considered moderate evidence for the research hypothesis (Beard et al., Citation2016). Moreover, analyzing the significant effect of visuo-spatial SL in the control group compared to chance (50%) revealed a BF10 of 50.288. This is considered very strong support (Beard et al., Citation2016) for the research hypothesis that the control group would show visuo-spatial SL.
Interestingly, analyzing the non-significant visuo-spatial SL in the MLD group compared to chance (50%) revealed a BF10 of 0.328. This suggests that the null hypothesis – that the MLD group would not show visuo-spatial SL – is 3.049 times more likely than the alternative that they would. This is considered moderate evidence for the null hypothesis (Beard et al., Citation2016).
Discussion
The current study examined a new aspect of the relationship between visuo-spatial SL and arithmetic processing, while addressing a population with a numerical deficit in the form of mathematical learning difficulties. This population has severe difficulties in understanding and processing numbers and quantities (e.g., Butterworth, Citation2009).
A group of adults with MLD and a matched control group performed a visual SL task. Both orthodox and Bayesian statistical analyses showed visuo-spatial SL above chance for participants with no learning difficulties. This is in line with previous studies that demonstrated this ability in a variety of tasks (e.g., Conway & Christiansen, Citation2006; Fiser & Aslin, Citation2001; Chun & Jiang, Citation1998; Turk-Browne et al., Citation2008). More importantly, both orthodox and Bayesian statistical analyses also suggested impaired visuo-spatial SL in the population with MLD relative to individuals without such difficulties, and even indicated that no visuo-spatial SL occurred in MLD relative to chance.
Our findings are in line with previous studies that reported a connection between visuo-spatial SL and tasks including statistical summary perception (Zhao et al., Citation2011) and numerosity estimation (Zhao & Yu, Citation2016). The present findings and these previous studies together suggest that interference may result from reliance on a common underlying mechanism. Namely, the same processes that help keep track of discrete and/or continuous quantities may also be required to track and update probabilities over time, but not both at the same time. In the MLD population, this mechanism may be impaired, explaining their numerical difficulties, but also having the co-morbid symptom of reducing or eliminating visuo-spatial SL. The relationship between SL and numerical cognition is strengthened by the present findings, which show that visuo-spatial SL is impaired in individuals who have core deficits is numerical processing.
Another explanation for the connection between visuo-spatial SL and numerical processing might be related to other characteristics shared by these two abilities. Visuo-spatial SL (unknowingly) requires differentiating each item in an array and learning the relations between the individual items (Turk-Browne et al., Citation2009). This process of differentiating and assessing relations is also relevant while dealing with numbers and quantities, for example when comparing two quantities and deciding which is larger. In addition, repetitive exposure to numbers and experience with numerical manipulations contribute to a more efficient numerical processing (Siegler & Opfer, Citation2003). Therefore visuo-spatial SL, which is characterized by learning regularities from repeated experience, might support the process of numerical development.
From an evolutionary point of view, it has been suggested that the arithmetic system is an evolved mechanism that has ancestral origins in other brain mechanisms (Anderson, Citation2010). The core hypothesis of mental reuse in this work is “that evolutionary considerations might often favor reusing existing components for new tasks over developing new circuits de novo” (p. 246). It has been suggested that the numerical system might reuse other mechanisms, such as the finger representation mechanism or the size evaluation mechanism (e.g., Anderson, Citation2010; Cantlon et al., Citation2009; Aisenberg & Henik, Citation2010). Hence, it is possible that the processes underlying the numerical system and visuo-spatial SL abilities are at least partly shared.
With regard to individuals with MLD, the present findings provide another indication that they suffer not only from mathematical difficulties (e.g., Butterworth, Citation1999; Geary et al., Citation2009) but also from a more general deficiency. For example, individuals with MLD have poor visuo-spatial abilities, such as in physical and mental number line bisection tasks (Ashkenazi & Henik, Citation2010). Moreover, individuals with MLD have difficulties with mental rotation (Szucs et al., Citation2013; Skagerlund & Träff, Citation2014) and with visual working memory (Szucs et al., Citation2013; Rotzer et al., Citation2009).
The present study has some limitations worth mentioning. The study was comprised of an all-female sample. This is not unusual for studies on adults with MLD: many other studies include mostly, if not solely, females (e.g., Bulthe et al., Citation2019; Rubinsten et al., Citation2020; Fooks et al., Citation2021). Another possible limitation of the study may be that most of the background measures were performance-based, while the attention test was a rating-scale questionnaire. A final potential limitation is related to the characteristics of the task used to measure SL. The SL task we used involved spatial regularities in colour arrays and thus the observed deficit may be another case of visuo-spatial difficulties in MLD. This could be tested in future studies by employing different kinds of SL tasks, such as temporal SL of regularities in visual (Fiser & Aslin, Citation2002) and auditory (Saffran et al., Citation1996) sequences. These future directions would help characterize whether MLD results in a general impairment in SL, or whether the deficit is specific to the spatial dimension and visuo-spatial modality. In addition, the links between SL and other cognitive processes such as reading (Spencer et al., Citation2015; Frost et al., Citation2013) may point to other potential deficits in MLD.
Indeed, the current study suggests that individuals with MLD might have broad differences in cognition. Learned regularities can facilitate cognitive processing, leading to increased working memory capacity (Brady et al., Citation2009) and improved object recognition (Bays et al., Citation2015). This facilitation could impact real-word visuo-spatial behaviour. When entering a new workplace, we typically know where to reach for the light switches or where the coffee mugs and silverware can be found in the kitchen. When going to a new supermarket, we can shop efficiently knowing the plausible location of what we need to buy in relation to other products. Thus, beyond central numerical difficulties, impaired visuo-spatial SL in individuals with MLD may create new challenges in everyday life.
Disclosure statement
No potential conflict of interest was reported by the author(s).
Additional information
Funding
References
- Aisenberg, A., & Henik, A. (2010). Re-use or re-function? Behavioral and Brain Sciences, 33(4), 266–267. doi:10.1017/S0140525X10000981
- Alvarez, G. A., & Oliva, A. (2008). The representation of simple ensemble visual features outside the focus of attention. Psychological Science, 19(4), 392–398. doi:10.1111/j.1467-9280.2008.02098.x
- American Psychiatric Association. (2013). Diagnostic and statistical manual of mental disorders (5th ed.). American Psychiatric Publishing.
- Anderson, M. L. (2010). Neural reuse: A fundamental organizational principle of the brain. Behavioral and Brain Sciences, 33(4), 245–313. doi:10.1017/S0140525X10000853
- Ariely, D. (2001). Seeing sets: Representation by statistical properties. Psychological Science, 12(2), 157–162. doi:10.1111/1467-9280.00327
- Ashkenazi, S., & Henik, A. (2010). A disassociation between physical and mental number bisection in developmental dyscalculia. Neuropsychologia, 48(10), s2861–2868. doi:10.1016/j.neuropsychologia.2010.05.028
- Baldwin, D., Andersson, A., Saffran, J., & Meyer, M. (2008). Segmenting dynamic human action via statistical structure. Cognition, 106(3), 1382–1407. doi:10.1016/j.cognition.2007.07.005
- Bays, B. C., Turk-Browne, N. B., & Seitz, A. R. (2015). Dissociable behavioural outcomes of visual statistical learning. Visual Cognition, 23(9-10), 1072–1097. doi:10.1080/13506285.2016.1139647
- Beard, E., Dienes, Z., Muirhead, C., & West, R. (2016). Using Bayes factors for testing hypotheses about intervention effectiveness in addictions research. Addiction, 111(12), 2230–2247. doi:10.1111/add.13501
- Brady, T. F., Konkle, T., & Alvarez, G. A. (2009). Compression in visual working memory: Using statistical regularities to form more efficient memory representations. Journal of Experimental Psychology: General, 138(4), 487–502. doi:10.1037/a0016797
- Brainard, D. H. (1997). The psychophysics toolbox. Spatial Vision, 10(4), 433–436. doi:10.1163/156856897X00357
- Bulthe, J., Prinsen, J., Vanderauwera, J., Duyck, S., Daniels, N., Gillebert, C.R., Mantini, D., Op de Beeck, H.P., & De Smedt, B. (2019). Multi-method brain imaging reveals impaired representations of number as well as altered connectivity in adults with dyscalculia. NeuroImage, 190, 289–302. doi:10.1016/j.neuroimage.2018.06.012
- Butterworth, B. (1999). What counts: How every brain is hardwired for math. Free Press.
- Butterworth, B. (2009). Developmental dyscalculia. In J. Reed, & J. Warner-Rogers (Eds.), Child neuropsychology: Concepts, theory, and practice (pp. 357–374). John Wiley & Sons.
- Butterworth, B., Varma, S., & Laurillard, D. (2011). Dyscalculia: From brain to education. Science, 332(6033), 1049–1053. doi:10.1126/science.1201536
- Campbell, K. L., Zimerman, S., Lee, M. M. S., & Hasher, L. (2010). Age-related advantage in visual statistical learning. Poster presented at 51st Annual Meeting of the Psychonomic Society, St. Louis, MO.
- Cantlon, J. F., Platt, M. L., & Brannon, E. M. (2009). Beyond the number domain. Trends in Cognitive Sciences, 13(2), 83–91. doi:10.1016/j.tics.2008.11.007
- Chong, S. C., & Treisman, A. (2005). Statistical processing: Computing the average size in perceptual groups. Vision Research, 45(7), 891–900. doi:10.1016/j.visres.2004.10.004
- Chun, M. M., & Jiang, Y. (1998). Contextual cueing: Implicit learning and memory of visual context guides spatial attention. Cognitive Psychology, 36(1), 28–71. doi:10.1006/cogp.1998.0681
- Cohen-Kadosh, R., Cohen Kadosh, K., Schumann, T., Kaas, A., Goebel, R., Henik, A., & Sack, A. T. (2007). Virtual dyscalculia after TMS to the right parietal lobe: A combined fMRI and neuronavigated TMS study. Current Biology, 17(8), 689–693. doi:10.1016/j.cub.2007.02.056
- Conway, C. M., & Christiansen, M. H. (2006). Statistical learning within and between modalities: Pitting abstract against stimulus specific representations. Psychological Science, 17(10), 905–912. doi:10.1111/j.1467-9280.2006.01801.x
- Dehaene, S., Piazza, M., Pinel, P., & Cohen, L. (2003). Three parietal circuits for number processing. Cognitive Neuropsychology, 20(3-6), 487–506. doi:10.1080/02643290244000239
- Emberson, L. L., Conway, C. M., & Christiansen, M. H. (2011). Timing is everything: Changes in presentation rate have opposite effects on auditory and visual implicit statistical learning. The Quarterly Journal of Experimental Psychology, 64(5), 1021–1040. doi:10.1080/17470218.2010.538972
- Faul, F., Erdfelder, E., Lang, A. G., & Buchner, A. (2007). G* Power 3: A flexible statistical power analysis program for the social, behavioral, and biomedical sciences. Behavior Research Methods, 39(2), 175–191. doi:10.3758/BF03193146
- Fiser, J., & Aslin, R. N. (2001). Unsupervised statistical learning of higher-order spatial structures from visual scenes. Psychological Science, 12(6), 499–504. doi:10.1111/1467-9280.00392
- Fiser, J., & Aslin, R. N. (2002). Statistical learning of higher-order temporal structure from visual shape sequences. Journal of Experimental Psychology: Learning, Memory, and Cognition, 28(3), 458–467. doi:10.1037/0278-7393.28.3.458
- Fooks, N., Hadad, B. S., & Rubinsten, O. (2021). Nonsymbolic-magnitude deficit in adults with developmental dyscalculia: Evidence of impaired size discrimination but intact size constancy. Psychological Science, 32(8), 1271–1284. doi:10.1177/0956797621995204
- Frost, R., Siegelman, N., Narkiss, A., & Afek, L. (2013). What predicts successful literacy acquisition in a second language? Psychological Science, 24(7), 1243–1252. doi:10.1177/0956797612472207
- Gabay, Y., Thiessen, E. D., & Holt, L. L. (2015). Impaired statistical learning in developmental dyslexia. Journal of Speech, Language, and Hearing Research, 58(3), 934–945. doi:10.1044/2015_JSLHR-L-14-0324
- Geary, D. C., Bailey, D. H., Littlefield, A., Wood, P., Hoard, M. K., & Nugent, L. (2009). First grade predictors of mathematical learning disability: A latent class trajectory analysis. Cognitive Development, 24(4), 411–429. doi:10.1016/j.cogdev.2009.10.001
- Gilbert, C. D., Sigman, M., & Crist, R. E. (2001). The neural basis of perceptual learning. Neuron, 31(5), 681–697. doi:10.1016/S0896-6273(01)00424-X
- Kave, G. (2006). : The development of naming and word fluency: Evidence from Hebrew-speaking children between ages 8 and 17. Developmental Neuropsychology, 29(3), 493–508. doi:10.1207/s15326942dn2903_7
- Kirkham, N. Z., Slemmer, J. A., & Johnson, S. P. (2002). Visual statistical learning in infancy: Evidence for a domain general learning mechanism. Cognition, 83(2), B35–B42. doi:10.1016/S0010-0277(02)00004-5
- MATAL. (2007). Diagnostic battery for the assessment of learning functions. The Council for Higher Education and the Center for Psychometric Tests.
- Musz, E., Weber, M. J., & Thompson-Schill, S. L. (2015). Visual statistical learning is not reliably modulated by selective attention to isolated events. Attention, Perception, & Psychophysics, 77(1), 78–96. doi:10.3758/s13414-014-0757-5
- Olshausen, B. A., & Field, D. J. (1996). Emergence of simple-cell receptive field properties by learning a sparse code for natural images. Nature, 381(6583), 607–609. doi:10.1038/381607a0
- Openhaim–Biton, S., & Breznitz, Z. (2004). 2minutes calculation test. Unpublished test. University of Haifa, Israel.
- Pelli, D. G. (1997). The VideoToolbox software for visual psychophysics: Transforming numbers into movies. Spatial Vision, 10(4), 437–442. doi:10.1163/156856897X00366
- Piazza, M., Izard, V., Pinel, P., Le Bihan, D., & Dehaene, S. (2004). Tuning curves for approximate numerosity in the human intraparietal sulcus. Neuron, 44(3), 547–555. doi:10.1016/j.neuron.2004.10.014
- Piazza, M., Pinel, P., Le Bihan, D., & Dehaene, S. (2007). A magnitude code common to numerosities and number symbols in human intraparietal cortex. Neuron, 53(2), 293–305. doi:10.1016/j.neuron.2006.11.022
- Price, G. R., & Ansari, D. (2013). Dyscalculia: Characteristics, causes, and treatments. Numeracy, 6(1), 1–16. doi:10.5038/1936-4660.6.1.2
- Price, G. R., Holloway, I., Räsänen, P., Vesterinen, M., & Ansari, D. (2007). Impaired parietal magnitude processing in developmental dyscalculia. Current Biology, 17(24), 1042–1043. doi:10.1016/j.cub.2007.10.013
- Raven, J. C. (1960). Guide to the standard progressive matrices. H.K. Lewis.
- Rinaldi, L., & Girelli, L. (2017). Commentary: From ‘sense of number’ to ‘sense of magnitude’–The role of continuous magnitudes in numerical cognition. Frontiers in Psychology, 8, 652. doi:10.3389/fpsyg.2017.00652
- Rotzer, S., Loenneker, T., Kucian, K., Martin, E., Klaver, P., & Von Aster, M. (2009). Dysfunctional neural network of spatial working memory contributes to developmental dyscalculia. Neuropsychologia, 47(13), 2859–2865. doi:10.1016/j.neuropsychologia.2009.06.009
- Rouder, J. N., Morey, R. D., Speckman, P. L., & Province, J. M. (2012). Default Bayes factors for ANOVA designs. Journal of Mathematical Psychology, 56(5), 356–374. doi:10.1016/j.jmp.2012.08.001
- Rubinsten, O., & Henik, A. (2009). Developmental dyscalculia: Heterogeneity may not mean different mechanisms. Trends in Cognitive Science, 13(2), 92–99. doi:10.1016/j.tics.2008.11.002
- Rubinsten, O., Korem, N., Perry, A., Goldberg, M., & Shamay-Tsoory, S. (2020). Different neural activations for an approaching friend versus stranger: Linking personal space to numerical cognition. Brain and Behavior, 10(6), 1–13. doi:10.1002/brb3.1613
- Saffran, J. R., Aslin, R. N., & Newport, E. L. (1996). Statistical learning by 8-month-old infants. Science, 274(5294), 1926–1928. doi:10.1126/science.274.5294.1926
- Shalev, R. S., Auerbach, J., Manor, O., & Gross-Tsur, V. (2000). Developmental dyscalculia: Prevalence and prognosis. European Child & Adolescent Psychiatry, 9(S2), S58–S64. doi:10.1007/s007870070009
- Shalev, R. S., Manor, O., & Gross-Tsur, V. (2005). Developmental dyscalculia: A prospective six-year follow-up. Developmental Medicine & Child Neurology, 47(2), 121–125. doi:10.1017/S0012162205000216
- Shatil, E. (1997a). One-minute test for words. Unpublished test, University of Haifa, Haifa.
- Shatil, E. (1997b). One-minute test for pseudo-words. Unpublished test, University of Haifa, Haifa.
- Siegler, R. S., & Opfer, J. E. (2003). The development of numerical estimation: Evidence for multiple representations of numerical quantity. Psychological Science, 14(3), 237–250. doi:10.1111/1467-9280.02438
- Skagerlund, K., & Träff, U. (2014). Development of magnitude processing in children with developmental dyscalculia: Space, time, and number. Frontiers in Psychology, 5, 675. doi:10.3389/fpsyg.2014.00675
- Spencer, M., Kaschak, M. P., Jones, J. L., & Lonigan, C. J. (2015). Statistical learning is related to early literacy-related skills. Reading and Writing, 28(4), 467–490. doi:10.1007/s11145-014-9533-0
- Szucs, D., Devine, A., Soltesz, F., Nobes, A., & Gabriel, F. (2013). Developmental dyscalculia is related to visuo-spatial memory and inhibition impairment. Cortex, 49(10), 2674–2688. doi:10.1016/j.cortex.2013.06.007
- Toro, J. M., & Trobalón, J. B. (2005). Statistical computations over a speech stream in a rodent. Perception & Psychophysics, 67(5), 867–875. doi:10.3758/BF03193539
- Turk-Browne, N. B., Isola, P. J., Scholl, B. J., & Treat, T. A. (2008). Multidimensional visual statistical learning. Journal of Experimental Psychology: Learning, Memory, and Cognition, 34(2), 399–407. doi:10.1037/0278-7393.34.2.399
- Turk-Browne, N. B., Jungé, J., & Scholl, B. J. (2005). The automaticity of visual statistical learning. Journal of Experimental Psychology: General, 134(4), 552–564. doi:10.1037/0096-3445.134.4.552
- Turk-Browne, N. B., & Scholl, B. J. (2009). Flexible visual statistical learning: Transfer across space and time. Journal of Experimental Psychology: Human Perception and Performance, 35(1), 195–202. doi:10.1037/0096-1523.35.1.195
- Turk-Browne, N. B., Scholl, B. J., Chun, M. M., & Johnson, M. K. (2009). Neural evidence of statistical learning: Efficient detection of visual regularities without awareness. Journal of Cognitive Neuroscience, 21(10), 1934–1945. doi:10.1162/jocn.2009.21131
- Turk-Browne, N. B., Scholl, B. J., Johnson, M. K., & Chun, M. M. (2010). Implicit perceptual anticipation triggered by statistical learning. Journal of Neuroscience, 30, 1177–1187.
- Walsh, V. (2003). A theory of magnitude: Common cortical metrics of time, space and quantity. Trends in Cognitive Sciences, 7(11), 483–488. doi:10.1016/j.tics.2003.09.002
- Watanabe, T., Nanez, J. E., & Sasaki, Y. (2001). Perceptual learning without perception. Nature, 413(6858), 844–848. doi:10.1038/35101601
- Yu, R. Q., & Zhao, J. (2018). Object representations are biased toward each other through statistical learning. Visual Cognition, 26(4), 253–267. doi:10.1080/13506285.2018.1435596
- Zhao, J., Ngo, N., McKendrick, R., & Turk-Browne, N. B. (2011). Mutual interference between statistical summary perception and statistical learning. Psychological Science, 22(9), 1212–1219. doi:10.1177/0956797611419304
- Zhao, J., & Yu, R. Q. (2016). Statistical regularities reduce perceived numerosity. Cognition, 146, 217–222. doi:10.1016/j.cognition.2015.09.018