
ABSTRACT
The other race effect (ORE) in part describes how people are poorer at identifying faces of other races compared to own-race faces. While well-established with face memory, more recent studies have begun to demonstrate its presence in face matching tasks, with minimal memory requirements. However, several of these studies failed to compare both races of faces and participants in order to fully test the predictions of the ORE. Here, we utilized images of both Black and White individuals, and Black and White participants, as well as tasks measuring perceptions of face matching and similarity. In addition, human judgements were directly compared with computer algorithms. First, we found only partial support for an ORE in face matching. Second, a deep convolutional neural network (residual network with 29 layers) performed exceptionally well with both races. The DCNN’s representations were strongly associated with human perceptions. Taken together, we found that the ORE was not robust or compelling in our human data, and was absent in the computer algorithms we tested. We discuss our results in the context of ORE literature, and the importance of state-of-the-art algorithms.
The other race effect (ORE) is well-known in the domain of face recognition and describes how people more accurately remember faces of their own race compared with faces of other races (Malpass & Kravitz, Citation1969). A review published over thirty years after the initial finding showed that, across 91 independent samples testing participants of several different races, there was a small but consistent memory advantage for own- compared with other-race faces (Meissner & Brigham, Citation2001). However, there remain situations in which the ORE appears to be absent. For example, Estudillo and colleagues (Citation2020) found no evidence of the ORE in a multi-racial sample of Malaysian Chinese, Malaysian Indian, and Malaysian Malay participants.
Debate continues around the mechanisms underlying the ORE. The social categorization hypothesis suggests that own- and other-race faces are categorized as more and less self-relevant respectively, and that this level of encoding is responsible for memory biases (Hugenberg et al., Citation2010; Rodin, Citation1987; Sporer, Citation2001). As a result, cognitive resources are allocated sparingly, with more allocated to in-group/own-race faces than out-group/other-race faces (Rodin, Citation1987). This theory has had some traction more recently, with an in-group bias being reported which does not rely on face race (Bernstein et al., Citation2007). Faces of the same race were assigned as in-group or out-group members based on social categories, and a similar bias was found as in the ORE (although for failures to replicate, see Fuller et al., Citation2021; Harrison et al., Citation2020).
The perceptual expertize or contact hypothesis of the ORE draws on the face space literature which conceptualizes each identity as one point in a multidimensional “face space” (Valentine, Citation1991). Unlike the social categorization hypothesis, the contact hypothesis suggests that the ORE results from different exposure to and expertize with own- and other-race faces (Chance et al., Citation1982; Chiroro & Valentine, Citation1995; Rhodes et al., Citation1989). That is, we have more exposure to own-race faces and so become more perceptually tuned to processing those faces. Evidence for this theory comes both from developmental research, where children’s ORE increased as they gained more experience with own-race faces (e.g., Chien et al., Citation2016), and that increased contact with people of other races reduced the ORE (Hancock & Rhodes, Citation2008) particularly when the contact occurs during childhood (McKone et al., Citation2019; Singh et al., Citation2022).
Recent evidence suggests that the ORE is driven by working memory. Nishimura and colleagues (Citation2021) found an increased working memory storage capacity for own- compared to other-race faces, without a relationship between storage capacity and encoding rate, suggesting that working memory storage was particularly important in the ORE. Further, Stelter and Degner (Citation2018) showed consistent decreases in performance for other- compared with own-race faces, in addition to a reduced working memory capacity for other-race faces. The authors argued that the ORE originates during the early stages of cognitive processing. This conclusion suggests a perceptual explanation for the ORE, rather than one based on social categorization.
The majority of research on the ORE has used an old/new recognition memory paradigm. Participants view a series of faces at the study phase, and then during the test phase that follows, they are asked to differentiate these “old” faces from “new” (never before seen) ones. More recently, however, the ORE has been found in perceptual tasks that do not require memory (as discussed below), further suggesting a perceptual expertize account of the ORE.
Other-race effect in face matching
Given that the ORE has been, at least to some extent, well-established in face recognition, researchers sought to determine whether the effect relied on memory storage and/or retrieval (which are fundamental to later recognition) or if detriments were already present in the perceptual encoding of the faces (e.g., Sporer, Citation2001; Valentine, Citation1991). To this end, Megreya and colleagues (Citation2011) investigated the ORE in face matching, where images remained onscreen while decisions were made (e.g., “do these photographs depict the same person or not?”), and so the memory component was minimal. Even so, the findings provided evidence of an ORE, with participants showing worse performance for other- in comparison with own-race faces.
provides a summary of the literature regarding the ORE and face matching tasks. Matching tasks present either (a) two images side-by-side and require participants to judge whether the images show the same person or two different people (one-to-one task); or (b) a target image alongside an array of images and require the participant to decide whether the target identity appears in the array (one-to-many task). Sorting tasks present the participants with multiple images of multiple identities and require participants to sort the images into piles, with each pile representing one identity. A closer inspection of some of the articles in highlights possible limitations within those studies. For example, experiments that only utilized one race of participant risk their findings being due to the properties of the stimuli alone (e.g., Proietti et al., Citation2019; Robertson et al., Citation2020; Susa et al., Citation2019). To illustrate, if White participants showed worse performance with images of East Asian in comparison with images of White individuals (Proietti et al., Citation2019) then this may simply have been due to the use of a more difficult set of images of East Asian individuals (perhaps as a result of image selection or the creation of face pairings). Indeed, this was acknowledged by Robertson and colleagues (Citation2020) as an alternative interpretation of their results.
Table 1. A chronological summary of the literature investigating the ORE during face matching. Note that these race labels were used by the original authors.
Another issue within studies so far is the reliance on a limited number of races. With few exceptions, researchers have focussed on White and East Asian participants when exploring the ORE, presumably for reasons related to convenience. For the ORE in face recognition, different deficits may be apparent depending on which pairing of races is used (Gross, Citation2009). includes only two studies that featured images of Black individuals (Meissner et al., Citation2013; Susa et al., Citation2019), although neither of these recruited Black participants (see the limitation discussed above). Interestingly, both studies paired images of African American individuals with non-White individuals, suggesting a notable gap in the literature.
In addition, several of the studies in reported only partial support for an ORE. For example, Havard (Citation2021) incorporated both White and Asian participants and images of White and Asian individuals. However, for “match” trials (i.e., both images showed the same person), only Asian participants showed an ORE (performing worse with images of White individuals in comparison with Asian individuals). For “mismatch” trials (i.e., the two images depicted different people), the opposite pattern was found – only White participants showed an ORE, with worse performance for images of Asian individuals in comparison with White individuals. Considering overall performance, as measured with sensitivity d′, only White participants showed an ORE (for whole faces, since the study also included other conditions).
Similarly, Tüttenberg and Wiese (Citation2019) carried out a sorting task with both White and East Asian participants and images of White and East Asian individuals. However, in both experiments, only White participants showed fewer sorting errors for own- relative to other-race identities. The authors argued that the most likely explanation for this lack of an ORE in East Asian participants was their extensive experience with White individuals (since they had been living in the UK at the time). Previous research has also identified a reduced or absent ORE for face recognition in those with enhanced expertize for other-race faces (e.g., Hancock & Rhodes, Citation2008).
More recently, Mallick et al. (Citation2022) reported the ORE when investigating pairs of unaltered images, as well as images paired with 50/50 morphs (computer-generated averages created using two images of different people). Their one-to-one matching task incorporated both White and East Asian participants and images of White and East Asian individuals. Although the results were couched in terms of a partial ORE, their analyses actually showed that no ORE was present when considering only the unaltered image pairs. Again, all of their participants were based at a university in the US, and so experience with other-race faces might explain the absence of an ORE.
Other-race effect in computer algorithms
Since the introduction of automated border control e-gates and other computer systems in identity verification, researchers have been investigating whether algorithms might also demonstrate an ORE. To this end, Phillips et al. (Citation2011) compared algorithms originating from Western countries with those from East Asian countries. Their results confirmed that these computer systems did indeed demonstrate an ORE, better recognizing faces from where they were developed. Although these were “black-box” algorithms (i.e., their implementations were unknown to the researchers who tested them), it is possible that differences in the racial composition of the training datasets may provide the underlying explanation.
Since 2014, state-of-the-art algorithms have incorporated deep convolutional neural networks (DCNNs), resulting in a marked increase in accuracy and generalizability with face matching (Krizhevsky et al., Citation2012). These employ a series of pooling and convolution operations across multiple layers of simulated neurons, resulting in a compressed representation of a face that can be directly examined. Several studies have considered whether these types of systems also demonstrate an ORE. To date, the results appear to confirm that the ORE is indeed often present in DCNNs (e.g., El Khiyari & Wechsler, Citation2016; Krishnapriya et al., Citation2019; for a review, see Cavazos et al., Citation2021). However, the size of this bias, or demographic effect, varies substantially across algorithms (Grother et al., Citation2019) and appears to be the result of several potential factors. These include the racial composition of the training and/or test sets (e.g., if demographic subgroups are disproportionately represented), their quality (e.g., photographic quality may differ across subgroups), the nesting of subgroups (e.g., race biases may differ for female versus male faces, or challenging versus easier stimuli), and how the user chooses to construct mismatch image pairs and select the threshold for determining algorithm performance. Considering the most recent algorithms, Cavazos et al. (Citation2021) found impressive performance for both race groups tested, but that more difficult items resulted in an increased ORE.
The current study
Given some of the limitations and omissions we have identified above, the current study sought to investigate the ORE in face matching by incorporating several novel approaches. First, we utilized both images of White and Black individuals and White and Black participants, something that has so far remained untested. The complete design (both races of stimuli and participants) was important for the reasons outlined above, and also illustrates how very few studies have investigated the ORE with Black participants. Second, we had participants judge similarity as well as matching, allowing us to compare human similarity ratings with algorithm representations. Finally, we investigated a potential ORE in computer algorithms using the same face matching task and stimuli. We considered both a state-of-the-art DCNN and a simple, baseline algorithm (utilizing principal components analysis; PCA, see Supplementary Materials, Section 2). Human similarity ratings could therefore be compared to algorithm representation of images, and algorithm accuracy could also be assessed.
Methods
Participants
One hundred and ninety-five participants took part in the matching task (100 self-reported White, 95 self-reported Black; age M = 34 years, SD = 11 years; 62 men, 130 women, 3 other).
One hundred and ninety-six different participants took part in the similarity rating task (97 self-reported White, 99 self-reported Black; age M = 34 years, SD = 12 years; 57 men, 135 women, 4 other).
Participants were recruited via Prolific.co and compensated £1.25 for their participation. Using Prolific’s settings, we limited participants to those who were resident in the UK (see familiarity manipulation below). All participants gave informed consent before participating in the experiment and were provided with a debriefing upon completion. This experiment was approved by the university’s ethics committee (#2021_6697) and was carried out in accordance with the provisions of the World Medical Association Declaration of Helsinki.
An a priori power analysis for the matching task was conducted using G*Power 3.1 (Faul et al., Citation2007), based on a medium effect size (f = 0.25) for the interaction between Stimulus Race and Participant Race. To achieve 95% power at an alpha of .05, a total sample size of 54 was required.
Stimuli
The stimuli comprised pairs of face images (20 White individuals, 20 Black individuals, with half being women for each race). The images featured local celebrities from outside of the UK, who were chosen specifically to be unfamiliar to participants in the UK. All images were “ambient” (i.e., showing natural variability in pose, expression, lighting etc.; see Ritchie & Burton, Citation2017) and were obtained through Google Images searches.
Images were presented in pairs (see ). Match pairs showed two images of the same person, while mismatch pairs showed an image of the target identity alongside a foil image – an image of an individual who meets the same verbal description as the target (e.g., young woman, dark hair). As in previous research (e.g., Ritchie, Kramer et al., Citation2021; Ritchie & Burton, Citation2017), the images were paired by the authors based on perceived similarity of foils and target identities. There were no criteria for the similarity of the two matching images of each identity other than they not be from the same instance (e.g., the same photo shoot). The assignment of identities to matching conditions was counterbalanced across participants so that each identity was seen only once by each participant. Therefore, half of the participants saw each identity as a match trial, and half as a mismatch. For each participant, therefore, there were 40 trials – ten match and ten mismatch face pairs for each race of face.
Figure 1. Example stimuli depicting female faces. The two images on the right show the same person, the two images on the right show different people.
Note: Copyright restrictions prevent publication of the images used in the experiment. These images are illustrative of the experimental stimuli and depict people who did not appear in the experiments but have given permission for their images to be reproduced here.

Procedure
Human tasks
The same image pairs were used for the matching and similarity rating tasks. In the matching task, participants were shown all 40 face pairs and asked to indicate whether the two photos showed the same person or two different people, with responses provided using a scale from 1 (definitely not the same person) to 7 (definitely the same person). In the similarity rating task, participants were asked to rate the similarity of the two faces in each image pair using a scale from 1 (not very similar) to 7 (very similar).
All image pairs in both tasks were presented in a random order. Participants were randomly assigned to either the matching or the similarity rating task.
DCNN
To represent a more state-of-the-art algorithm, we employed a DCNN. First, faces were automatically detected within the 120 photographs, which were then cropped to include only these regions, using dlib (King, Citation2009) and its CNN face detection package (King, Citation2015).
The algorithm comprised a residual network (ResNet) DCNN with 29 layers (based on a previous ResNet-34 network; He et al., Citation2016) that produced a 128-dimensional feature vector (referred to as an “embedding”) that described each face. The network was trained using images from the FaceScrub dataset (Ng & Winkler, Citation2014), the Visual Geometry Group (VGG) dataset (Parkhi et al., Citation2015), and a large number of additional images scraped from the internet. However, after labelling errors and other issues were addressed, only approximately half of the remaining images were from the VGG and FaceScrub datasets. In total, the training set comprised 2,998,317 images of 7,485 identities (84.7% White, with the remaining identities including both Black and other races). The colour image resolution of the input layer was 150 × 150 pixels.
Results
We focussed on the comparison between White and Black participants’ responses as a test of the ORE (with any significant differences suggesting generalizability to the population more broadly), rather than the less informative comparison between responses to White versus Black stimuli (which would only inform regarding generalizability to other stimuli).
We analyse the matching test in and of itself as a test of the ORE in face matching. We analyse the human similarity judgements only in relation to the DCNN data representing face similarity.
In addition to traditional frequentist hypothesis testing, we included Bayes factors using JASP (JASP Team, Citation2020), which allowed us to quantify the extent to which the data supported the alternative hypothesis (BF10). No participants in either task indicated familiarity with any of the stimulus identities and so none were excluded from the analyses.
Matching task
Our participants did not provide explicit “same” or “different” identity judgements, therefore we use their scale ratings to produce the receiver operating characteristic (ROC), with the area under this ROC curve (AUC) representing a measure that is widely used to assess the performance of classification rules over the entire range of possible thresholds (Krzanowski & Hand, Citation2009). AUC allows quantification of the performance of a classifier (here, each participant) irrespective of where the cut-off between binary “same”/”different” responses might have been placed. This more fine-grained analysis bypassed the need to rely on a participant’s final decision (“same”/“different”) in favour of investigating what was presumably the underlying perception – the likelihood that this pair of images depicted the same person (e.g., Towler et al., Citation2021).
For each participant, we calculated the hit and false alarm rates for each possible threshold (i.e., the theoretical boundary between “same” and “different”) along the response scale (1 through 7).Footnote1 Rather than making explicit judgements about whether image pairs were the same person or two different people, participants rated the likelihood that each pair was the same person. AUC is typically very similar to traditional performance measures such as proportion correct where those are calculated by dichotomizing rating scales into “same” and “different” responses (e.g., Kramer et al., Citation2021). To aid interpretation of our results, AUC values range from 0 to 1, representing individuals who classify the trials correctly (showing the same person or two different people) in 0% and 100% of occasions respectively. An AUC of 0.5 is equivalent to 50% correct in this case as we have two trial types. This approach, therefore, focussed on their internal representation of the likelihood that each pair showed the same person (a continuous measure) rather than forcing a binary decision based on an internal threshold that differentiates “same” from “different” pairs.
A 2 (Stimulus Race: White, Black) × 2 ( Participant Race: White, Black) mixed analysis of variance (ANOVA) on AUC showed a non-significant main effect of Stimulus Race, F(1, 193) = 3.84, p = .052, ηp2 = .02, BF10 = 1.21, and a significant main effect of Participant Race, F(1, 193) = 8.91, p = .003, ηp2 = .04, BF10 = 12.20. However, these were qualified by a significant interaction, F(1, 193) = 5.67, p = .018, ηp2 = .03, BF10 = 3.03 (see ). Follow-up Bonferroni-corrected paired samples t-tests showed that White participants did not differ in their AUC values for images of White (M = 0.81) and Black individuals (M = 0.81), t(99) = 0.29, p = 1.00, Cohen’s d = .03, BF10 = 0.12, while Black participants performed better with images of Black (M = 0.87) in comparison with White individuals (M = 0.83), t(94) = 3.17, p = .004, Cohen’s d = .32, BF10 = 11.67.
Figure 2. The interaction between Stimulus Race and Participant Race for AUC measures. Error bars represent 95% confidence intervals.
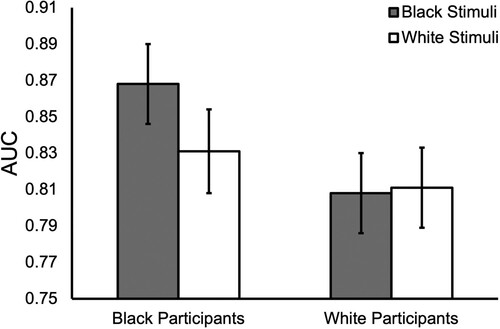
Therefore, the results from the matching task suggested partial evidence of the ORE, with Black participants showing better performance for images of Black over White stimulus pairs. Further, by considering trial-level responses (see the Supplementary Materials, Section 1), we found that Black participants showed greater accuracy with images of Black, in comparison with White individuals, for mismatch trials in particular.
Similarity task
For the similarity task, our main comparison was with the DCNN below. We did, however, compare similarity ratings for matching and mismatching identity pairs. Collapsed across all participants and stimuli, a paired samples t-test showed that similarity ratings were higher for match (M = 4.95) compared to mismatch image pairs (M = 3.16), t(391) = 30.59, p < .001, Cohen’s d = 1.55, BF10 > 1000.
DCNN performance
As described above, for the DCNN, each of the 120 images was represented by a 128-dimensional embedding. To determine algorithm-judged similarity, we calculated the Euclidean distance between pairs of images, for each match and mismatch pairing.
To investigate whether the DCNN performed better with images of Black versus White individuals, we calculated the difference between distances by subtracting the matching pair distance from the mismatching pair distance for each of the 40 identities (80 face pairs in total). Larger differences would indicate better face matching performance since, ideally, matching pair distances should be small (i.e., images of the same person were located closer to each other) while mismatching pair distances should be large (i.e., images of different people were further away). We carried out an independent samples t-test comparing “mismatch – match” difference measures (see above) for images of Black and White individuals, which showed a non-significant difference t(38) = 1.60, p = .119, Cohen’s d = .50, BF10 = 0.836. The DCNN was equally accurate in distinguishing matching pairs from mismatching ones for images of both Black and White individuals. This is in contrast with a simple PCA which was unable to do so (see Supplementary Materials, Section 2). Two paired samples t-tests comparing the raw distances for match and mismatch pairs, for images of White and Black individuals separately, showed that this DCNN was able to differentiate between match and mismatch pairs for both White, t(19) = 21.34, p < .001, Cohen’s d = 4.77, BF10 > 1000, and Black individuals, t(19) = 10.40, p < .001, Cohen’s d = 2.32, BF10 > 1000. Again, these results contrast with the PCA analysis which could not differentiate between matching and mismatching image pairs (see Supplementary Materials, Section 2).
Comparing human similarity ratings performance and DCNN
As illustrates, DCNN distances between image pairs were negatively correlated with both Black and White participants’ similarity ratings of both races of stimulus (where a negative correlation meant smaller DCNN distances between faces judged to be more similar to humans). The DCNN distances, therefore, were strongly associated with human perception, whereas a simple PCA was not (see Supplementary Materials, Section 2).
Table 2. Correlations between human similarity judgements and DCNN distances.
Discussion
In the current work, we first sought to establish whether there was an ORE for matching ratings, using both White and Black participants and images of White and Black individuals. Second, we considered whether a state-of-the-art face recognition algorithm showed the equivalent of an ORE by displaying a difference in how it represented images of White and Black individuals within its “face space.”
In our human data, we found partial support for an ORE in face matching ratings (only for Black participants). Comparing the human similarity data to algorithm measures showed that human judgements were strongly correlated with the DCNN’s internal representations of the images. The DCNN did not show a bias towards being more accurate with images of White or Black individuals, and performed equally well for both races. This result illustrates the importance of knowing the capabilities of an algorithm before using it for face recognition (Ritchie, Cartledge, et al., Citation2021). A lack of a race bias could be due to an algorithm performing equally poorly with each race of face. Moreover, although some algorithms have shown a bias towards being less accurate for non-White faces, others (including the DCNN used here) did not (Grother et al., Citation2019).
The ORE has typically been found when using face memory paradigms but some studies have also found the ORE in face matching tasks (e.g., Kokje et al., Citation2018). This may suggest support for a “perceptual expertise” as opposed to a “social categorisation” account of the ORE. Here, however, we found only partial support for an ORE in our face matching task. This is not unprecedented. Previous studies have also failed to find evidence of an ORE in both races of participant (e.g., Havard, Citation2021; Tüttenberg & Wiese, Citation2019). Indeed, Mallick et al. (Citation2022) failed to find any evidence of an ORE in their original, unmanipulated faces. It is possible that weaker or absent ORE in some previous matching studies, as well as the current work, may be due to the importance of memory when searching for a robust ORE (Stelter & Degner, Citation2018). It is also worth noting that, although all of the previously published articles (with the exception of Mallick et al., Citation2022) provided at least some support for the ORE, it is possible that publication bias has played a role here since the prevalence of this issue should not be underestimated (Ioannidis et al., Citation2014).
There are some important methodological factors to consider across those previous studies which have found the ORE in perceptual tasks. Most have used standard database images (e.g., Havard, Citation2021; Kokje et al., Citation2018; Megreya et al., Citation2011), which are unlike the ambient images used here, in that each person was photographed in a standardized way (i.e., similar to passport photographs). This has the effect of reducing the noise in the image set, which means that variability between images is due mostly to the change in identity of the images, and not image-based differences such as lighting, camera angle, etc. Therefore, it is likely that our own task, using ambient images, was more difficult (e.g., Dowsett & Burton, Citation2015; Fysh & Bindemann, Citation2018), as well as being more comparable to real-world matching contexts. It remains unclear as to how this increase in difficulty might influence the ORE.
Other studies have sometimes tested only one race of participant (e.g., Meissner et al., Citation2013; Proietti et al., Citation2019; Robertson et al., Citation2020; Susa et al., Citation2019) and so any observed effects could be due to differences in stimulus difficulty between the two races of face images used. A strength of our study is that we tested both Black and White participants. It is important to note that, to our knowledge, no previous studies have investigated the ORE in perceptual tasks using images of both Black and White individuals.
All of our participants were resident in the UK. This was important so that we could make sure that all of the identities used as stimuli in our tasks were unfamiliar to observers (our images featured celebrities from other countries who were unknown in the UK). While the UK is predominantly White (84.8%), Black people also make up 3.5% of the population (based on 2019 population estimates; Office for National Statistics, Citation2021). This does mean, in line with the contact hypothesis, that our participants may have had sufficient exposure to other-race faces to reduce or extinguish the ORE. Indeed, this argument was made by Tüttenberg and Wiese (Citation2019) to explain why no ORE was found in their sorting task for East Asian participants living in the UK. We might, therefore, present two potential reasons for the lack of a clear ORE in the current work: (1) the ORE is not a robust effect when tested using a complete design (incorporating both races of stimuli and participants); and/or (2) the ORE can be extinguished through sufficient exposure to or contact with people of the other race. We did not include a contact measure in our study, and so we cannot rule out that UK participants simply have more contact with and experience of the faces of people of different races. A number of other studies of the ORE using perceptual tasks also did not include contact questionnaires (e.g., Mallick et al., Citation2022; Robertson et al., Citation2020; Susa et al., Citation2019), but two which did measure contact and tested UK participants found that Asian participants living in the UK had high levels of contact with White people (Havard, Citation2021; Tüttenberg & Wiese, Citation2019). Therefore, it is possible that our participants had high levels and quality of social contact with people of the other race, meaning we are unable to conclude whether our mixed findings resulted from a lack of social contact or a genuine absence of an effect. Interestingly, Havard’s (Citation2021) White participants had less contact with Asian people than Asian participants had with White people. In our matching task, only our Black participants showed evidence of an ORE, perhaps indicating that their contact with White people was less than our White participants’ contact with Black people. Future research might consider replicating our task in a UK sample and include a contact questionnaire in order to investigate the role of contact in the ORE in face matching. However, it is worth noting that, whether the result of contact or not, our only partial support for the ORE represents White and Black individuals residing in the UK at present.
The current work found that the DCNN algorithm did not show an ORE, which may seem surprising. The DCNN had previously been trained using a predominantly White set of identities and its performance was high with both races of face (as expected from a state-of-the-art algorithm). Previous studies have found that the nature of any ORE using algorithms was highly variable, with the size of any bias showing substantial differences across algorithms (Grother et al., Citation2019). Perhaps reassuringly here, it was not the case that an ORE was inevitable, even when the racial composition of the training set was unbalanced. This is an interesting result which could have implications for security settings such as airport security or matching a suspect to CCTV footage, where algorithms are used to either verify identity or match images. There have been widely publicized concerns about biases or demographic effects in automatic facial recognition, and the public in different countries are well aware of these (see Ritchie, Cartledge, et al., Citation2021). It is important, therefore, that findings which do not report demographic effects are publicized by the users of the systems in question in order to alleviate public fears of the use of automatic facial recognition technology. Taken together, the variable demographic effects in algorithms reported across studies again highlight the need for users to know the capacity of the systems they are deploying.
Our comparisons between algorithm and human judgements found that the DCNN’s distances between faces in its representational space were strongly correlated with human perceptions. Previous studies have also found this to be the case (e.g., Jozwik et al., Citation2022; Somai & Hancock, Citation2022), with evidence supporting the idea that humans and DCNNs show agreement in their similarity metrics (Abudarham et al., Citation2019; Hancock et al., Citation2020).
In conclusion, we found only partial support for the ORE in human judgements of matching. No previous work has investigated the ORE using both Black and White participants and images of Black and White individuals, and so it is unclear as to why the ORE did not present as a more robust effect. However, one explanation may be the exposure of our participants to other races, given that all of our participants resided in the same country. Finally, we found that the DCNN we tested was equally successful with both races, while its similarity measures were strongly correlated with human perceptions.
Disclosure statement
No potential conflict of interest was reported by the author(s).
Additional information
Funding
Notes
1 In conventional analyses where participants provide a binary “same” or “different” response, hit and false alarm rates would be used to calculate sensitivity indices (d′). Here these values were instead used to calculate true positive rates and false positive rates, allowing us to plot the ROC curve.
References
- Abudarham, N., Shkiller, L., & Yovel, G. (2019). Critical features for face recognition. Cognition, 182, 73–83. https://doi.org/10.1016/j.cognition.2018.09.002
- Bernstein, M. J., Young, S. G., & Hugenberg, K. (2007). The cross-category effect: Mere social categorization is sufficient to elicit an own-group bias in face recognition. Psychological Science, 18(8), 706–712. https://doi.org/10.1111/j.1467-9280.2007.01964.x
- Burton, A. M., White, D., & McNeill, A. (2010). The Glasgow face matching test. Behavior Research Methods, 42(1), 286–291. https://doi.org/10.3758/BRM.42.1.286
- Cavazos, J.G., Jeckeln, G., & O'Toole, A.J. (2023). Collaboration to improve cross-race face identification: Wisdom of the multi-racial crowd?. British Journal of Psychology.
- Cavazos, J. G., Phillips, P. J., Castillo, C. D., & O’Toole, A. J. (2021). Accuracy comparison across face recognition algorithms: Where are we on measuring race bias? IEEE Transactions on Biometrics, Behavior, and Identity Science, 3(1), 101–111. https://doi.org/10.1109/TBIOM.2020.3027269
- Chance, J. E., Turner, A. L., & Goldstein, A. G. (1982). Development of differential recognition for own- and other-race faces. The Journal of Psychology, 112(1), 29–37. https://doi.org/10.1080/00223980.1982.9923531
- Chien, S. H. L., Wang, J. F., & Huang, T. R. (2016). Developing the own-race advantage in 4-, 6-, and 9-month-old Taiwanese infants: A perceptual learning perspective. Frontiers in Psychology, 7, 1606.
- Chiroro, P., & Valentine, T. (1995). An investigation of the contact hypothesis of the own-race bias in face recognition. The Quarterly Journal of Experimental Psychology Section A, 48(4), 879–894. https://doi.org/10.1080/14640749508401421
- Crookes, K., Ewing, L., Gildenhuys, J-D, Kloth, N., Hayward, W. G., Oxner, M., Pond, S., & Rhodes, G. (2015). How well do computer-generated faces tap face expertise? PLoS ONE, 10(11), e0141353. https://doi.org/10.1371/journal.pone.0141353
- Dowsett, A. J., & Burton, A. M. (2015). Unfamiliar face matching: Pairs out-perform individuals and provide a route to training. British Journal of Psychology, 106(3), 433–445. https://doi.org/10.1111/bjop.12103
- El Khiyari, H., & Wechsler, H. (2016). Face verification subject to varying (age, ethnicity, and gender) demographics using deep learning. Journal of Biometrics and Biostatistics, 7, 323.
- Estudillo, A. J., Lee, J. K. W., Mennie, N., & Burns, E. (2020). No evidence of other-race effect for Chinese faces in Malaysian non-Chinese population. Applied Cognitive Psychology, 34(1), 270–276. https://doi.org/10.1002/acp.3609
- Faul, F., Erdfelder, E., Lang, A. G., & Buchner, A. (2007). G*Power 3: A flexible statistical power analysis program for the social, behavioral, and biomedical sciences. Behavior Research Methods, 39(2), 175–191. https://doi.org/10.3758/BF03193146
- Fuller, E. A., Majolo, B., Flack, T. R., & Ritchie, K. L. (2021). The importance of out-group characteristics for the own-group face memory bias. Visual Cognition, 29(4), 263–276. https://doi.org/10.1080/13506285.2021.1905125
- Fysh, M. C., & Bindemann, M. (2018). The Kent face matching test. British Journal of Psychology, 109(2), 219–231. https://doi.org/10.1111/bjop.12260
- Gross, T. F. (2009). Own-ethnicity bias in the recognition of Black, East Asian, Hispanic, and White faces. Basic and Applied Social Psychology, 31(2), 128–135. https://doi.org/10.1080/01973530902880381
- Grother, P., Ngan, M., & Hanaoka, K. (2019). Face recognition vendor test (FRVT) part 3: Demographic effects. National Institute of Standards and Technology.
- Hancock, K. J., & Rhodes, G. (2008). Contact, configural coding and the other-race effect in face recognition. British Journal of Psychology, 99(1), 45–56. https://doi.org/10.1348/000712607X199981
- Hancock, P. J., Somai, R. S., & Mileva, V. R. (2020). Convolutional neural net face recognition works in non-human-like ways. Royal Society Open Science, 7(10), 200595. https://doi.org/10.1098/rsos.200595
- Harrison, V., Hole, G., & Habibi, R. (2020). Are you in or are you out? The importance of group saliency in own-group biases in face recognition. Perception, 49(6), 672–687. https://doi.org/10.1177/0301006620918100
- Havard, C. (2021). The importance of internal and external features in matching own and other race faces. Perception, 50(10), 861–875. https://doi.org/10.1177/03010066211043464
- He, K., Zhang, X., Ren, S., & Sun, J. (2016). Deep residual learning for image recognition. In IEEE conference on computer vision and pattern recognition (pp. 770–778). IEEE.
- Hugenberg, K., Young, S. G., Bernstein, M. J., & Sacco, D. F. (2010). The categorization-individuation model: An integrative account of the other-race recognition deficit. Psychological Review, 117(4), 1168–1187. https://doi.org/10.1037/a0020463
- Ioannidis, J. P., Munafo, M. R., Fusar-Poli, P., Nosek, B. A., & David, S. P. (2014). Publication and other reporting biases in cognitive sciences: Detection, prevalence, and prevention. Trends in Cognitive Sciences, 18(5), 235–241. https://doi.org/10.1016/j.tics.2014.02.010
- JASP Team. (2020). JASP (Version 0.14) [Computer software].
- Jozwik, K. M., O’Keeffe, J., Storrs, K. R., Guo, W., Golan, T., & Kriegeskorte, N. (2022). Face dissimilarity judgments are predicted by representational distance in morphable and image-computable models. Proceedings of the National Academy of Sciences, 119(27), e2115047119. https://doi.org/10.1073/pnas.2115047119
- King, D. E. (2009). Dlib-ml: A machine learning toolkit. Journal of Machine Learning Research, 10, 1755–1758.
- King, D. E. (2015, January 31). Max-margin object detection. arXiv. https://doi.org/10.48550/arXiv.1502.00046
- Kokje, E., Bindemann, M., & Megreya, A. M. (2018). Cross-race correlations in the abilities to match unfamiliar faces. Acta Psychologica, 185, 13–21. https://doi.org/10.1016/j.actpsy.2018.01.006
- Kramer, R. S. S., Jones, A. L., & Gous, G. (2021). Individual differences in face and voice matching abilities: The relationship between accuracy and consistency. Applied Cognitive Psychology, 35(1), 192–202. https://doi.org/10.1002/acp.3754
- Krishnapriya, K., Vangara, K., King, M. C., Albiero, V., & Bowyer, K. (2019). Characterizing the variability in face recognition accuracy roelative to race. In Proceedings of the IEEE conference on computer vision and pattern recognition (CVPR) workshops (pp. 2278–2285). Long Beach, CA, USA.
- Krizhevsky, A., Sutskever, I., & Hinton, G. E. (2012). Imagenet classification with deep convolutional neural networks. Advances in Neural Information Processing Systems, 25, 1–9.
- Krzanowski, W. J., & Hand, D. J. (2009). ROC curves for continuous data. Chapman and Hall/CRC.
- Laurence, S., Zhou, X., & Mondloch, C. J. (2016). The flip side of the other-race coin: They all look different to me. British Journal of Psychology, 107(2), 374–388. https://doi.org/10.1111/bjop.12147
- Mallick, S., Jeckeln, G., Parde, C. J., Castillo, C. D., & O'Toole, A. J. (2022). The influence of the other-race effect on susceptibility to face morphing attacks. PsyArXiv, https://doi.org/10.48550/arXiv.2204.12591
- Malpass, R. S., & Kravitz, J. (1969). Recognition for faces of own and other race. Journal of Personality and Social Psychology, 13(4), 330–334. https://doi.org/10.1037/h0028434
- McKone, E., Wan, L., Pidcock, M., Crookes, K., Reynolds, K., Dawel, A., Kidd, E., & Fiorentini, C. (2019). A critical period for faces: Other-race face recognition is improved by childhood but not adult social contact. Scientific Reports, 9(1), 1–13. https://doi.org/10.1038/s41598-019-49202-0
- Megreya, A. M., White, D., & Burton, A. M. (2011). The other-race effect does not rely on memory: Evidence from a matching task. Quarterly Journal of Experimental Psychology, 64(8), 1473–1483. https://doi.org/10.1080/17470218.2011.575228
- Meissner, C. A., & Brigham, J. C. (2001). Thirty years of investigating the own-race bias in memory for faces: A meta-analytic review. Psychology, Public Policy, and Law, 7(1), 3–35. https://doi.org/10.1037/1076-8971.7.1.3
- Meissner, C. A., Susa, K. J., & Ross, A. B. (2013). Can I see your passport please? Perceptual discrimination of own- and other-race faces. Visual Cognition, 21(9–10), 1287–1305. https://doi.org/10.1080/13506285.2013.832451
- Ng, H.-W., & Winkler, S. (2014). A data-driven approach to cleaning large face datasets. In IEEE international conference on image processing (pp. 343–347). IEEE.
- Nishimura, Y., Tsuda, H., & Ogawa, H. (2021). Own-race advantage in visual working memory for faces reflects enhanced storage capacity and quick encoding. Japanese Psychological Research. Advance online publication.
- Office for National Statistics. (2021). Population estimates by ethnic group and religion, England and Wales: 2019. https://www.ons.gov.uk/peoplepopulationandcommunity/populationandmigration/populationestimates/articles/populationestimatesbyethnicgroupandreligionenglandandwales/2019.
- Parkhi, O. M., Vedaldi, A., & Zisserman, A. (2015). Deep face recognition. In X. Xie, M. W. Jones, & G. K. L. Tam (Eds.), Proceedings of the British machine vision conference (pp. 41.1–41.12). BMVA Press.
- Phillips, P. J., Beveridge, J. R., Draper, B. A., Givens, G., O'Toole, A. J., Bolme, D., Dunlop, J., Man Lui, Y., Sahibzada, H., & Weimer, S. (2012). The good, the bad, and the ugly face challenge problem. Image and Vision Computing, 30(3), 177–185.
- Phillips, P. J., Jiang, F., Narvekar, A., Ayyad, J., & O’Toole, A. J. (2011). An other-race effect for face recognition algorithms. ACM Transactions on Applied Perception, 8(2), 1–11. https://doi.org/10.1145/1870076.1870082
- Phillips, P. J., Scruggs, W. T., O’Toole, A. J., Flynn, P. J., Bowyer, K. W., Schott, C. L., & Sharpe, M. (2009). FRVT 2006 and ICE 2006 large-scale experimental results. IEEE Transactions on Pattern Analysis and Machine Intelligence, 32(5), 831–846. https://doi.org/10.1109/TPAMI.2009.59
- Proietti, V., Laurence, S., Matthews, C. M., Zhou, X., & Mondloch, C. J. (2019). Attending to identity cues reduces the own-age but not the own-race recognition advantage. Vision Research, 157, 184–191. https://doi.org/10.1016/j.visres.2017.11.010
- Rhodes, G., Brake, S., Taylor, K., & Tan, S. (1989). Expertise and configural coding in face recognition. British Journal of Psychology, 80(3), 313–331. https://doi.org/10.1111/j.2044-8295.1989.tb02323.x
- Ritchie, K. L., & Burton, A. M. (2017). Learning faces from variability. Quarterly Journal of Experimental Psychology, 70(5), 897–905. https://doi.org/10.1080/17470218.2015.1136656
- Ritchie, K. L., Cartledge, C., Growns, B., Yan, A., Wang, Y., Guo, K., Kramer, S. S., Edmond, G., Martire, K. A., San Roque, M., & White, D. (2021). Public attitudes towards the use of automatic facial recognition technology in criminal justice systems around the world. PLoS One, 16(10), e0258241. https://doi.org/10.1371/journal.pone.0258241
- Ritchie, K. L., Kramer, R. S. S., Mileva, M., Sandford, A., & Burton, A. M. (2021). Multiple-image arrays in face matching tasks with and without memory. Cognition, 211, 104632. https://doi.org/10.1016/j.cognition.2021.104632
- Robertson, D. J., Black, J., Chamberlain, B., Megreya, A. M., & Davis, J. P. (2020). Super-recognisers show an advantage for other race face identification. Applied Cognitive Psychology, 34(1), 205–216. https://doi.org/10.1002/acp.3608
- Rodin, M. J. (1987). Who is memorable to whom: A study of cognitive disregard. Social Cognition, 5(2), 144–165. https://doi.org/10.1521/soco.1987.5.2.144
- Singh, B., Mellinger, C., Earls, H. A., Tran, J., Bardsley, B., & Correll, J. (2022). Does cross-race contact improve cross-race face perception? A meta-analysis of the cross-race deficit and contact. Personality and Social Psychology Bulletin, 48(6), 865–887. https://doi.org/10.1177/01461672211024463
- Somai, R. S., & Hancock, P. J. (2022). Exploring perceptual similarity and its relation to image-based spaces: An effect of familiarity. Visual Cognition, 30(7), 443–456.
- Sporer, S. L. (2001). Recognizing faces of other ethnic groups: An integration of theories. Psychology, Public Policy, and Law, 7(1), 36–97. https://doi.org/10.1037/1076-8971.7.1.36
- Stelter, M., & Degner, J. (2018). Investigating the other-race effect in working memory. British Journal of Psychology, 109(4), 777–798. https://doi.org/10.1111/bjop.12304
- Susa, K. J., Gause, C. A., & Dessenberger, S. J. (2019). Matching faces to ID photos: The influence of motivation on cross-race identification. Applied Psychology in Criminal Justice, 15(1), 86–96.
- Towler, A., Keshwa, M., Ton, B., Kemp, R. I., & White, D. (2021). Diagnostic feature training improves face matching accuracy. Journal of Experimental Psychology: Learning, Memory, and Cognition, 47(8), 1288–1298. https://doi.org/10.1037/xlm0000972
- Tüttenberg, S. C., & Wiese, H. (2019). Learning own- and other-race facial identities from natural variability. Quarterly Journal of Experimental Psychology, 72(12), 2788–2800. https://doi.org/10.1177/1747021819859840
- Valentine, T. (1991). A unified account of the effects of distinctiveness, inversion, and race in face recognition. The Quarterly Journal of Experimental Psychology Section A, 43(2), 161–204. https://doi.org/10.1080/14640749108400966
- Yan, X., Andrews, T. J., Jenkins, R., & Young, A. W. (2016). Cross-cultural differences and similarities underlying other-race effects for facial identity and expression. Quarterly Journal of Experimental Psychology, 69(7), 1247–1254. https://doi.org/10.1080/17470218.2016.1146312