
 ?Mathematical formulae have been encoded as MathML and are displayed in this HTML version using MathJax in order to improve their display. Uncheck the box to turn MathJax off. This feature requires Javascript. Click on a formula to zoom.
ABSTRACT
Face detection has been studied by presenting faces in blank displays, object arrays, and real-world scenes. This study investigated whether these display contexts differ in what they can reveal about detection, by comparing frontal-view faces with those shown in profile (Experiment 1), rotated by 90° (Experiment 2), or turned upside-down (Experiment 3). In blank displays, performance for all face conditions was equivalent, whereas upright frontal faces showed a consistent detection advantage in arrays and scenes. Experiment 4 examined which facial characteristics drive this detection advantage by rotating either the internal or external facial features by 90° while the other features remained upright. Faces with rotated internal features were detected as efficiently as their intact frontal counterparts, whereas detection was impaired when external features were rotated. Finally, Experiment 5 applied Voronoi transformations to scenes to confirm that complexity of stimulus displays modulates the detection advantage for upright faces. These experiments demonstrate that context influences what can be learned about the face detection process. In complex visual arrays and natural scenes, detection proceeds more effectively when external facial features are preserved in an upright orientation. These findings are consistent with a cognitive detection template that focuses on general face-shape information.
KEYWORDS:
Human social interaction depends on the detection of other people within the visual field, so that their identity, emotional state and intentions can be determined. The face provides a primary candidate for such person detection. Faces are located rapidly in the visual field (Crouzet et al., Citation2010; Crouzet & Thorpe, Citation2011) and are detected faster than animal faces and non-face objects (e.g., Di Giorgio et al., Citation2012; Maylott et al., Citation2021; Simpson et al., Citation2019; Yang et al., Citation2009). Despite providing much smaller visual cues, faces are also detected as quickly as human bodies, and are fixated preferentially, indicating a prominent role in person perception (Bindemann et al., Citation2010). This efficient detection supports other tasks with faces, too. For example, faces in the visual periphery compete strongly for cognitive resources, such as those necessary for person identification, even when they are task-irrelevant (Bindemann et al., Citation2005; Cerf et al., Citation2009; Jenkins et al., Citation2003; Langton et al., Citation2008).
Some of the visual features that support face detection have now been identified. Detection is most efficient, for example, when faces are presented in veridical skin-colour tones (Bindemann & Burton, Citation2009) and when their height-to-width aspect ratio is preserved (Pongakkasira & Bindemann, Citation2015). These characteristics set detection apart from other tasks with faces, such as recognition, which appears unaffected by geometric distortions of height-to-width ratios (Bindemann et al., Citation2008; Hole et al., Citation2002) and colour removal (Kemp et al., Citation1996; Yip & Sinha, Citation2002).
However, as the study of face detection in psychology has gained momentum, a number of different approaches have emerged to study this process. One approach is to present highly simplified stimulus displays, which comprise of a single cropped face on a blank screen. This approach is dominant in studies examining face perception with neuroscience methods such as EEG and fMRI, where additional visual context can produce noise in the data or induce artefacts (e.g., De Lissa et al., Citation2019; Gao et al., Citation2009; Looser, Guntupalli, & Wheatley, Citation2013; Moulson et al., Citation2011). This approach provides a highly-controlled scenario for studying detection. However, in this setup the problem of face detection may be solved by the mode of presentation itself, as such tasks do not require the localisation of faces across the visual field and their discrimination from competing non-face stimuli. It is therefore unclear whether this situation provides a good proxy for face detection outside of the laboratory or gives rise to distinctly different results.
A different solution is to present faces in photographs of visual scenes (e.g., Bindemann et al., Citation2010; Bindemann & Burton, Citation2009; Burton & Bindemann, Citation2009; Kelly et al., Citation2019). This approach acknowledges that face detection outside of the laboratory requires a search for these targets across the visual field. This search must be able to proceed in many different contexts, which can be variable in terms of their complexity, colour, shape and meaning. By utilising visual scenes for face detection research, it may be possible to draw stronger inferences about the importance of search for face detection in real-world settings, but the complex visual variation that is inherent in such displays also reduces standardisation across stimulus sets.
A third method to study detection is to embed faces in visual arrays, in which a cropped face is presented among a variety of other cropped visual objects (e.g., Hershler & Hochstein, Citation2009; Langton et al., Citation2008; Meissner et al., Citation2018; Ro et al., Citation2007; Simpson et al., Citation2019). These studies provide an intermediate solution between face detection with blank displays and scene images, because the immediately surrounding background for faces is also blank, yet other objects are also presented in the visual display. In comparison to experiments with visual scenes, this might facilitate the parsing of faces from the visual background, shifting the emphasis of the detection process onto general shape information such as the head outline.
As each of these three approaches bears different methodological strengths and weaknesses, the scientific inferences that can be drawn about the facial information that supports detection may also vary across these methods. There is some evidence already to support this reasoning. For example, a detection advantage for faces over non-face objects is not observed when these are presented individually on blank background displays in the visual periphery. A detection advantage for faces emerges, however, when the face and object targets are embedded among other stimuli (Hershler et al., Citation2010). This indicates that the information surrounding a face, and hence the methods that are employed to study face detection, can affect the efficiency with which these stimuli are located.
There is also evidence to suggest that different methodological approaches affect what is detected. Frontal and profile faces, for example, are detected with equal efficiency when these are presented in isolation at the centre of blank displays, but an advantage for frontal faces emerges when these stimuli are located in visual scenes (Burton & Bindemann, Citation2009). It is unresolved, however, whether these findings reflect differences in the search for stimuli, which is minimised when faces are presented centrally and more demanding when they can occur across various onscreen locations, or the search for faces on simple versus more complex background displays.
At present, only limited attempts exist to contrast different approaches to face detection, but understanding how these methods affect performance is imperative to further progress in this field. Contrasting detection with blank displays, visual arrays and scenes allows, for example, for a separation of effects that are caused by the search for faces in complex displays (blank displays versus arrays and scenes) and the parsing of faces from the image background (blank displays and arrays versus scenes). The combination of these methods therefore provides an important route for increasing our understanding of face detection. This study addressed this directly by comparing the detection of faces that are presented in these different display contexts. In each of these tasks, observers were required to detect the presence or absence of a face.
To provide a contrast against which face detection in these conditions could be compared, faces were first shown in a frontal or a profile view. When faces are searched for in visual scenes, profile views are detected less efficiently than frontal views (Burton & Bindemann, Citation2009). However, this difference is not found for stimuli presented at fixation (Bindemann & Lewis, Citation2013). If performance for frontal and profile faces is also comparable when these have to be located in blank displays, then the contrast between these face views can give insight into the role that visual search plays in face detection. In turn, if differences between frontal and profile faces arise in blank, array and scene contexts, then this will speak to the importance of display complexity for understanding face detection.
Experiment 1
This experiment examined the detection of frontal and profile faces when these were shown on blank backgrounds, within an array of objects, or embedded in scenes. If these differences in display complexity influence face detection, then performance should decline as complexity increases. Moreover, if the differences between these display conditions speak to the facial information that is useful for detection, then it should take longer to detect profile faces than frontal faces in scenes (see Bindemann & Lewis, Citation2013; Burton & Bindemann, Citation2009), whereas these face views should be detected with equal proficiency in blank displays (see Bindemann & Lewis, Citation2013; Hershler et al., Citation2010). It is less clear how face view will affect detection in the arrays, which provide an intermediate level of complexity.
Methods
Participants
Forty-three participants completed the experiment (8 male, 33 female, 1 non-binary, 1 undisclosed). A power analysis was conducted with G*Power based on a repeated-measures ANOVA (within-between interaction) with a medium effect size (f = .25, power = .95, number of groups = 1, and number of measurements = 6) and an alpha threshold of p = .05, leading to a suggested sample size of 28. We adopted this as a minimum sample size and advertised the experiment online for 90 min. The final sample of 43 participants represents all the sign-ups that occurred in this time period.
These participants ranged in age from 18 to 39 years, with a mean of 24.1 (SD = 6.5). Participants were recruited from an online participation website (Prolific) and were paid a small fee to take part. All reported normal or corrected-to-normal vision. All experiments in this study were carried out in accordance with the Declaration of Helsinki for experiments involving human participants. In all experiments participants provided informed consent to take part.
Stimuli
The stimuli consisted of frontal and profile views of four female faces and four male faces, resulting in a total set of 16 face images. We presented these stimuli without body cues. Variability in clothing and pose makes bodies poor search targets and, even though bodies occupy more space, face detection is not guided by the body (Bindemann et al., Citation2010). The faces were cropped to remove extraneous background, so that only the internal features of the face, the hair and face outline were visible. Frontal and profile faces were matched in terms of their surface area, by equating the pixel count of these stimuli using the graphics software Photoshop. In addition, 24 images of household objects (e.g., books, clocks, hats) were used as non-face stimuli and were also cropped to remove any background. The same objects were employed in all stimulus displays, but their location was not repeated across the stimulus displays of the array condition. The faces and objects were sized to 2 × 2 cm (76 × 76 pixels at 96 ppi).
In the blank background condition, a single face or object was presented on a white image background subtending 1280 × 806 pixels at 96 ppi. This background was divided into an invisible 6 (w) x 4 (w) grid of 24 equal-sized stimulus locations. The stimuli were rotated around these locations to create a set of 24 face and 24 non-face displays that served as target-present and target-absent trials for the blank condition.
The same 6 × 4 grid was employed in the array and scene conditions to position the faces, so that target location could be fully counterbalanced within and across conditions. In the array condition, 23 of the non-face objects and one face were used to construct a stimulus array in the same 6 × 4 grid. On face-absent trials, these arrays comprised of the 24 non-face objects. Across all stimulus displays, the objects and faces were also rotated around locations so that the same stimulus never appeared twice in the same location in different arrays. In this way, 24 target-present and 24 target-absent displays were created.
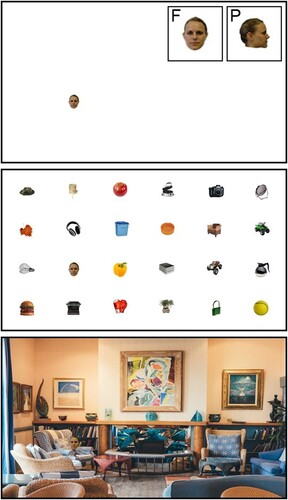
Finally, photographs of 96 scenes depicting settings such as cafes, kitchens and living rooms were employed as stimuli for the scene condition. These scenes were selected so that none displayed people or faces. Half of these scenes served as face-absent trials and did not contain a face. To create face-present scenes, the same faces as in the blank and array conditions were inserted into the remaining scenes, using the 6 × 4 location grid. This also created 24 frontal-face and 24 profile-face displays. An illustration of the blank, array and scene conditions can be viewed in .
Figure 1 . Example stimuli for the blank (top), array (middle) and scene (bottom) conditions, with insets in the blank display illustrating frontal (F) and profile (P) face targets.
All experiments reported here were created using PsychoPy software (Peirce et al., Citation2019), and distributed via pavlovia.org for remote (i.e., online) data collection. Participation in these experiments was restricted to particular devices, so that this could only be conducted on a desktop or laptop computer. The onscreen stimulus dimensions were scaled according to the screen size (height) of these devices and height-to-width ratios remained consistent. For example, on a monitor with the dimensions of 30.5 (w) x 20.3 (h) cm, the stimulus displays would appear at a size of 27.3 × 17.2 cm onscreen. Thus, stimulus display size could vary across participants due to differences in device screen, but the size of the stimuli was consistent across conditions within participants.
Procedure
Each trial began with a fixation cross for 800 milliseconds. This was replaced by a stimulus display, which remained onscreen until a response was registered. Participants were instructed to decide whether a face was present or not in these displays, by pressing “F” on a computer keyboard if they believed a face was present and “J” if they believed there was no face present. The instructions also stated they should respond as quickly and accurately as possible. Participants were informed that faces might appear on a blank background, within an array of objects, or embedded within scenes. However, they were not informed that the faces might appear in frontal or profile view. The three display conditions were administered in blocks of 96 trials, interspersed by short, self-paced breaks. The order of conditions was counterbalanced across participants over the course of the experiment, but trial order was randomised within blocks for each participant by the display software.
Results
Face present versus face absent
Three participants were excluded from the analysis due to accuracy scores (of 73.6%, 75.7% and 74.0%, combined across conditions and tasks) that fell more than two standard deviations below the sample mean (i.e., scoring below 81.8% accuracy). For the remaining participants, the percentage accuracy scores and the mean correct response times for face-present and face-absent trials were calculated for all conditions. In a first step of the analysis, overall performance on face-present trials and face-absent trials for blank, array and scene displays were analysed to determine whether participants were adhering to task demands. Participants were faster to respond on face-present than absent trials in the blank condition (M = 552 ms, SD = 83 vs. M = 585 ms, SD = 84; t(39) = 6.37, p < .001, d = 1.01), the array condition (M = 747 ms, SD = 120 vs. M = 1394 ms, SD = 467; t(39) = 9.59, p < .001, d = 1.52), and the scene displays (M = 838 ms, SD = 128 vs. M = 1927ms, SD = 570; t(39) = 12.52, p < .001, d = 1.98), as the search for faces could be terminated once these targets were found.
In addition, participants were less accurate on face-present trials than face-absent trials in the array condition (M = 94.06%, SD = 6.07 vs. M = 99.27%, SD = 1.30; t(39) = 5.47, p < .001, d = .87), and the scene condition (M = 87.71%, SD = 9.04 vs. M = 99.01%, SD = 1.41; t(39) = 7.94, p < .001, d = 1.26), indicating that they were more likely to miss a face that was present than to detect one where there was none. This pattern was not observed for blank displays (M = 96.20%, SD = 3.92 vs. M = 95.16%, SD = 4.15; t(39) = 1.71, p = .10, d = .27).
Response times
Next, the data of primary interest were analysed, comprising of the median response times for frontal and profile faces in the blank, array and scene conditions. The cross-subject means of these data are summarised in . A 2 (face type: frontal, profile) x 3 (display type: blank, array, scene) repeated-measures ANOVA revealed a main effect of display type, F(2,78) = 206.45, p < .001, ηp2 = .84, and a main effect of face type, F(1,39) = 44.13, p < .001, ηp2 = .53. These effects were qualified by an interaction between these factors, F(2,78) = 34.52, p < .001, ηp2 = .47. Tukey HSD test showed that both frontal and profile faces were detected faster in blank displays than arrays and scenes, all ps < .001. In addition, profile faces were detected faster in arrays than in scenes, p < .001, whereas response times to frontal faces in arrays and scenes were more similar, p = .33. Most importantly, frontal faces were detected more quickly than profile faces in the scene displays, p < .001, but not in blank displays, p = .48, or stimulus arrays, p = .25.
Table 1 . Mean RTs (ms), Accuracy (%) and Inverse Efficiency Scores (IES) for Frontal (F) and Profile (P) Faces in the Blank, Array and Scene Conditions in Experiment 1. Parentheses Show the Standard Deviation of the Mean.
Accuracy
A corresponding ANOVA of response accuracy also revealed main effects of display type, F(2,78) = 23.21, p < .001, ηp2 = .37, and face type, F(1,39) = 36.22, p < .001, ηp2 = .48, and an interaction between factors, F(2,78) = 14.42, p < .001, ηp2 = 0.27. Tukey HSD tests showed that frontal faces were detected with similar accuracy across the blank, array and scene conditions, all ps .11. Profile faces were detected more accurately in blank displays than in the array and scene conditions, both ps < .05, and detected more accurately in array than scene displays, p < .001. These data correspond with response times in that accuracy was higher for frontal faces than profile faces with scene displays, p < .001, but not blank displays, p = 1.00, or arrays, p = .51.
Inverse efficiency scores
In addition, inverse efficiency scores (IES) were calculated to consider speed-accuracy trade-offs, by dividing reaction times by the proportion of correct responses. Higher IES indicate longer detection times when the proportion of errors is taken into account. A repeated-measures ANOVA of these data revealed main effects of display type, F(2,78) = 173.41, p < .001, ηp2 = .82, and face type, F(1,39) = 67.91, p < .001, ηp2 = .64, and an interaction between factors, F(2,78) = 63.30, p < .001, ηp2 = 0.62. Tukey HSD tests showed that both frontal and profile faces were detected more efficiently in blank displays than arrays and scenes, all ps < .001, and in arrays than in scenes, ps < .03. Moreover, detection of frontal and profile faces was similar in blank displays, p = .61, whereas frontal faces were detected more efficiently than profile faces in both arrays and scenes, ps < .001.
Discussion
Experiment 1 demonstrates that the search for faces was slower and less accurate in complex scenes than arrays and blank displays. Moreover, detection of frontal and profile faces was comparable with blank displays and arrays, while a clear detection advantage for frontal over profile face views was found when these stimuli were embedded in scenes. A similar effect was also observed in inverse efficiency scores for arrays, but this was attenuated in accuracy and response times. These findings provide initial evidence that the efficiency of face detection is affected by the type of display that is used. Moreover, the three display types under investigation differed also in what they revealed about the properties of detection. The scene displays show, for example, that frontal faces possess an advantage for fast and accurate detection over profile faces, which could suggest that cognitive templates for face detection might be tuned preferentially to frontal views, whereas the blank displays do not reveal such differences.
Experiment 2
Experiment 2 was conducted to replicate the main findings of Experiment 1, whilst also controlling for differences between the face conditions. Whereas the detection of profile faces was slower than that of frontal faces in scenes in Experiment 1, these face stimuli differed in several characteristics, such as the visibility of internal features (e.g., one eye in profile view versus a pair of eyes in frontal view) and the shape of the head outline. In Experiment 2, the profile faces were therefore replaced with versions of the frontal faces that were rotated by 90°. These rotated stimuli provide the same low-level visual energies, internal features and face outline as their upright counterparts, but in an orientation in which faces are encountered less frequently outside of the laboratory. If cognitive detection templates for face detection are sensitive to these differences, and the display conditions differ in the extent to which this sensitivity can be revealed, then these upright and rotated face conditions should replicate the pattern observed in Experiment 1.
Methods
Participants, stimuli and procedure
Thirty undergraduate students from the University of Kent participated in the experiment for course credit. An additional 20 participants were recruited from an online participation website (Prolific) and were paid a small fee to take part. As in Experiment 1, power analysis with G*Power based on a repeated-measures ANOVA (within-between interaction) with a medium effect size (f = .25, power = .95, number of groups = 1, and number of measurements = 6) and an alpha threshold of p = .05 suggested a minimum sample size of 28. For consistency with Experiment 1, we continued to advertise the experiment until the same final sample size of 40 was matched. The same approach was adopted in all subsequent experiments reported here. Participants (12 male, 38 female) ranged in age from 18 to 49 years, with a mean of 25.6 (SD = 9.2). All reported normal or corrected-to-normal vision. The stimuli and procedure were identical to Experiment 1, except that the profile face conditions were replaced by copies of the frontal faces that were rotated 90° clockwise. Thus, the upright and rotated face conditions were identical except for the orientation of these targets.
Results
Face present versus face absent
Three participants were excluded from the analysis due to accuracy scores (of 47.6%, 63.2% and 65.6%, combined across conditions and tasks) that fell more than two standard deviations below the sample mean (i.e., scoring below 69.7% accuracy). For the remaining participants, the percentage accuracy scores and the median correct response times for face-present and face-absent trials were calculated for blank, array and scene displays to determine whether participants were adhering to task demands. Participants were faster to respond on face-present than absent trials in the blank condition (M = 559 ms, SD = 98 vs. M = 609 ms, SD = 103; t(46) = 9.02, p < .001, d = 1.32), the array condition (M = 832 ms, SD = 158 vs. M = 1518 ms, SD = 603; t(46) = 9.01, p < .001, d = 1.31), and the scene displays (M = 882 ms, SD = 188 vs. M = 1967ms, SD = 1103; t(46) = 7.32, p < .001, d = 1.07), as the search for faces could be terminated once these targets were found.
In addition, participants were less accurate on face-present than face-absent trials in the array condition (M = 88.79%, SD = 11.07 vs. M = 98.05%, SD = 4.31; t(46) = 6.50, p < .001, d = .95), and the scene condition (M = 86.13%, SD = 14.28 vs. M = 96.68%, SD = 7.74; t(46) = 6.21, p < .001, d = .91), indicating that they were more likely to miss a face what was present than to detect one where there was none. This effect was not observed for blank displays (M = 95.08%, SD = 6.62 vs. M = 94.15%, SD = 7.90; t(46) = 1.22, p = .23, d = .18).
Response times
The data of primary interest consisted of the median response times for upright and rotated faces in the three display conditions. The cross-subject means of these data are illustrated in . A 2 (face type: upright, rotated) x 3 (display type: blank, array, scene) repeated-measures ANOVA showed a main effect of face type, F(1,46) = 79.03, p < .001, ηp2 = .63, a main effect of display type, F(2,92) = 135.71, p < .001, ηp2 = .75, and an interaction between these factors, F(2,92) = 21.39, p < .001, ηp2 = .32. Tukey HSD test showed that both upright and rotated faces were detected faster in blank displays than in arrays and scenes, both ps < .001, and as quickly in arrays as in scenes, ps > .25. Importantly, upright faces were detected faster than rotated faces in arrays, p < .001, and scenes, p < .001, whereas detection of upright and rotated faces was comparable with blank displays, p = .99.
Table 2 . Mean RTs (ms), Accuracy (%) and IES for Upright (U) and Rotated (R) Faces in the Blank, Array and Scene Conditions in Experiment 2. Parentheses Show the Standard Deviation of the Mean.
Accuracy
For accuracy, a 2 (face type) x 3 (display) ANOVA also revealed main effects of face type, F(1,46) = 52.32, p < .001, ηp2 = .53, and display type, F(2,92) = 19.68, p < .001, ηp2 = .30, and an interaction between these factors, F(2,92) = 10.34, p < .001, ηp2 = .18. Tukey HSD tests showed that rotated faces were detected more accurately in blank displays than in arrays and scenes, ps < .001, but as quickly in arrays as in scenes, p = .91. Upright faces were also detected more accurately in blank displays than in scenes, p = .007, but accuracy was similar for blank displays compared with arrays, p = .41, and for arrays compared with scenes, p = .02. However, upright faces were detected more accurately than rotated faces in arrays, p < .001, and in scenes, p = .001, but detection of upright and rotated faces was comparable in blank displays, p = .40.
Inverse efficiency scores
IES also revealed main effects of display type, F(2,92) = 110.87, p < .001, ηp2 = .71, and face type, F(1,46) = 50.45, p < .001, ηp2 = .52, and an interaction between factors, F(2,92) = 19.84, p < .001, ηp2 = 0.30. Tukey HSD test showed that both upright and rotated faces were detected more efficiently in blank displays than arrays and scenes, all ps < .001. Upright faces were also detected faster in arrays than scenes, p = .01, but this was not found for rotated faces, p = .17. More importantly, the detection of upright and rotated faces was comparable in blank displays, p = .92, whereas upright faces were detected faster than rotated faces in both arrays and scenes, ps < .001.
Discussion
This experiment replicated the important aspects of Experiment 1 with upright and rotated faces. The longest response times and lowest face detection accuracy were again observed in the scene condition in comparison to arrays and blank displays, indicating that the search for faces becomes more challenging in more complex displays. Once again, these different contexts also affected face detection, whereby upright and rotated faces were detected with equal efficiency in blank displays, but upright faces were detected more effectively in scenes than their rotated counterparts.
The advantage for upright faces was also observed in the array condition of Experiment 2. This differs from Experiment 1, where the corresponding difference between frontal and profile faces was attenuated in accuracy and RTs, and only present when these scores were combined as inverse efficiency scores. This difference could be explained in terms of the parsing of faces from the visual background in blank and array displays compared to scenes. Face detection in arrays and blank displays might predominantly reflect processing of external face shape information such as head outline, which could be harder to distinguish in complex scene contexts that wrap tightly around the face stimuli. This could lead to comparable detection of frontal and profile faces in arrays but not scenes, where other visual information also has to be used in order to detect faces. However, whereas both frontal and profile faces are encountered routinely in our daily lives, rotated faces represent a more unusual portrayal and may therefore not present external shape information that is as useful as that of upright and profile faces in visual arrays. This might explain why frontal and profile views are detected equally well in arrays, whereas frontal and rotated faces are not.
Overall, these results are consistent with the notion that face detection operates differently across different display types and, in turn, that this influences what these paradigms can reveal about the detection process. This experiment indicates that search for faces in more complex visual displays such as arrays and scenes is sensitive to the orientation of a face.
Experiment 3
Experiment 2 showed that detection is sensitive to the orientation of a face when this requires search in arrays and scenes. Experiment 3 examined further which aspects of a face might drive this effect. The rotated faces that were employed in Experiment 2 differed from upright faces in a number of ways, for example, by changing the height-to-width ratio of the stimuli relative to the upright scene context, which influences face detection (see Pongakkasira & Bindemann, Citation2015). In order to extend the range of stimuli with which to compare upright faces, this experiment examined whether the inversion of faces produces similar effects on detection. This manipulation exerts strong effects on other tasks with faces, such as recognition (Farah et al., Citation1995; Valentine, Citation1988; Yin, Citation1969). In contrast, inversion appears to produce mixed results in tasks that require face detection. In simple visual displays, inverted faces appear to be detected as efficiently as upright faces (see Bindemann & Burton, Citation2008), which might occur because inverted faces also retain the height-to-width ratio of upright faces and some feature arrangements (e.g., a horizontal pair of eyes). On the other hand, detection performance appears to decline with inversion in more complex displays, such as picture grids that are searched for a face target (Lewis & Edmonds, Citation2003). Here, we ask whether inverted faces are detected as efficiently as upright faces in arrays and scenes, or whether they produce decrements in detection performance similar to those produced by profile and rotated faces.
Methods
Participants, stimuli and procedure
Forty-five participants completed the experiment (25 male, 18, female, 1 non-binary, 1 undisclosed). Participants ranged in age from 18 to 40 years, with a mean of 27.8 (SD = 6.0). Participants were recruited from an online participation website (Prolific) and were paid a small fee to take part. All reported normal or corrected-to-normal vision. The stimuli and procedure were identical to the previous experiment except that faces rotated by 90° were now replaced with inverted faces (i.e., faces rotated by 180°)
Results
Face present versus face absent
One participant was excluded from the analysis due to accuracy scores of 1.4% (combined across conditions and tasks), which fell more than two standard deviations below the sample mean (i.e., scoring below 64.3% accuracy). For the remaining participants, the percentage accuracy scores and the correct response times for face-present and face-absent trials were calculated for blank, array and scene displays. Once again, participants were faster to respond on face-present than absent trials in blank condition (M = 563 ms, SD = 87 vs. M = 600 ms, SD = 87; t(43) = 7.29, p < .001, d = 1.10), the array condition (M = 833 ms, SD = 131 vs. M = 1550 ms, SD = 449; t(43) = 11.65, p < .001, d = 1.76), and the scene displays (M = 871 ms, SD = 140 vs. M = 1879 ms, SD = 711; t(43) = 10.61, p < .001, d = 1.60).
In addition, participants were less accurate on face-present trials than face-absent trials in the array condition (M = 93.27%, SD = 8.84 vs. M = 99.10%, SD = 1.30; t(43) = 4.36, p < .001, d = .66), and the scene condition (M = 87.36%, SD = 11.56 vs. M = 98.77%, SD = 1.41; t(43) = 6.58, p < .001, d = .99), but not in blank displays, (M = 96.63%, SD = 2.78 vs. M = 96.26%, SD = 3.75; t(43) = .61, p = .55, d = .09).
Response times
The data of primary interest were the response times for upright and inverted faces in the three display conditions. These are shown in . A 2 (face type: upright, inverted) x 3 (display type: blank, array, scene) repeated-measures ANOVA showed main effects of face type, F(1,43) = 95.71, p < .001, ηp2 = .69, and display type, F(2,86) = 234.82, p < .001, ηp2 = .85, and an interaction between these factors, F(2,86) = 25.14, p < .001, ηp2 = .37. Tukey HSD tests showed that upright and inverted faces were detected faster in blank displays than in arrays and scenes, all ps < .001. However, there was no difference in detection between arrays and scenes for either of these face types, both ps > .06. The comparisons of main interest showed that upright faces were detected more quickly than inverted faces in arrays, p < .001, and in scenes, p < .001, whereas detection of upright and inverted faces was comparable in blank displays, p = .31.
Table 3 . Mean RTs (ms), Accuracy (%) and IES for Upright (U) and Inverted (I) Faces in the Blank, Array and Scene Conditions in Experiment 3. Parentheses Show the Standard Deviation of the Mean.
Accuracy
An analogous ANOVA for response accuracy also showed main effects of face type, F(1,43) = 25.45, p < .001, ηp2 = .37, and display type, F(2,86) = 19.78, p < .001, ηp2 = .32, and an interaction between these factors, F(2,86) = 5.03, p = .009, ηp2 = .10. Tukey HSD tests showed that inverted faces were detected more accurately in blank displays than in arrays and scenes, all ps < .03. Upright faces were detected more accurately in blank displays than scenes, p < .001, but there was no difference for this face type between blank displays and arrays, p = .90. Accuracy for both upright and inverted faces was higher in arrays than scenes, ps < .05. Furthermore, the detection accuracy for upright and inverted faces was comparable in blank displays, p = .98, but was higher for upright faces than inverted faces in arrays, p = .001, and in scenes, p = .02.
Inverse efficiency scores
IES also revealed main effects of display type, F(2,86) = 83.32, p < .001, ηp2 = .66, and face type, F(1,43) = 53.12, p < .001, ηp2 = .55, and an interaction between factors, F(2,86) = 18.68, p < .001, ηp2 = .30. Tukey HSD tests showed that both upright and inverted faces were detected more efficiently in blank displays than arrays and scenes, all ps < .001. Inverted faces were also detected more efficiently in arrays than scenes, p = .004, but this was not found for upright faces, p = .50. Consistent with the response time and accuracy data, detection of upright and inverted faces was similar in blank displays, p = .35, whereas frontal faces were detected more efficiently than profile faces in both arrays and scenes, ps < .001.
Discussion
In Experiment 3, the detection of upright frontal faces was faster and more accurate than that of inverted faces in arrays and scenes, but not in blank displays. These inverted stimuli retain the height-to-width aspect ratio of upright faces, as well as the arrangement of some internal features (e.g., a pair of eyes). Despite this, detection was impaired, implying that upright face detection cannot be based solely on these facial characteristics – if it was, then upright and inverted face detection performance would be equivalent.
These results strengthen the case that presenting faces on blank backgrounds utilises different processes for detection than the search for faces in arrays and scenes. On blank backgrounds, profile faces (Experiment 1), rotated faces (Experiment 2) and inverted faces (Experiment 3) were classified as effectively as frontal faces. This indicates that under these circumstances, performance is driven by general detection processes common to both faces and objects, rather than a mechanism that operates on identifying specific facial properties. In arrays and scenes, on the other hand, differences between these face conditions emerge, pointing to cognitive face detection mechanisms that are tuned preferentially to upright frontal faces.
We now turn to the question of which facial aspects drive these detection effects, by utilising the contrast between the display conditions. In the face perception literature, a distinction is often made between the contribution of internal facial features (such as the eyes, nose and mouth) and external facial features (such as hair and face outline) to face identification (e.g., Ellis et al., Citation1979; Moscovitch & Moscovitch, Citation2000; Nachson & Shechory, Citation2002; Young et al., Citation1985). In the profile, rotated and inverted face conditions that were employed in Experiments 1–3, the internal and external features were manipulated simultaneously. In the next experiment, we examine the contribution of both types of features to detection by manipulating internal and external face information independently.
Experiment 4
In this experiment, the design of the preceding experiments was retained, by contrasting face detection in blank displays, arrays and scenes. However, the internal and external facial features were now manipulated independently. Each of these features contributes to face detection when these are presented individually in search arrays (see Experiment 5 in Hershler & Hochstein, Citation2005), but here we examined which of these contributes more strongly to face detection by manipulating one set of features whilst preserving the other. This was achieved by rotating the internal features of frontal faces through 90° while the external features remained in an upright orientation, or by rotating the external features while retaining an upright orientation for internal features. The detection of these hybrid-feature faces was compared with upright frontal faces in which the orientation of both internal and external features was preserved. If the internal or external features contribute more strongly to face detection, then the faces in which these features are preserved in their original orientation should perform more similarly to upright faces when these are embedded in arrays and scenes.
Methods
Participants
Forty-six participants completed the experiment (17 male, 26 female, 3 non-binary). Participants’ ages ranged from 18 to 40 years, with a mean of 27.6 (SD = 6.4). Participants were recruited via Prolific and were paid a small fee to take part.
Stimuli and procedure
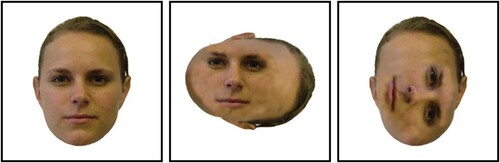
The stimuli and procedure were identical to the preceding experiments, except for the following changes. As in Experiments 1–3, the stimuli for the upright condition consisted of frontal views of four female and four male faces. Each of these faces was then manipulated in graphics software (Adobe Photoshop) so that either the internal or external features were rotated clockwise through 90°, while the other feature set remained in an upright orientation. An example of these stimuli can be viewed in .
Figure 2 . Illustration of the stimuli for Experiment 4, showing a face that is intact and upright (left), with internal-upright features (middle), and with external-upright features (right).
In the experiment, each participant completed 432 trials, comprising of 72 target-present and 72 target-absent trials in the blank, array and scene conditions. These trials were subdivided further for each face condition, into 24 upright face trials, 24 external-upright face trials (i.e., with internal features rotated 90°), and 24 internal-upright trials (i.e., with external features rotated 90°). As in previous experiments, the display conditions were blocked, but trial order was randomised within blocks. Participants were given a break after each block of 144 trials.
Results
Face present versus face absent
Two participants were excluded from the analysis due to accuracy scores of 5.1% and 39.4% (combined across conditions and tasks), which fell more than two standard deviations below the sample mean (i.e., scoring below 60.8% accuracy). For the remaining participants, the percentage accuracy scores and the correct response times for face-present and face-absent trials were calculated for blank, array and scene displays to determine whether participants were adhering to task demands. Participants were faster to respond on face-present than absent trials in the array condition (M = 826 ms, SD = 106 vs. M = 1658 ms, SD = 543; t(43) = 10.75, p < .001, d = 1.62), and the scene displays (M = 864 ms, SD = 140 vs. M = 2068ms, SD = 948; t(39) = 8.89, p < .001, d = 1.34), but not in the blank display condition (M = 601 ms, SD = 92 vs. M = 607 ms, SD = 79; t(43) = .88, p = .38, d = .13).
In addition, participants were less accurate on face-present than face-absent trials in the array condition (M = 94.03%, SD = 8.53 vs. M = 98.90%, SD = 3.49; t(43) = 5.61, p < .001, d = .85), and the scene condition (M = 91.35%, SD = 7.28 vs. M = 98.96%, SD = 1.34; t(43) = 7.02, p < .001, d = 1.06), but not the blank condition, (M = 95.96%, SD = 6.51 vs. M = 97.03%, SD = 3.46; t(43) = 1.03, p = .31, d = .16).
Response times
Next, the response times for correct target-present trials were analysed for the experimental conditions (see ). A 3 (face type: upright, external-upright, internal-upright) x 3 (display type: blank, array, scene) repeated-measures ANOVA revealed main effects of face type, F(2,86) = 95.03, p < .001, ηp2 = .69, and display type, F(2,86) = 113.13, p < .001, ηp2 = .72, and an interaction between these factors, F(4,172) = 9.71, p < .001, ηp2 = .18. Tukey HSD tests showed that upright, external-upright and internal-upright faces were detected faster in blank displays than in both arrays and scenes, all ps < .001. However, there was no difference in detection speed between arrays and scenes in all face type conditions, ps .33. Additionally, upright, internal-upright, and external-upright faces were detected with similar speed in blank displays ps
.29. In contrast, both upright faces and external-upright faces were detected faster than internal-upright faces in arrays and scenes, all ps < .001, whereas detection was similar for upright faces and external-upright faces in these display conditions, both ps = 1.00.
Table 4 . Mean RTs (ms), Accuracy (%) and IES for Upright (U), External-upright (E), and Internal-upright Faces (I) in the Blank, Array and Scene Conditions in Experiment 4. Parentheses Show the Standard Deviation of the Mean.
Accuracy
The accuracy data followed a similar pattern. A 3 (face type) x 3 (display type) ANOVA revealed main effects of face type, F(2,86) = 20.65, p < .001, ηp2 = .32, and display type, F(2,86) = 6.45, p = .002, ηp2 = .13, and an interaction between these factors, F(4,172) = 10.15, p < .001, ηp2 = .19. Tukey HSD tests showed that upright and internal-upright faces were detected more accurately in blank displays than in scenes, ps < .007, but not in arrays, ps > .14. External-upright faces were detected with similar accuracy levels across all three display conditions, ps = 1.00. In addition, accuracy was similar across the three face conditions in blank displays, all ps .62. In the arrays, upright faces were detected more accurately than internal-upright displays, p = .004, whereas detection accuracy was similar for the upright and external-upright conditions, p = .94, and for the internal-upright and external-upright conditions, p = .07. Finally, in the scene conditions, external-upright faces were detected more accurately than upright and internal-upright faces, both ps < .007, and upright faces were also detected more accurately than internal-upright faces, p < .003.
Inverse efficiency scores
IES also revealed main effects of face type, F(2,86) = 32.76, p < .001, ηp2 = .43, and display type, F(2,86) = 51.37, p < .001, ηp2 = .54, and an interaction between factors, F(4,172) = 6.72, p < .001, ηp2 = 0.14. Tukey HSD tests showed that upright, external-upright and internal-upright faces were detected more efficiently in blank displays than in arrays and scenes, all ps < .007, upright faces were detected more efficiently in arrays than scenes, p = .02, where there was no difference between arrays and scenes for internal-upright and internal-upright faces, ps .71.
The primary interest was the comparison of face types for each display condition. The detection of upright, internal-upright, and external-upright faces was similar in blank displays, ps .33, as well as in for internal-upright and external-upright in the array conditions, ps
.18. In contrast, both upright faces and external-upright faces were detected faster than internal-upright faces in scenes, all ps < .001, and upright faces were detected faster than internal-upright faces in array conditions p < .001, whereas detection was similar for upright faces and external-upright faces in arrays and scenes display conditions, p = .88.
Discussion
This experiment shows that internal and external features exert distinct effects on face detection in visual arrays and real-world scenes. Detection was delayed and less accurate when the external features of a face were rotated by 90° while the internal features remained upright, whereas a similar decrement in performance was not observed when rotated internal features were presented in the context of upright external features. Moreover, the detection of faces in which the orientation of external features was preserved was as fast and (more) accurate than intact faces, in which internal and external features were presented in their typical arrangement. These results indicate that external facial information is sufficient for effective face detection, and that the inclusion of upright internal features does not confer any additional benefits for detection.
Experiment 5
The previous experiments indicate that face detection is modulated by visual context. Blank, array and scene displays vary in visual complexity, and face perception differed across these contexts, indicating that this is a key component of detection. However, there are many differences between these visual displays. This final experiment therefore examines the impact of visual complexity on face detection more systematically, by manipulating the content of the natural scenes using Voronoi tessellation. In this method, also referred to as Thiessen polygons, visual displays are transformed into a honeycomb lattice of smaller cells that summarize colour information across a region of an image. By controlling the level of tessellation, the complexity of an image can be systematically manipulated. In Experiment 5, this technique was employed to determine how complexity affects face detection. For this purpose, we reverted to the upright and inverted face stimuli, as these produced clearer differences across different background conditions than frontal and profile views (c.f., Experiment 1 and 2). The detection of upright and inverted faces was then measured with the intact scenes employed in Experiment 1–4, and this was compared with Voronoi versions of these scenes in which complexity is gradually reduced. Based on the results of Experiments 1–4, detection of upright faces was expected to be more efficient than that of their inverted counterparts in intact scenes. This difference should attenuate as the complexity of Voronoi scenes decreases.
Methods
Participants
Forty-one undergraduate students from the University of Kent participated in the experiment for course credit. Participants (8 male, 33 female) ranged in age from 18 to 38 years, with a mean of 19.97 (SD = 3.38). All reported normal or corrected-to-normal vision.
Stimuli
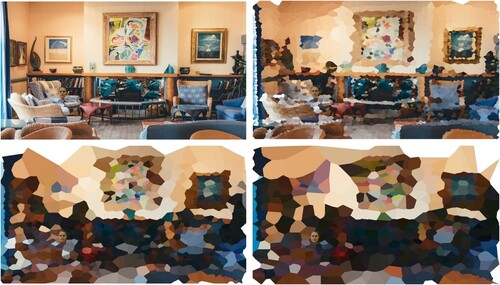
The 96 naturalistic scenes from the previous experiments were also employed as scene stimuli here, and were sized to the same dimensions of 1280 × 806 pixels at 96 ppi. These stimuli were then processed with a MATLAB script to create three different levels of Voronoi tessellation resulting in scenes of low, medium and high visual complexity (see https://uk.mathworks.com/matlabcentral/fileexchange/130299-im2voronoi, using filter settings of 25, 15 and 5). An example of this manipulation is illustrated in and shows how scene complexity is reduced gradually across Voronoi levels. The same upright and inverted faces as in Experiment 3 were then placed onto each scene in the same positions as in Experiments 1–4.
Figure 3 . Illustration of the stimuli for Experiment 5, showing an upright face on an original, unfiltered scene (top left), and scenes of high (top right), medium (bottom left) and low complexity (bottom right).
Procedure
As in the previous experiment, each trial began with an 800 ms fixation cross, followed by a stimulus display, which would remain onscreen until a response was registered by pressing “F” for face present or “J” for absent. Participants were instructed to respond as quickly and accurately as possible but were not informed about the orientation of the faces.
In this manner, each participant completed a total of 192 trials, comprising of two blocks of 96 trials. In the first block, each scene was only shown once, in either the face-present (48 trials) or face-absent conditions (48 trials). In addition, scene complexity was manipulated systematically within blocks, so that 25% of trials depicted original scenes or high, medium and low complexity Voronoi scenes, respectively. The second block was structured in the same way, except that each scene was presented in a different complexity condition. However, over the course of the experiment, the frequency with which each scene appeared in any of the complexity conditions was counterbalanced across participants. Finally, the trial order was randomised for each participant within each block.
Results
Face present versus face absent
One participant was excluded from the analysis due to an accuracy score of 53.13% (combined across conditions and tasks) that fell more than two standard deviations below the overall sample mean (i.e., scoring below 77.9% accuracy). For the remaining participants, the percentage accuracy scores and the mean correct response times for face-present and face-absent trials were calculated for all conditions.
In the first step of the analysis, overall performance on face-present trials and face-absent trials for blank, array and scene displays were analysed to determine whether participants were adhering to task demands. Participants were faster to respond on face-present than face-absent trials in the original scenes (M = 841 ms, SD = 192 vs. M = 1496 ms, SD = 675; t(39) = 6.88, p < .001, d = 1.09), and across the high (M = 731 ms, SD = 129 vs. M = 1015 ms, SD = 296; t(39) = 7.90, p < .001, d = 1.25), medium (M = 644 ms, SD = 102 vs. M = 841 ms, SD = 204; t(39) = 7.39, p < .001, d = 1.17), and low visual complexity Voronoi conditions (M = 625 ms, SD = 116 vs. M = 765 ms, SD = 171; t(39) = 6.97, p < .001, d = 1.10).
In addition, participants were less accurate on face-present than face-absent trials in the original scenes (M = 85.73%, SD = 14.18 vs. M = 97.29%, SD = 4.38; t(39) = 5.56, p < .001, d = .88), and the high (M = 85.42%, SD = 10.42 vs. M = 98.02%, SD = 3.28; t(39) = 7.45, p < .001, d = 1.18) and medium complexity Voronoi conditions (M = 93.85%, SD = 5.74 vs. M = 97.40%, SD = 3.85; t(39) = 4.79, p < .001, d = .76). In contrast, accuracy was comparable for face-present and face-absent scenes in the low complexity Voronoi condition (M = 96.98%, SD = 4.62 vs. M = 98.33%, SD = 2.95; t(39) = 1.65, p = .11, d = .26).
Response times
The median correct response times were analysed next and are displayed in . A 2 (face type: upright, inverted) x 4 (scene complexity: original, high, medium, low) repeated-measures ANOVA of these data revealed an effect of face type, F(1,39) = 29.33, p < .001, ηp2 = .43, and an effect of scene complexity, F(3,117) = 58.75, p < .001, ηp2 = .60. This was qualified by an interaction between face type and Voronoi level, F(3,117) = 13.03, p < .001, ηp2 = .25.
Table 5 . Mean RTs (ms), Accuracy (%) and IES for Upright (U) and Inverted (I) Faces at Original, High, Medium and Low Voronoi scenes in Experiment 5. Parentheses Show the Standard Deviation of the Mean.
Tukey HSD tests showed that both upright and inverted faces were detected more slowly as scene complexity increased across all possible comparisons between conditions, all ps < .05, but for three exceptions. Upright faces were detected with similar speed in the original and high complexity scenes, p = .79. Similarly, upright and inverted faces were detected with similar speed in low and medium complexity Voronoi scenes, both ps .39.
Of primary interest were the comparisons between upright and inverted faces at each level of scene complexity. These showed that upright faces were detected faster than inverted faces in the original scenes, p < .001, and in the medium complexity Voronoi scenes, p = .007. In contrast, upright and inverted faces were detected with similar speed in the high and low complexity Voronoi scenes, both ps .99.
Accuracy
A corresponding ANOVA of response accuracy also revealed main effects of face type, F(1,39) = 11.03, p = .002, ηp2 = .22, scene complexity, F(3,117) = 23.61, p < .001, ηp2 = .38, and an interaction between these factors, F(3,117) = 4.69, p = .004, ηp2 = .11. Tukey HSD test showed that accuracy for upright faces was similar across comparisons of scene complexity, all ps .11, except for decreased accuracy in the high than in either the medium or low complexity Voronoi scenes, both ps < .05. Similarly, detection accuracy for inverted faces was comparable between the original and high complexity Voronoi scenes, and between the medium and low complexity Voronoi scenes, p
.12. There was lower detection accuracy with original and high complexity scenes than with either medium or low complexity scenes, all ps < .001.
The primary interest again comprised of the comparisons between upright and inverted faces at each level of scene complexity. These showed that upright faces were detected more accurately than inverted faces in the original scenes, p < .001, whereas accuracy was comparable for upright and inverted faces in the high, medium and low complexity Voronoi conditions, all ps .48.
Inverse efficiency scores
Consistent with the response time and accuracy data, IES also showed main effects of face type, F(1,39) = 34.56, p < .001, ηp2 = .47, scene complexity, F(3,117) = 47.56, p < .001, ηp2 = .55, and an interaction, F(3,117) = 19.06, p < .001, ηp2 = 0.33. Tukey HSD tests showed that the IES pattern followed response times closely. Thus, both upright and inverted faces were detected less efficiently as scene complexity increased across all possible comparisons between conditions, all ps < .001, but for three exceptions. Upright faces were detected with similar efficiency in the original and high complexity scenes, p = 1.00. Similarly, upright and inverted faces were detected with similar efficiency in low and medium complexity Voronoi scenes, both ps .09.
Direct comparisons between upright and inverted faces showed that upright faces were detected more efficiently than inverted faces in the original scenes, p < .001, and medium complexity Voronoi scenes, p = .02. In contrast, upright and inverted faces were detected with similar efficiency in high and low complexity Voronoi scenes, both ps .99.
Discussion
This experiment shows that faces are located more slowly and less accurately in natural scenes than in Voronoi-filtered images in which scene complexity has been reduced. Importantly, this affects the visual information that is utilised for detection, as upright and inverted faces were detected with similar speed and accuracy in scenes of low complexity. In contrast, upright faces demonstrated a clear detection advantage over inverted faces in more complex scenes. These effects were most pronounced when the original scenes were compared with the least detailed Voronoi images, with intermediate levels of Voronoi tessellation producing more mixed results. These findings converge with the preceding experiments, by demonstrating that face detection becomes more challenging as a function of the complexity of the context within which faces are presented. By studying face detection in more complex stimulus displays, it becomes possible to dissociate the detection of different face stimuli (e.g., upright versus inverted faces). This reveals the facial characteristics that are most useful for detection.
General discussion
This research shows that face detection draws on different processes depending on the visual context in which faces are viewed. Across five experiments, detection was fastest, most accurate and unaffected by changes in view, rotation and inversion when faces were presented in visual displays that were otherwise blank (Experiment 1–4) or of greatly reduced complexity (Experiment 5). These findings converge with other studies that show that face and non-face objects are detected with equal efficiency under similar conditions (Hershler et al., Citation2010) and indicate that the problem of face detection is solved by the mode of presentation itself in blank displays, whereby stimuli are located quickly irrespective of their appearance.
A different pattern emerged with visual arrays and scenes, both of which gave rise to slower detection performance and more detection errors than blank displays. Most importantly, detection in these displays was consistently sensitive to differences in facial information, with frontal faces outperforming profile faces (Experiment 1), and upright faces outperforming faces that were rotated through 90° or inverted (Experiments 2, 3 and 5). These findings provide evidence that the context in which faces are presented not only affects the efficiency of the detection process, but that it can also provide insight into the stimulus characteristics that are important for detection.
In Experiment 4, we explored this directly by investigating whether the internal or external features are particularly important for face detection in complex contexts. Faces in which the internal features were rotated by 90° while the external features remained upright were detected as quickly, and even more accurately, than intact upright frontal faces. In contrast, detection performance declined when internal features remained upright and external features were rotated. The differences between these conditions indicate that cognitive templates for face detection are not tuned strongly to the internal features of faces, but rely more on information such as the head outline and general face-shape. This explanation converges with other studies that demonstrate that detection is impaired by geometric distortions of face shape (Pongakkasira & Bindemann, Citation2015), when faces are presented partially (Burton & Bindemann, Citation2009), or in unnatural colour tones (Bindemann & Burton, Citation2009; Prunty et al., Citation2023 ).
This reasoning gains further traction when considering that the challenge of face detection is to find faces that appear in the visual periphery, outside of foveal vision, where faces appear to have a particularly strong detection advantage (Hershler et al., Citation2010). The detail of internal facial features may be difficult to resolve with the loss of acuity in the human visual field that such eccentric presentations entails (see, e.g., Burton et al., Citation2009; Rousselet et al., Citation2005). This should shift the emphasis of cognitive detection templates towards information that remains accessible even under lowered resolution, such as a general face shape.
This reasoning could also be reconciled with the detection disadvantage for profile faces in Experiment 1 (see also Bindemann & Lewis, Citation2013; Burton & Bindemann, Citation2009), which provide different shape information due to the intrusion of the hair region in this view and a different face outline. This could also explain why similar detection performance was obtained for internal and external face regions in other studies (see Hershler & Hochstein, Citation2005), where the faces in both of these conditions were cropped to preserve elliptical face shapes. The current study extends these findings by demonstrating that the efficiency of face detection is maintained when general face-shape information is preserved even when the typical arrangement of internal features is not.
Considering that face detection was impaired for profile faces (Experiment 1) and frontal faces that were rotated by 90° (Experiment 2) in comparison to upright frontal face views, the question arises of whether symmetry is an important element for optimising face detection. In the inverted face conditions of Experiment 3 and 5, symmetry information was retained but detection was attenuated compared to upright faces. Other studies have also shown that the detection advantage for frontal faces over other face views persists when symmetry is eliminated by presenting only one half of a face (Burton & Bindemann, Citation2009). This indicates that symmetry per se is not responsible for the detection advantage for upright frontal faces. Perhaps this information must be combined with other facial cues to optimise detection performance. However, such an account must also explain the effects of scene complexity that were observed consistently across all five experiments here.
One explanation for these findings could be that in blank or very simple visual displays (such as the low complexity Voronoi scenes), a face could be differentiated from non-face objects (or the visual background) on just a single visual feature, for example, such as skin-colour or face outline. This would avoid the need to process these stimuli in greater depth, resulting in fast and accurate detection performance – as was observed across all experiments here. In contrast, the parsing of faces from more complex backgrounds might require the combination of information, such as colour and shape, as non-face objects might share some of these individual features. Such an account would resonate with studies with non-face stimuli that have demonstrated how search for single-feature targets becomes more challenging when these are embedded in more varied or complex visual displays (e.g., Duncan & Humphreys, Citation1989; Santhi & Reeves, Citation2004; Treisman, Citation1991). It also resonates with theories in which conjunctions of features can guide search for a target more effectively than single features (e.g., Wolfe et al., Citation1989). In the face domain, such an account would be consistent with reports that several sources of information are important for face detection in scenes (Bindemann & Burton, Citation2009; Burton & Bindemann, Citation2009; Pongakkasira & Bindemann, Citation2015; Prunty et al., Citation2023), and that representations of faces in which different sources of information are combined are detected more effectively than separable facial features (Hershler & Hochstein, Citation2005).
Finally, we note that the current findings converge with other studies which suggest that detection may be quite distinct from other tasks with faces (see Bindemann & Lewis, Citation2013; Pongakkasira & Bindemann, Citation2015; Qarooni, Prunty, Bindemann, & Jenkins, Citation2022). The recognition of facial identity and emotion, for example, relies on internal facial features to function optimally (see, e.g., Ellis et al., Citation1979; Toseeb et al., Citation2012; Wegrzyn et al., Citation2017), whereas the detection of faces appears unaffected by changes to the internal features (such as rotation in Experiment 4). This emphasises the importance of understanding the process of face detection in its own right. This study extends these observations by demonstrating that how detection is investigated determines what can be learned about this process. In contrast to other tasks with faces, such as recognition and emotion perception, detection should be studied with complex visual displays that necessitate the search for faces for a fuller understanding of this process.
Authorship contributions
Alice Nevard – Conceptualization; Data curation; Formal analysis; Funding acquisition; Investigation; Methodology; Visualization; Roles/Writing – original draft; Writing – review & editing. Markus Bindemann – Conceptualization; Funding acquisition; Methodology; Visualization; Roles/Writing – original draft; Writing – review & editing. Graham Hole – Conceptualization; Funding acquisition; Writing – review & editing. Jon Prunty – Conceptualization; Methodology; Roles/Writing.
Supplementary material
The data for all experiments reported in this study can be accessed at https://osf.io/gwpk9/?view_only=c89d5ced3a8648a09403b9c7df8d4e51.
Disclosure statement
No potential conflict of interest was reported by the author(s).
References
- Bindemann, M., & Burton, A. M. (2008). Attention to upside-down faces: An exception to the inversion effect. Vision Research, 48(25), 2555–2561. https://doi.org/10.1016/j.visres.2008.09.001
- Bindemann, M., & Burton, A. M. (2009). The role of color in human face detection. Cognitive Science, 33(6), 1144–1156. https://doi.org/10.1111/j.1551-6709.2009.01035.x
- Bindemann, M., Burton, A. M., & Jenkins, R. (2005). Capacity limits for face processing. Cognition, 98(2), 177–197. https://doi.org/10.1016/j.cognition.2004.11.004
- Bindemann, M., Burton, A. M., Leuthold, H., & Schweinberger, S. R. (2008). Brain potential correlates of face recognition: Geometric distortions and the N250r brain response to stimulus repetitions. Psychophysiology, 45(4), 535–544. https://doi.org/10.1111/j.1469-8986.2008.00663.x
- Bindemann, M., & Lewis, M. B. (2013). Face detection differs from categorization: Evidence from visual search in natural scenes. Psychonomic Bulletin & Review, 20(6), 1140–1145. https://doi.org/10.3758/s13423-013-0445-9
- Bindemann, M., Scheepers, C., Ferguson, H. J., & Burton, A. M. (2010). Face, body, and center of gravity mediate person detection in natural scenes. Journal of Experimental Psychology: Human Perception and Performance, 36(6), 1477–1485. https://doi.org/10.1037/a0019057
- Burton, A. M., & Bindemann, M. (2009). The role of view in human face detection. Vision Research, 49(15), 2026–2036. https://doi.org/10.1016/j.visres.2009.05.012
- Burton, A. M., Bindemann, M., Langton, S. R., Schweinberger, S. R., & Jenkins, R. (2009). Gaze perception requires focused attention: Evidence from an interference task. Journal of Experimental Psychology: Human Perception and Performance, 35(1), 108–118. https://doi.org/10.1037/0096-1523.35.1.108
- Cerf, M., Frady, E. P., & Koch, C. (2009). Faces and text attract gaze independent of the task: Experimental data and computer model. Journal of Vision, 9(12), 10–10. https://doi.org/10.1167/9.12.10
- Crouzet, S. M., Kirchner, H., & Thorpe, S. J. (2010). Fast saccades toward faces: Face detection in just 100 ms. Journal of Vision, 10(4), 16–16. https://doi.org/10.1167/10.4.16
- Crouzet, S. M., & Thorpe, S. J. (2011). Low-level cues and ultra-fast face detection. Frontiers in Psychology, 2, 342. https://doi.org/10.3389/fpsyg.2011.00342
- De Lissa, P., McArthur, G., Hawelka, S., Palermo, R., Mahajan, Y., Degno, F., & Hutzler, F. (2019). Peripheral preview abolishes N170 face-sensitivity at fixation: Using fixation-related potentials to investigate dynamic face processing. Visual Cognition, 27(9-10), 740–759. https://doi.org/10.1080/13506285.2019.1676855
- Di Giorgio, E., Turati, C., Altoè, G., & Simion, F. (2012). Face detection in complex visual displays: An eye-tracking study with 3-and 6-month-old infants and adults. Journal of Experimental Child Psychology, 113(1), 66–77. https://doi.org/10.1016/j.jecp.2012.04.012
- Duncan, J., & Humphreys, G. W. (1989). Visual search and stimulus similarity. Psychological Review, 96(3), 433–458. http://doi.org/10.1037/0033-295X.96.3.433
- Ellis, H. D., Shepherd, J. W., & Davies, G. M. (1979). Identification of familiar and unfamiliar faces from internal and external features: Some implications for theories of face recognition. Perception, 8(4), 431–439. https://doi.org/10.1068/p080431
- Farah, M. J., Wilson, K. D., Drain, H. M., & Tanaka, J. R. (1995). The inverted face inversion effect in prosopagnosia: Evidence for mandatory, face-specific perceptual mechanisms. Vision Research, 35(14), 2089–2093. https://doi.org/10.1016/0042-6989(94)00273-O
- Gao, L., Xu, J., Zhang, B., Zhao, L., Harel, A., & Bentin, S. (2009). Aging effects on early-stage face perception: An ERP study. Psychophysiology, 46(5), 970–983. https://doi.org/10.1111/j.1469-8986.2009.00853.x
- Hershler, O., Golan, T., Bentin, S., & Hochstein, S. (2010). The wide window of face detection. Journal of Vision, 10(10), 21–21. https://doi.org/10.1167/10.10.21
- Hershler, O., & Hochstein, S. (2005). At first sight: A high-level pop out effect for faces. Vision Research, 45(13), 1707–1724. https://doi.org/10.1016/j.visres.2004.12.021
- Hershler, O., & Hochstein, S. (2009). The importance of being expert: Top-down attentional control in visual search with photographs. Attention, Perception, & Psychophysics, 71(7), 1478–1486. https://doi.org/10.3758/APP.71.7.1478
- Hole, G. J., George, P. A., Eaves, K., & Rasek, A. (2002). Effects of geometric distortions on face-recognition performance. Perception, 31(10), 1221–1240. https://doi.org/10.1068/p3252
- Jenkins, R., Lavie, N., & Driver, J. (2003). Ignoring famous faces: Category-specific dilution of distractor interference. Perception & Psychophysics, 65(2), 298–309. https://doi.org/10.3758/BF03194801
- Kelly, D. J., Duarte, S., Meary, D., Bindemann, M., & Pascalis, O. (2019). Infants rapidly detect human faces in complex naturalistic visual scenes. Developmental Science, 22(6), e12829. https://doi.org/10.1111/desc.12829
- Kemp, R., Pike, G., White, P., & Musselman, A. (1996). Perception and recognition of normal and negative faces: The role of shape from shading and pigmentation cues. Perception, 25(1), 37–52. https://doi.org/10.1068/p250037
- Langton, S. R., Law, A. S., Burton, A. M., & Schweinberger, S. R. (2008). Attention capture by faces. Cognition, 107(1), 330–342. https://doi.org/10.1016/j.cognition.2007.07.012
- Lewis, M. B., & Edmonds, A. J. (2003). Face detection: Mapping human performance. Perception, 32(8), 903–920. https://doi.org/10.1068/p5007
- Looser, C. E., Guntupalli, J. S., & Wheatley, T. (2013). Multivoxel patterns in face-sensitive temporal regions reveal an encoding schema based on detecting life in a face. Social Cognitive and Affective Neuroscience, 8(7), 799–805. http://doi.org/10.1093/scan/nss078
- Maylott, S. E., Sansone, J. R., Jakobsen, K. V., & Simpson, E. A. (2021). Superior detection of faces in male infants at 2 months. Child Development, 92(4), e621–e634. https://doi.org/10.1111/cdev.13543
- Meissner, T. W., Prüfer, H., Nordt, M., Semmelmann, K., & Weigelt, S. (2018). Development of face detection in preschool children. International Journal of Behavioral Development, 42(4), 439–444. https://doi.org/10.1177/0165025417738058
- Moscovitch, M., & Moscovitch, D. A. (2000). Super face-inversion effects for isolated internal or external features, and for fractured faces. Cognitive Neuropsychology, 17(1-3), 201–219. https://doi.org/10.1080/026432900380571
- Moulson, M. C., Balas, B., Nelson, C., & Sinha, P. (2011). EEG correlates of categorical and graded face perception. Neuropsychologia, 49(14), 3847–3853. https://doi.org/10.1016/j.neuropsychologia.2011.09.046
- Nachson, I., & Shechory, M. (2002). Effect of inversion on the recognition of external and internal facial features. Acta Psychologica, 109(3), 227–238. https://doi.org/10.1016/S0001-6918(01)00058-0
- Peirce, J., Gray, J. R., Simpson, S., MacAskill, M., Höchenberger, R., Sogo, H., … Lindeløv, J. K. (2019). Psychopy2: Experiments in behavior made easy. Behavior Research Methods, 51(1), 195–203. https://doi.org/10.3758/s13428-018-01193-y
- Pongakkasira, K., & Bindemann, M. (2015). The shape of the face template: Geometric distortions of faces and their detection in natural scenes. Vision Research, 109, 99–106. https://doi.org/10.1016/j.visres.2015.02.008
- Prunty, J. E., Jenkins, R., Qarooni, R., & Bindemann, M. (2023). Ingroup and outgroup differences in face detection. British Journal of Psychology, 114(S1), 94–111. http://doi.org/10.1111/bjop.v114.S1
- Qarooni, R., Prunty, J., Bindemann, M., & Jenkins, R. (2022). Capacity limits in face detection. Cognition, 228, 105227. http://doi.org/10.1016/j.cognition.2022.105227
- Ro, T., Friggel, A., & Lavie, N. (2007). Attentional biases for faces and body parts. Visual Cognition, 15(3), 322–348. https://doi.org/10.1080/13506280600590434
- Rousselet, G. A., Husk, J. S., Bennett, P. J., & Sekuler, A. B. (2005). Spatial scaling factors explain eccentricity effects on face ERPs. Journal of Vision, 5(10), 1–1. https://doi.org/10.1167/5.10.1
- Santhi, N., & Reeves, A. (2004). The roles of distractor noise and target certainty in search: A signal detection model. Vision Research, 44(12), 1235–1256. http://doi.org/10.1016/j.visres.2003.11.011
- Simpson, E. A., Maylott, S. E., Leonard, K., Lazo, R. J., & Jakobsen, K. V. (2019). Face detection in infants and adults: Effects of orientation and color. Journal of Experimental Child Psychology, 186, 17–32. https://doi.org/10.1016/j.jecp.2019.05.001
- Toseeb, U., Keeble, D. R., & Bryant, E. J. (2012). The significance of hair for face recognition. PLoS One, 7(3), e34144. https://doi.org/10.1371/journal.pone.0034144
- Treisman, A. (1991). Search, similarity, and integration of features between and within dimensions. Journal of Experimental Psychology: Human Perception and Performance, 17(3), 652–676. http://doi.org/10.1037/0096-1523.17.3.652
- Valentine, T. (1988). Upside-down faces: A review of the effect of inversion upon face recognition. British Journal of Psychology, 79(4), 471–491. https://doi.org/10.1111/j.2044-8295.1988.tb02747.x
- Wegrzyn, M., Vogt, M., Kireclioglu, B., Schneider, J., & Kissler, J. (2017). Mapping the emotional face. How individual face parts contribute to successful emotion recognition. PLoS One, 12(5), e0177239. https://doi.org/10.1371/journal.pone.0177239
- Wolfe, J. M., Cave, K. R., & Franzel, S. L. (1989). Guided search: An alternative to the feature integration model for visual search. Journal of Experimental Psychology: Human Perception and Performance, 15(3), 419–433. http://doi.org/10.1037/0096-1523.15.3.419
- Yang, C. T., Shih, C. H., Cheng, M., & Yeh, Y. Y. (2009). Similarity modulates the face-capturing effect in change detection. Visual Cognition, 17(4), 484–499. https://doi.org/10.1080/13506280701822991
- Yin, R. K. (1969). Looking at upside-down faces. Journal of Experimental Psychology, 81(1), 141. https://doi.org/10.1037/h0027474
- Yip, A. W., & Sinha, P. (2002). Contribution of color to face recognition. Perception, 31(8), 995–1003. https://doi.org/10.1068/p3376
- Young, A. W., Hay, D. C., McWeeny, K. H., Flude, B. M., & Ellis, A. W. (1985). Matching familiar and unfamiliar faces on internal and external features. Perception, 14(6), 737–746. https://doi.org/10.1068/p140737