
ABSTRACT
We assembled a test battery to investigate developmental prosopagnosia (DP), a neurodevelopmental syndrome resulting in severe face recognition difficulties. To screen for general cognitive deficits that could explain poor face test performance, participants completed a fluid reasoning task using abstract shapes. This initial screening showed that DPs (n = 21) were more accurate than neurotypical controls (n = 90) but significantly slower, suggesting speed-accuracy trade-off. To address this, we calculated the Balanced Integration Score and found no group differences, highlighting that DPs clearly adopted a different strategy from controls. DPs’ longer response times (RT) on face tasks vs controls are commonly interpreted as evidence of impairment and of lengthy, atypical featural face processing. Our data suggest this interpretation may be unreliable since clear RT differences were also observed in two non-face tasks where DPs showed no accuracy impairment. Instead, slower RTs appear to reflect a strategy shift in DPs.
Background
Developmental prosopagnosia (DP) is a neurodevelopmental syndrome resulting in severe face recognition problems due to the visual mechanisms for face processing having failed to develop (Duchaine & Nakayama, Citation2006). The prevalence of DP is estimated at around 2–2.9% in adults (Bowles et al., Citation2009) and between 1.2% and 4% in children (Bennetts et al., Citation2017).
Evidence for different processing strategies for faces
The literature suggests that DP is a heterogenous condition both in presentation and severity. It is currently unclear whether DP simply represents the bottom end of the face processing ability spectrum or whether there are qualitative differences in how individuals with DP (DPs) and typical perceivers encode and recall faces.
Although recognition accuracy is usually the main outcome measure of interest when investigating DP, differences in response time (RT) between DPs and typical perceivers are increasingly considered to be informative. For example, studies using the standardized Benton Face Recognition Test (BFRT; Benton et al., Citation1983) reported that DPs can often perform within typical accuracy limits when the task has extended or unlimited presentation time (Duchaine & Nakayama, Citation2004; Nunn et al., Citation2001). By contrast, in other studies using a revised BFRT with a shortened presentation time, (Rossion & Michel, Citation2018) DPs performed less accurately than typical perceivers (Mishra et al., Citation2021; Murray et al., Citation2022). It is posited that a longer presentation time allows DPs to process faces in a laborious feature-by-feature manner, resulting in comparable accuracy to typical perceivers (Fysh & Ramon, Citation2022; Mishra et al., Citation2021; Murray et al., Citation2022). Conversely, short presentation times “force” fast, holistic processing that is challenging for DPs, resulting in low recognition accuracy and making RT a useful additional measure of face processing in DP.
Do these different strategies extend beyond processing of faces?
The specificity of DP as a face selective condition independent of other object processing impairments remains a key question. Geskin and Behrmann (Citation2018) reviewed published data on 238 cases of DP and found that most DPs (80% or 62% depending on the method used) showed evidence of concurrent object recognition impairment from accuracy and/or RT data. They argued that this suggests a shared underlying mechanism for face and object processing. However, the many responses to the review (summarized and responded to in Behrmann & Geskin, Citation2018) illustrate the current lack of consensus on this topic. Several researchers argue that there may be a subset of DPs with face-specific impairments (Dalrymple et al., Citation2017; Eimer, Citation2018); others that prosopagnosia should be considered an independent disorder that may co-occur with other forms of agnosia (Gray & Cook, Citation2018).
It is also not clear whether these processing differences extend beyond faces, objects with clear semantic information, and tests using within-class exemplars (e.g., cars, bicycles) to objects without associated semantic information (e.g., abstract shapes). Indeed, abstract shapes are widely used in fluid intelligence tests (e.g., matrix reasoning). It is widespread practice to administer some form of intelligence test when investigating face recognition ability despite there being no evidence that poor face recognition is associated with lower IQ (Connolly et al., Citation2019; Davis et al., Citation2011; Jones & Tranel, Citation2001; Wilmer, Citation2017) for two reasons. Firstly, to rule out a more general cognitive deficit as an explanation for impaired face processing test performance and/or, secondly, to match typical perceivers and DPs on IQ.
Here, we briefly report results from a fluid reasoning task, the Matrix Item Reasoning Bank (MaRs-IB) (Chierchia et al., Citation2019) which formed a part of a comprehensive neuropsychological test battery administered to 111 participants to examine the underpinnings of DP across the lifespan. Full analysis of the test battery is underway and will be reported in another publication. The main objective of this brief report is to highlight evidence of a strategy difference in DP that extends to non-face stimuli. This finding could stimulate the DP research in new directions and offer a new perspective and new training regimes to help DPs navigate everyday life.
Method
Participants
Participants were 111 individuals: 21 DPs (15 women and 6 men; range = 8–71 years) and 90 age-matched neurotypical controls (51 women and 39 men; range 6–74 years, see ). All reported normal or corrected-to-normal vision. Normal low-level vision was confirmed by performance on five subtests of the Birmingham Object Recognition Battery (Riddoch & Humphreys, Citation1993). We excluded participants who experienced major head injury at any time, a mild head injury or a concussion within 12 months or had a neurodevelopmental or major psychiatric condition diagnosis. Participants from the UK, Ireland, and the USA were recruited though social media, media coverage, personal networks, and prosopagnosia support groups and received a £10 gift voucher upon completion.
Table 1. Participant demographics.
For this initial screening, participants were classified as DP if they reported lifelong difficulty recognizing familiar faces and scored ≥ 61 on the PI20 (Shah et al., Citation2015), a cut off recommended by Tsantani et al. (Citation2021). For children and young people aged 6–17 years we required parental report of face recognition difficulties classified as a score < −1.7 SD below the control group mean on a questionnaire comprising 32 items: 17 items from the PI20 (Shah et al., Citation2015), rephrased where necessary to make it suitable for reporting a third party’s ability, and 15 additional items identified as hallmarks of prosopagnosia for non-experts (Murray et al., Citation2018). Inclusion and exclusion criteria and case histories were confirmed through interviews. DP classification using objective face memory measures is reported by Lowes et al. (Citation2024).
Approval for the study was granted by the University of Stirling General University Ethics Panel. Informed consent and child assent were obtained from all participants and research was conducted in accordance with the principles of the Declaration of Helsinki.
Materials and procedure
Experiment 1
Participants completed the MaRs-IB (Chierchia et al., Citation2019) – a computerized non-verbal reasoning task suitable for children and adults. Chierchia et al.’s (Citation2019) results correlated well with another test of fluid intelligence, the International Cognitive Ability Resource (Condon & Revelle, Citation2014), and were broadly replicated in an online study (Nussenbaum et al., Citation2020).
Participants choose one of four possible abstract shapes that will correctly complete a 9 × 9 grid of shapes ().
Figure 1. Example items from the MaRs – IB. Panel A shows a simple item containing a one – relational change (i.e., only the colour changes) and answer options. The fourth option is the correct option. Panel B shows a harder item containing a three-relational change (i.e., shape, colour and position change). The third option is the correct option. Figure reproduced with permission.
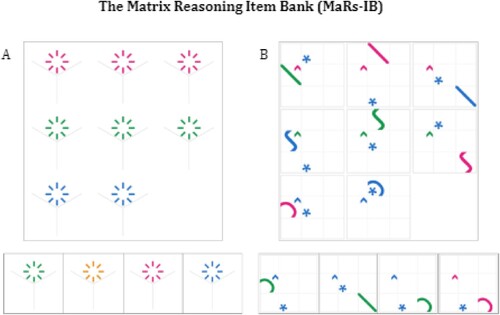
Participants have up to 30 s to complete each trial. After 25 s, a countdown clock appears, indicating that 5 s remains until the next trial. Participants are instructed to “try to be as fast and accurate as you can be” and, if they are unable to solve the puzzle, to guess. They are informed that they “will have 30 s to complete each puzzle”. The full task instructions are shown in Supplementary Material. We administered the colour-blind friendly version of the test to all participants. The test begins with three practice trials that must be completed correctly. Feedback is provided after each trial. All participants see trials in the same order and the test ends either after 8 min or when the maximum possible 80 trials have been completed, whichever occurs first. Trials broadly increase in difficulty as the task progresses. Crucially, the design means that participants may complete a different number of trials (the range in our study was 21–80 and 24–79 among controls and DP respectively, see ). Therefore, one participant score of 48/80 and another of 24/40 would both result in the same accuracy score of 60%. Similarly, in the maximum allowable time of 8 min one participant who completes the maximum possible 80 trials with 40% accuracy and another who adopts a different speed-accuracy trade off strategy and completes only 40 trials but with 80% accuracy would both achieve the same number correct score of 32. For a full description of the task and validation data see Chierchia et al. (Citation2019). Following Chierchia et al. (Citation2019) we calculated and report the average of each participant’s median item RT to account for the fact that participants who complete more trials will attempt a higher proportion of relatively more difficult items.
Cambridge Bicycle Memory Test (CBMT) (Dalrymple et al., Citation2014)
Participants study six target bicycles each from three different viewpoints. Cropped and greyscale bicycles, from which logos are removed, are presented for 3 s. The test stage uses a three alternate forced choice format, comprising one target and two distractor bicycles. In the introduction test phase, each target bicycle is tested with three identical viewpoints. In the second test phase, after review, each target bicycle is shown in a novel viewpoint from that learned in study and, finally, the noise test section introduces novel views of the target bicycle with added Gaussian noise. There are 72 trials in total and chance = 33%. RT is unlimited.
Participants and parents of children under 18 years old received written instructions in advance of testing in addition to the on-screen instructions. Parents supervised their children and could assist with explaining the task but were instructed not to help with responses. The test was administered using the online testing platform Gorilla (www.gorilla.sc) with Google Chrome as the recommended browser.
Analysis and pre-processing
The exploratory analysis for the full study was pre-registered at https://osf.io/qne8d. We centred z scores on control age group means because accuracy and RT may vary on some tasks as a function of age. This age group standardization allowed us to classify DP participants’ performance relative to controls across the full age range since here the z scores quantify participants’ performance relative to their own age group. Following previous DP literature, age groups were predefined as 6–9, 10–13, 14–35,Footnote1 36–59 and 60–74 years and descriptive statistics for each age group are shown in Table S1 in Supplementary Material. The DP and control groups showed no significant difference in age (X2 = 50.05, p = .316).
Chierchia et al. (Citation2019) recommend four dependent variables (DVs): (i) accuracy which is the (proportion of trials completed in the allowable time that were correct (8 mins or when the maximum 80 items were completed, whichever came first)); (ii) median response time (RT) on correct trials; (iii) number of trials attempted (correct and incorrect), and (iv) inverse efficiency (IE; a measure that considers both RT and accuracy). However, the use of IE is not recommended when mean accuracy is less than around 90%, or when there is a speed-accuracy trade off (Bruyer & Brysbaert, Citation2011), and both are true in the case of the MaRs-IB (slower participants were more accurate whether considering the sample as a whole (r(109) = .772, p < .001) or just controls (r (88) = .735, p < .001)). We thus elected to use the Balanced Integration Score (Liesefeld & Janczyk, Citation2019, Citation2023). BIS is an integrated measure that adjusts accuracy to account for RT whilst controlling for speed-accuracy trade-offs and is calculated as Zaccuracy minus ZRT, (RT for correct trials only). Data were analysed in R (R Core Team, Citation2021) using R Studio 2021.09.1. We conducted Welch’s t tests which are recommended in independent subject designs with different experimental group sizes and/or unequal group variance (Ruxton, Citation2006), and also Bayesian independent samples t tests using the default Cauchy prior with a scale of 0.707. Data and code are available at https://osf.io/btyud.
Data from two child controls were excluded from the study prior to analysis because they performed at chance on this test and well below chance on a second test suggesting either an inability to follow instructions or suboptimal effort, or both.
Results
Accuracy and RTs in typical perceivers’ data were normally distributed. There were no gender differences in the data (p > .05) or in the gender distribution between the DP and control groups (X2 = 1.54, p = .215) and so we collapsed the data across gender to increase statistical power ().
Table 2. Descriptive statistics.
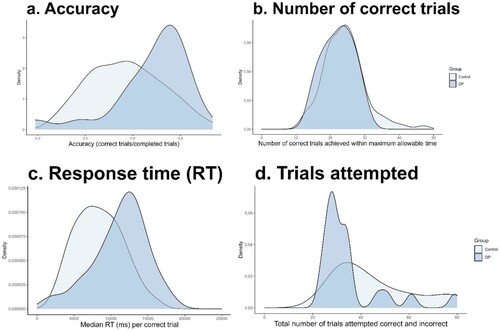
DPs were, on average, more accurate in the MaRs-IB (M = .680, SD = .162, [95% CI .611–.749]) than controls (M = .572, SD = .154 [95% CI .540–.603]). Independent samples t tests on the standardized scores showed that this difference approached significance Welch’s t (27.6) = 2.03, p = .052, Cohen’s d = 0.51 (see (a)). However, the Bayesian t test indicated only weak support for this difference (BF10 = 1.94), in other words, the alternative hypothesis (a true difference exists between groups) is around twice as likely as the null hypothesis given the data. Trials increase in difficulty as the test progresses, so to exclude the possibility that the DP group’s higher numerical accuracy was simply due to the fact that this group, on average, completed a lower number of trials vs controls and thus an easier overall set of trials, we repeated the analysis using only trials 6–25, i.e., excluding the more difficult later trials that not all DPs attempted. Results were again that the DP group was more accurate (M = .68, SD = .16) than controls (M = .57, SD = .15); this time the group difference was significant, t (28.8) = 2.16, p = .040, Cohen’s d = 0.53, although Bayesian analysis provided only anecdotal support for a true group difference, BF10 = 2.09. The observed accuracy difference is therefore not due to DPs completing a higher proportion of easier trials. The important finding, confirmed by this additional analysis, is that DPs were not impaired on the MaRs-IB and had similar or even slightly better accuracy than controls, meaning that any group RT differences on this task are not due to impaired accuracy.
Figure 2. MaRs-IB score distribution by group (DP or control). Panel a shows accuracy scores (i.e., proportion of trials completed in the maximum allowable time that were correct. Chance = 0.25, range was 0.19–0.94). Panel b shows number of correct trials completed in the maximum time allowed which was 30,000 ms per trial, overall maximum test duration was 8 min or when all 80 trials were completed – whichever occurred first. Maximum possible score = 80, observed range was 13–47. Panel c shows average median RT in ms (correct trials only). Panel d shows the total number of trials attempted within the allowable 8 min.
Response time
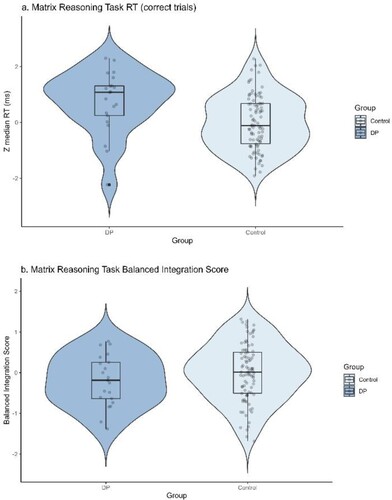
In this task, there was a strong positive relationship between accuracy and response time, whether considering the sample as a whole (r (111) = .762, p < .001), or just controls (r (90) = .730, p < .001), that is on average participants who took longer to respond were also more accurate. As shown in , the different pattern of results observed between accuracy (proportion correct) and number correct (raw score) appears to be driven by DPs adopting a different strategy to controls. Namely, as shown in (c), on average DPs took significantly longer per correct trial (median item RT 11,219 ms) than controls (8380 ms). An independent samples t test comparing group standardized RTs showed this difference was significant Welch’s t (27.6) = 2.77, p = .010, Cohen’s d = 0.70 ((a)) and DPs were likely therefore more accurate due to the speed-accuracy trade off on this task. Importantly, this difference was not due to differences in age distribution between the groups since the z scores were centred on age group control means. Further information on age group-level performance is provided in Figure S1 Supplementary Materials. An independent samples Bayesian t test (BF10 = 11.3) provided strong support for the alterative hypothesis. In other words, the alternative hypothesis (a true difference in RT exists between the DP and control groups) is more than 11 times as likely as the null hypothesis given the data.
Figure 3. Comparison of RT difference between the DP and control groups across 20 easier trials and 20 more difficult MaRs-IB trials.
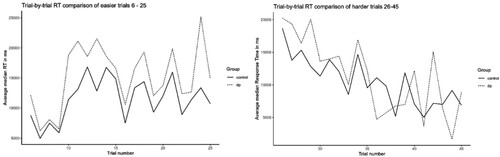
In the MaRs-IB, trials are presented in a fixed order and, as with Raven’s Progressive Matrices, difficulty broadly increases as trials progress. Unfortunately, there is no item level difficulty data for the colour-blind version of the task that we used. To check that RT differences were not due to DPs simply completing a higher proportion of easier trials, we therefore separately compared mean group performance on 20 easier trials (trials 6–25, we excluded trials 1–5 which are very easy and mainly used for familiarization) vs the following 20 trials (numbers 26–45) which are more difficult. As can be clearly seen from , even on the easier trials, the DP group’s mean item RT (M = 15,732 ms, SD = 4841) was consistently and significantly slower than controls’ (M = 12,403 ms, SD = 3276), t(33.4) = 2.55, p = .016, Cohen’s d = 0.81, BF10 = 3.63. The observed group RT differences cannot therefore be accounted for by DPs completing a higher proportion of relatively easier trials. On the 20 harder trials, although numerically DPs were again slower than controls, this difference was smaller and NS, p = .666, Cohen’s d = .14, BF10 = .34. Similar analysis comparing standardized accuracy on the 20 easier trials found that DPs (Mz = 0.67, SD = 1.05) were significantly more accurate than controls (Mz = 0.13, SD = 0.99, t(28.8) = 2.156, p = .040, Cohen’s d = .53, BF10 = 2.09). Taken together, these results show that the DP group’s higher accuracy and longer RTs on the matrix reasoning task are not simply explained by the task design whereby faster participants complete a higher proportion of more difficult trials. This additional exploratory analysis was suggested during peer review and was not pre-registered. An ANOVA was also suggested but was not feasible due to small numbers of DP correctly completing some of the later trials, and a large variation of overall number of correct responses across trials.
Balanced integrated score (BIS)
To confirm whether DPs’ higher group-level accuracy was indeed driven by differences in the speed accuracy trade-off strategies adopted by DPs and controls, we calculated the BIS (Liesefeld & Janczyk, Citation2019), a measure that can be interpreted as accuracy adjusted for RT thereby controlling for differential speed-accuracy trade-offs. The authors reported that drift diffusion modelling using simulated data showed that BIS was suitable for tasks with varying levels of mean accuracy and decision thresholds (Liesefeld & Janczyk, Citation2019). As a reminder, the z scores used to calculate the BIS were centred on control age group means thus all DPs are compared to typical controls of their own approximate age which controls for any differences that might be observed in speed-accuracy trade-offs in different age groups. As shown in (b), no significant difference in BIS was observed between DPs and controls, Welch’s t(33.2) = −1.27, p = .212. Cohen’s d = −0.30. An independent samples Bayesian t test (BF10 = 0.45) provided moderate support for the null hypothesis. In other words, as expected, once RT and differential speed accuracy trade-offs had been accounted for, there was no difference in accuracy between the DP and control groups. The absence of group difference in Balanced Integration Scores strongly suggests that the unexpected group accuracy differences were driven by different speed-accuracy trade-offs between the groups. To confirm this we also inspected and report performance on an object recognition task that was part of our test battery, the CBMT (Dalrymple et al., Citation2014).
Figure 4. Panel a shows the difference in average standardized median item RT between groups and panel b the difference in balanced integration score (calculated as Zaccuracy minus ZRT) between the control and DP groups. Each dot represents a single data point, the box shows the interquartile range (IQR) and the mid line indicates the group median RT in ms. The end of each whisker line represents 1.5 x the IQR. Maximum allowable time per trial = 30,000 ms.
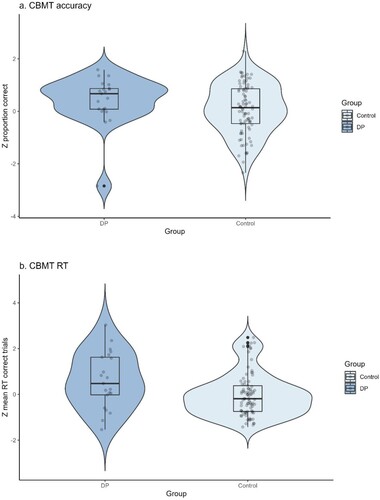
Our test battery also included an object recognition task, the CBMT, so to check whether these apparent strategy differences extended to objects, we next used independent t tests to compare DP and control group accuracy, RT and BIS. As before, we computed standardized scores centred on age group-specific control group means to account for age differences. Four control participants did not complete the CBMT.
As shown in , the DP group was, on average, slightly more accurate (Zaccuracy M = 0.41, SD = 0.93) than controls (Zaccuracy M = 0.08, SD = 0.95) but the difference was ns (t (31.1) = 1.47, p = .151, Cohen’s d = 0.36, BF10 = 0.61). As with the MaRs-IB, the DP group was significantly slower (ZRT = 0.61, SD = 1.22) than age-matched controls (ZRT = −0.02, SD = 0.94) with moderate evidence for a true group difference, t(26.1) = 2.20, p = .037, Cohen’s d = 0.58, BF10 = 4.11. When BIS was calculated to control for differences in speed-accuracy trade-offs (DP = −0.20, SD 1.44; controls = 0.09, SD 1.26), group performance did not differ, t(27.9) = −0.86, p = .398, Cohen’s d = −0.22, BF10 = 0.36 indicating that the previously observed group RT differences on the CBMT were again a result of strategy differences between DPs and controls.
Figure 5. CBMT = Cambridge Bicycle Memory Test. Panel a shows the difference in average standardized accuracy and panel b the group difference in standardized RT between the control and DP groups. Each dot represents a single data point, the box shows the interquartile range (IQR) and the mid line indicates the group median RT in ms. The end of each whisker line represents 1.5x the IQR.
Finally, after removing one outlier (DP) with unusually fast response time and low accuracy, we conducted Pearson product-moment correlations to assess the relationship between standardized RT and accuracy performance on the MaRs-IB and CBMT (). Results showed a significant moderate positive correlation for RT on these two tasks when examining the sample as a whole and the control group only. In the DP group, we in fact observed a stronger relationship which only trended toward significance p = .057, likely due to reduced power given the much smaller DP sample size. Nevertheless, the strength of the RT correlations on these quite different paradigms supports the idea that RT differences are related across tasks – particularly since accuracy scores on these same tasks were unrelated in both the DP and control groups, and also the sample as a whole.
Table 3. Correlation tables matrix reasoning and bicycle memory tasks.
Discussion
Participants who reported severe face recognition difficulties (DPs) and age-matched typical perceivers completed an abstract reasoning test to screen for wider cognitive difficulties that might account for atypical face recognition performance, e.g., inability to follow instructions. DPs were, on average, more accurate than controls that is, of the trials they attempted, a higher proportion were correct, (importantly this was also the case when considering only a subset of 20 easier trials) but, overall, both groups achieved a similar number of correct trials in the maximum allowable time. This difference in accuracy was driven by DPs spending longer per trial, despite the test instructions stressing both speed and accuracy and thus leaving participants to decide their own approach to how to attempt to balance these. The DPs clearly adopted a different strategy to typical perceivers in this visual processing task that did not involve faces or objects with clear semantic information, and one that did not involve long-term memory. Once accuracy was adjusted to account for differential speed-accuracy trade-offs, no group difference was observable.
In short, DPs were, on average, more accurate owing to the speed-accuracy trade-off in this visual processing task. Importantly, typical perceivers’ accuracy broadly replicated previous published data from an online sample (Nussenbaum et al., Citation2020) suggesting that our results cannot be accounted for by an unusual control sample.
Results from a bicycle recognition task provided converging evidence for a strategy difference. A very similar pattern of results was observed on both tasks; DPs were more accurate yet slower to make correct responses than controls. The significant positive relationship between RTs on the MaRs-IB and CBMT provides further support that RT differences are indeed related across very different paradigms.
The fact that the DP and control groups appear to have taken different approaches to speed-accuracy trade-offs is perhaps not unexpected. In their review of reaction time and individual differences, Draheim et al. (Citation2019) point out that participants with different levels of ability are likely to respond differently to the same instructions, as are participants of different ages. There may also be within-participant differences observed. For example, participants may prioritize speed on easier trials and accuracy on harder trials (Liesefeld & Janczyk, Citation2019). Accounting for differential speed accuracy trade-offs between and within participants is therefore important more generally (Meyer et al., Citation2019) and is of critical importance in syndromes such as DP, but also other syndromes for which there is no genetic or clinical diagnostic test and diagnosis and/or classification is made on the basis of impaired performance on behavioural tests.
We have reported elsewhere (Lowes et al., Citation2024) that many more individuals who reported face recognition difficulties were classified as DP once accuracy was adjusted for RT through use of Balanced Integration Scores (BIS) on four objective measures of face memory compared with accuracy scores alone (83% vs 58% of the potential DP group respectively). In other words, many of the potential DP group appeared initially to have below average but nevertheless typical face memory accuracy, but this apparently normal accuracy was only achieved at the expense of abnormally prolonged RT. Once accuracy was adjusted to account for RT (using BIS), thus controlling for these differential speed-accuracy trade-offs, a far greater proportion showed a face memory deficit. Additionally, data from the Cambridge Face Memory Test (Duchaine & Nakayama, Citation2006), a test that uses the same format as the CBMT and is considered the “gold standard” for detecting prosopagnosia, showed clear evidence of different speed-accuracy trade-offs among DPs and controls: The most accurate controls were also faster but, conversely, among DPs the more accurate DPs were slower.
Our finding here is important because a common interpretation of abnormally prolonged RT in prosopagnosia (both acquired and developmental) is that it indicates a deficit in holistic face processing and that extended or unlimited presentation time allows individuals to process faces in a serial feature-by-feature manner (Fysh & Ramon, Citation2022; Mishra et al., Citation2021; Murray et al., Citation2022). This feature-by-feature strategy is atypical relative to neurotypical, rapid holistic face processing. While this may be true in some cases, a more parsimonious explanation may be that differences in strategy preference exist between DPs and controls since our results suggest that different strategies in DPs are also present for non-face stimuli that do not rely on holistic processing in the way faces are widely argued to do.
We therefore caution against interpreting RT differences in DP as evidence of a deficit in holistic face processing because while these longer processing times may facilitate feature-by-feature processing of faces, they may not be driven by this. The long, although not unlimited, stimulus presentation times in the MaRs-IB and the unlimited RT allowed in the CBMT also produced a shift in strategy amongst DPs that crucially did not reflect a lack of ability on either of these tasks, quite the opposite since DPs were numerically (though not always statistically) more accurate than controls. For clarity, we do not claim that these interesting findings suggest any relationship between performance on these tasks and face processing more generally, instead we show that DPs demonstrated a preference to proceed more carefully and cautiously than controls across a range of cognitive tasks not involving faces and that this strategy preference is unrelated to ability, or to the processing of faces specifically. Our findings strengthen the case for RTs to be routinely inspected in face and other visual stimulus categories tests and, crucially, for speed accuracy trade-offs that may differ between participants and between groups, to be accounted for using an appropriate measure such as the Balanced Integration Score (Liesefeld & Janczyk, Citation2019).
CRediT author statement
Judith Lowes: Conceptualization, Data curation, Formal analysis, Writing – Original draft preparation, Visualization, Investigation, Funding acquisition, Project administration: Anna Bobak: Conceptualization, Supervision, Writing – Reviewing and Editing, Funding Acquisition, Peter Hancock: Conceptualization, Supervision; Writing – Reviewing and Editing.
Role of the funding source
Funders had no influence on the study.
Lowes_Hancock_Bobak_Supplementary Materials.docx
Download MS Word (110.8 KB)Acknowledgements
Thanks to Gabriele Chierchia, Brad Duchaine and colleagues for kindly sharing their materials and experimental set up on Gorilla and Testable with us and to the participants and parents for taking part.
Disclosure statement
No potential conflict of interest was reported by the author(s).
Additional information
Funding
Notes
1 Bowles et al. (Citation2009) used 18–35 years for young adults but because there are ceiling effects above age 13 years on the CFMT Kids (Dalrymple et al., Citation2014) and other studies have successfully administered adult versions of face processing to adolescents age 14–15 years (Bate et al., Citation2015) we selected 14–35 years as our young adult age band.
References
- Bate, S., Bennetts, R., Mole, J. A., Ainge, J. A., Gregory, N. J., Bobak, A. K., & Bussunt, A. (2015). Rehabilitation of face-processing skills in an adolescent with prosopagnosia: Evaluation of an online perceptual training programme. Neuropsychological Rehabilitation, 25(5), 733–762. https://doi.org/10.1080/09602011.2014.973886
- Behrmann, M., & Geskin, J. (2018). Over time, the right results will emerge. Cognitive Neuropsychology, 35(1-2), 102–111. https://doi.org/10.1080/02643294.2018.1447917
- Bennetts, R. J., Murray, E., Boyce, T., & Bate, S. (2017). Prevalence of face recognition deficits in middle childhood. Quarterly Journal of Experimental Psychology, 70(2), 234–258. https://doi.org/10.1080/17470218.2016.1167924
- Benton, A. L., Sivan, A. B., Hamsher, K. D. S, Varney, N. R., & Spreen, O. (Eds.). (1983). Facial recognition: Stimulus and multiple choice pictures. Contribution to neuropsychological assessment (pp. 30–40). New York: Oxford University Press.
- Bowles, D. C., McKone, E., Dawel, A., Duchaine, B., Palermo, R., Schmalzl, L., Rivolta, D., Wilson, C. E., & Yovel, G. (2009). Diagnosing prosopagnosia: Effects of ageing, sex, and participant–stimulus ethnic match on the Cambridge face memory test and Cambridge face perception test. Cognitive Neuropsychology, 26(5), 423–455. https://doi.org/10.1080/02643290903343149
- Bruyer, R., & Brysbaert, M. (2011). Combining speed and accuracy in cognitive psychology: Is the inverse efficiency score (IES) a better dependent variable than the mean teaction time (RT) and the percentage of errors (PE)? Psychologica Belgica, 51(1), 5–13. https://doi.org/10.5334/pb-51-1-5
- Chierchia, G., Fuhrmann, D., Knoll, L. J., Pi-Sunyer, B. P., Sakhardande, A. L., & Blakemore, S.-J. (2019). The matrix reasoning item bank (MaRs-IB): Novel, open-access abstract reasoning items for adolescents and adults. Royal Society Open Science, 6(10), Article 190232. https://doi.org/10.1098/rsos.190232
- Condon, D. M., & Revelle, W. (2014). The international cognitive ability resource: Development and initial validation of a public-domain measure. Intelligence, 43, 52–64. https://doi.org/10.1016/j.intell.2014.01.004
- Connolly, H. L., Young, A. W., & Lewis, G. J. (2019). Recognition of facial expression and identity in part reflects a common ability, independent of general intelligence and visual short-term memory. Cognition and Emotion, 33(6), 1119–1128. https://doi.org/10.1080/02699931.2018.1535425
- Dalrymple, K. A., Elison, J. T., & Duchaine, B. (2017). Face-specific and domain-general visual processing deficits in children with developmental prosopagnosia. Quarterly Journal of Experimental Psychology, 70(2), 259–275. https://doi.org/10.1080/17470218.2015.1122642
- Dalrymple, K. A., Garrido, L., & Duchaine, B. (2014). Dissociation between face perception and face memory in adults, but not children, with developmental prosopagnosia. Developmental Cognitive Neuroscience, 10, 10–20. https://doi.org/10.1016/j.dcn.2014.07.003
- Davis, J. M., McKone, E., Dennett, H., O’Connor, K. B., O’Kearney, R., & Palermo, R. (2011). Individual differences in the ability to recognise facial identity are associated with social anxiety. PLoS One, 6(12), Article e28800. https://doi.org/10.1371/journal.pone.0028800
- Draheim, C., Mashburn, C. A., Martin, J. D., & Engle, R. W. (2019). Reaction time in differential and developmental research: A review and commentary on the problems and alternatives. Psychological Bulletin, 145(5), 508–535. https://doi.org/10.1037/bul0000192
- Duchaine, B. C., & Nakayama, K. (2004). Developmental prosopagnosia and the Benton Facial Recognition Test. Neurology, 62(7), 1219–1220. https://doi.org/10.1212/01.WNL.0000118297.03161.B3
- Duchaine, B. C., & Nakayama, K. (2006). The Cambridge face memory test: Results for neurologically intact individuals and an investigation of its validity using inverted face stimuli and prosopagnosic participants. Neuropsychologia, 44(4), 576–585. https://doi.org/10.1016/j.neuropsychologia.2005.07.001
- Eimer, M. (2018). What do associations and dissociations between face and object recognition abilities tell us about the domain-generality of face processing? Cognitive Neuropsychology, 35(1-2), 80–82. https://doi.org/10.1080/02643294.2017.1414691
- Fysh, M. C., & Ramon, M. (2022). Accurate but inefficient: Standard face identity matching tests fail to identify prosopagnosia. Neuropsychologia, 165, Article 108119. https://doi.org/10.1016/j.neuropsychologia.2021.108119
- Geskin, J., & Behrmann, M. (2018). Congenital prosopagnosia without object agnosia? A literature review. Cognitive Neuropsychology, 35(1-2), 4–54. https://doi.org/10.1080/02643294.2017.1392295
- Gray, K. L. H., & Cook, R. (2018). Should developmental prosopagnosia, developmental body agnosia, and developmental object agnosia be considered independent neurodevelopmental conditions? Cognitive Neuropsychology, 35(1-2), 59–62. https://doi.org/10.1080/02643294.2018.1433153
- Jones, R. D., & Tranel, D. (2001). Severe developmental prosopagnosia in a child with superior intellect. Journal of Clinical and Experimental Neuropsychology, 23(3), 265–273. https://doi.org/10.1076/jcen.23.3.265.1183
- Liesefeld, H. R., & Janczyk, M. (2019). Combining speed and accuracy to control for speed-accuracy trade-offs(?). Behavior Research Methods, 51(1), 40–60. https://doi.org/10.3758/s13428-018-1076-x
- Liesefeld, H. R., & Janczyk, M. (2023). Same same but different: Subtle but consequential differences between two measures to linearly integrate speed and accuracy (LISAS vs. BIS). Behavior Research Methods, 55(3), 1175–1192. https://doi.org/10.3758/s13428-022-01843-2
- Lowes, J., Hancock, P. J. B., & Bobak, A. K. (2024). A new way of classifying developmental prosopagnosia: Balanced integration score. Cortex, 172, 159–184. https://doi.org/10.1016/j.cortex.2023.12.011
- Meyer, K., Schmitz, F., Wilhelm, O., & Hildebrandt, A. (2019). Perceiving faces: Too much, too fast?—face specificity in response caution. Journal of Experimental Psychology: Human Perception and Performance, 45(1), 16–38. https://doi.org/10.1037/xhp0000582
- Mishra, M. V., Fry, R. M., Saad, E., Arizpe, J. M., Ohashi, Y.-G. B., & DeGutis, J. M. (2021). Comparing the sensitivity of face matching assessments to detect face perception impairments. Neuropsychologia, 163, Article 108067. https://doi.org/10.1016/j.neuropsychologia.2021.108067
- Murray, E., Bennetts, R., Tree, J., & Bate, S. (2022). An update of the Benton facial recognition test. Behavior Research Methods, 54(5), 2318–2333. https://doi.org/10.3758/s13428-021-01727-x
- Murray, E., Hills, P. J., Bennetts, R. J., & Bate, S. (2018). Identifying hallmark symptoms of developmental prosopagnosia for non-experts. Scientific Reports, 8(1), 1690–1690. https://doi.org/10.1038/s41598-018-20089-7
- Nunn, J. A., Postma, P., & Pearson, R. (2001). Developmental prosopagnosia: Should it be taken at face value? Neurocase, 7(1), 15–27. https://doi.org/10.1093/neucas/7.1.15
- Nussenbaum, K., Scheuplein, M., Phaneuf, C. V., Evans, M. D., & Hartley, C. A. (2020). Moving developmental research online: Comparing in-lab and web-based studies of model-based reinforcement learning. Collabra: Psychology, 6(1). https://doi.org/10.1525/collabra.17213
- R Core Team. (2021). R: The R project for statistical computing. R: A language and environment for statistical computing.
- Riddoch, M. J., & Humphreys, G. W. (1993). Birmingham object recognition battery. Lawrence Erlbaum Associates.
- Rossion, B., & Michel, C. (2018). Normative accuracy and response time data for the computerized Benton facial recognition test (BFRT-c). Behavior Research Methods, 50(6), 2442–2460. https://doi.org/10.3758/s13428-018-1023-x
- Ruxton, G. D. (2006). The unequal variance t-test is an underused alternative to student’s t-test and the Mann–Whitney U test. Behavioral Ecology, 17(4), 688–690. https://doi.org/10.1093/beheco/ark016
- Shah, P., Gaule, A., Gaigg, S. B., Bird, G., & Cook, R. (2015). Probing short-term face memory in developmental prosopagnosia. Cortex, 64, 115–122. https://doi.org/10.1016/j.cortex.2014.10.006
- Tsantani, M., Vestner, T., & Cook, R. (2021). The Twenty Item Prosopagnosia Index (PI20) provides meaningful evidence of face recognition impairment. Royal Society Open Science, 8(11), Article 202062. https://doi.org/10.1098/rsos.202062
- Wilmer, J. B. (2017). Individual differences in face recognition: A decade of discovery. Current Directions in Psychological Science, 26(3), 225–230. https://doi.org/10.1177/0963721417710693