
Abstract
Objectives: Reactive oxygen species-mediated cell death contributes to the pathophysiology of cardiovascular disease and myocardial dysfunction. We recently showed that mitochondrial NADP+-dependent isocitrate dehydrogenase (IDH2) functions as an antioxidant and anti-apoptotic protein by supplying NADPH to antioxidant systems.
Methods: In the present study, we demonstrated that H2O2-induced apoptosis and hypertrophy of H9c2 cardiomyoblasts was markedly exacerbated by small interfering RNA (siRNA) specific for IDH2.
Results: Attenuated IDH2 expression resulted in the modulation of cellular and mitochondrial redox status, mitochondrial function, and cellular oxidative damage. MitoTEMPO, a mitochondria-targeted antioxidant, efficiently suppressed increased caspase-3 activity, increased cell size, and depletion of cellular GSH levels in IDH2 siRNA-transfected cells that were treated with H2O2.
Discussion: These results indicated that the disruption of cellular redox balance might be responsible for the enhanced H2O2-induced apoptosis and hypertrophy of cultured cardiomyocytes by the attenuated IDH2 expression.
Introduction
Cardiac hypertrophy, an early milestone in the clinical course of heart failure, is an independent risk factor for future cardiac events associated with mortality and morbidity.Citation1 During ischemia–reperfusion injury, cardiomyocytes typically undergo oxidative stress mediated by reactive oxygen species (ROS).Citation2 Although ROS are essential for a variety of physiological processes,Citation3 excessive concentration of ROS may damage cellular components, compromise their function and thereby trigger a variety of adverse changes that are observed in heart failure.Citation4
In cardiomyocytes, mitochondria account for approximately 30% of the cardiomyocyte massCitation5 and are a constant source of ROS such as and H2O2, as a consequence of their normal aerobic metabolism to meet the demand of ATP synthesis by oxidative metabolism.Citation6 Cardiomyocyte mitochondria contain a highly active cellular antioxidant defense that helps in protecting them from the harmful effects of ROS. Mitochondrial NADP+-dependent isocitrate dehydrogenase (IDH2) plays a major role in the generation of mitochondrial NADPH and in the maintenance of the redox balance in mitochondria.Citation7 Thus, reduction in IDH2 activity may result in the disruption of redox homeostasis and it may induce cell death or increase cardiomyocyte sensitivity to oxidative stress.
Low-molecular-weight antioxidants, such as α-tocopherol and N-acetylcysteine, decrease mitochondrial oxidative damage in vitro.Citation8 In vivo, however, these traditional antioxidants have limited mitochondrial accumulation.Citation9 A major continued challenge, therefore, is to develop mitochondria-targeted antioxidant agents that can prevent mitochondrial oxidative damage and mitochondrial dysfunction.Citation9 Superoxide dismutase (SOD) mimetics have been shown to be protective against cell injury caused by ROS. Recently, it has been shown that treatment with the mitochondria-targeted antioxidant mitoTEMPO attenuated when given at the onset of angiotensin II infusion via decreased mitochondrial ROS.Citation10
In the present study, we demonstrated that the knockdown of IDH2 by RNA interference (RNAi) enhanced hydrogen peroxide (H2O2)-induced apoptosis and hypertrophy in H9c2 clonal myoblastic cells derived from embryonic rat heart, which can be an in vitro model for the hypoxia/reoxygenation caused by ischemia/reperfusion of the heart. H2O2 is a non-radical reactive oxygen species and a relatively stable diffusible molecule.Citation11 In addition, we also demonstrated that H2O2-induced apoptosis and hypertrophy in IDH2 knockdown H9c2 cells were effectively protected by a mitochondria-targeted antioxidant mitoTEMPO. This study provides basic information on the association of an antioxidant enzyme responsible to generate mitochondrial NADPH and cardiomyocyte hypertrophy under oxidative stress.
Materials and methods
Materials
MitoTEMPO was purchased from Alexis Corporation (San Diego, CA, USA). Rhodamine 123, 5-chloromethylfluorescein diacetate (CMF-DA), and 2′,7′-dichlorofluoroscin diacetate (DCFH-DA) were purchased from Molecular Probes (Eugene, OR, USA). Antibodies were obtained from Santa Cruz Biotechnology (Santa Cruz, CA, USA) and Cell Signaling (Beverly, MA, USA).
Cell culture
The rat ventricular myocardial cell line H9c2 was obtained from American Type Culture Collection (Manassas, VA, USA). Cells were maintained in glucose-free DMEM with 10% (v/v) heat-inactivated FBS, penicillin G (100 U/ml), streptomycin (100 mg/ml, and l-glutamine (2 mM) in a humidified atmosphere of 95% air and 5% CO2 at 37°C. H9c2 cells were transfected with 2.5 nM scrambled or 2.5 nM IDH2 siRNA. After incubation for 48 hours, cells were exposed to 0.5 mM H2O2.
siRNA knockdown of IDH2 expression
IDH2, the sense and antisense siRNA sequences were 5′-GACAUCCUGGCUCAAGGAUdTdT-3′ and 5′-AUCCUUGAGCCAGGAUGUCdTdT-3′, respectively. For the scrambled control, the sense and antisense siRNA sequences were 5′-CUGAUGACCUGAGUGAAUGdTdT-3′ and 5′-CAUUCACUCAGGUCAUCAGdTdT-3′, respectively. H9c2 cells were transfected with oligonucleotide using Lipofectamine RNAiMax (Invitrogen, Carlsbad, CA, USA) in serum-free conditions according to the manufacturer's protocol.
RNA isolation and reverse transcription (RT)-PCR
Total RNA from cultured cells was isolated using an RNeasy kit (Qiagen, Hilden, Germany) according to the manufacturer's instruction. The isolated RNA (1 μg) was reverse-transcribed into cDNA using a first-strand cDNA synthesis kit (Invitrogen) according to the manufacturer's protocol. The cDNA template was then amplified by quantitative RT–PCR using a Perkin-Elmer GeneAmp PCR System 2400 (Perkin-Elmer Cetus, Waltham, MA, USA) according to the manufacturer's protocol. Sequences of the primers used were as follows: β-actin, forward 5′-TCTACAATGAGCTGCGTGTG-3′, reverse 5′-ATCTCCTTCTGCATCCTGTC-3′; ANP, forward 5′-ATGGGCTCCTTCTCCATCAC-3′, reverse 5′-GCCAAAAGGCCAGGAAGAGG-3′. β-Actin was used as an internal control. The amplified DNA products were resolved in a 1% agarose gel and stained with ethidium bromide.
Caspase-3 activity assay
Cells were collected with a cell scraper, washed with PBS, mixed with lysis buffer (50 mM HEPES, pH 7.4, 100 mM NaCl, 0.1% CHAPS, 1 mM DTT, and 0.1 mM EDTA) for 10 minutes at 0°C, and centrifuged at 10 000 × g for 10 minutes at 4°C. Supernatant aliquots containing 100 μg of protein were then added to the reaction buffer (100 mM HEPES, pH 7.4, 0.5 mM PMSF, 10 mM dithiothreitol, 1 mM EDTA, and 10% glycerol) containing the chromogenic peptide substrate Ac-DEVD-pNA (Calbiochem, San Diego, CA, USA) and incubated for 2 hours at 37°C. The absorbance was then recorded at 405 nm to determine caspase activity in each sample.
Immunoblot analysis
The same amount of cell lysate (20 μg of protein) was separated on 10% SDS-PAGE. After electrophoresis, proteins were transferred onto nitrocellulose membranes and were incubated with primary antibodies followed by incubation with horseradish peroxidase-labelled anti-rabbit IgG. The immunoreactive bands were visualized by enhanced chemiluminescence (ECL) kit (Amersham Pharmacia Biotech, Buckinghamshire, UK) and exposed to X-ray film. Analysis of images was performed using the public domain ImageJ program using the ‘Gel Analysis’ function.
Assessment of cellular redox status and oxidative damage
Intracellular ROS generation was measured using the oxidant-sensitive fluorescent probe DCFH-DA. Cells were treated with 10 μM DCFH-DA for 30 minutes at 37°C and ROS levels were then analyzed by fluorescence microscopy. The concentration of total glutathione was determined by the rate of formation of 5-thio-2-nitrobenzoic acid at 412 nm (ε = 1.36 × 10⁴ M−1 cm−1) as previously described,Citation7 and GSSG was measured using a DTNB-GSSG reductase recycling assay. Intracellular GSH levels were also determined using the GSH-sensitive fluorescence dye CMF-DA. H9c2 cells were incubated with 5 μM CMF-DA for 30 minutes. The images of CMF-DA cell tracker fluorescence by GSH were analyzed by fluorescence microscopy. Malondialdehyde (MDA) production was measured with a spectrophotometric assay for TBARS as previously described.Citation7 For the comet assay, microscope slides were precoated with 40 μl of 0.3% normal agarose. The 15 μl of cell suspension were mixed with 150 μl of 0.7% low melting point agarose in PBS kept at 37°C on a hot plate. Immediately after mixing, 15 μl of suspension pipetted on slide, and covered with coverslip. The slides were left on ice for gel adhesion. When the gel solidified, coverslips were removed and immersed with lysis buffer (2.5 M NaCl, 100 mM EDTA, 10 mM Tris–NaOH, 1% Triton X-100, pH 10) at 4°C for 1 hour. After lysis, slides were rinsed in TAE buffer to remove the excess of salt, and subjected to electrophoresis using the neutral method (TAE, 2 V/cm, 30 mA for 20 minutes). Slides were then rinsed in distilled water and fixed with methanol. Finally, the DNA stained with Hoechst 33342 was immediately analyzed using a fluorescence microscope.
Evaluation of mitochondrial damage
To determine changes in the membrane potential transition (MPT) we stained mitochondria from H9c2 cells using rhodamine 123. The cells were incubated with 5 μg/ml of rhodamine 123 at 37°C for 30 minutes. After incubation at 37°C, the cells were washed three times with PBS and were observed at 530 nm under a fluorescence microscope.
Measurement of cell size
Relative changes in cell size were observed using a flow cytometer as previously described.Citation12 The cells were collected, washed with PBS, and pelleted by centrifugation at 300 × g for 5 minutes. The cell pellets were resuspended in PBS (1–2 ml) and analyzed using a flow cytometer. The cells (1 × 10⁴ cells) were screened, and the forward light scatter and side light scatter were recorded for each cell to determine relative cell size and density, respectively. Relative cell size was also determined after H&E staining. Cells grown on a glass slide were washed with PBS, and fixed with 2.5% formaldehyde for 20 minutes. Fixed cells were rinsed with distilled water for 5 minutes, and immersed in filtered Harris hematoxylin for 15–30 minutes at room temperature. Differentiation was performed in 1% HCl in 70% ethanol solution for 10–30 seconds, after rinsing with running tap water for 1 minute. Bluing solution (50 μl ammonium hydroxide in 70% ethanol) was used to recover the blue color of nuclei. After rinsing in tap water several times, eosin Y staining was performed for 2–3 minutes was followed. The glass slides were rinsed with running tap water for 5 minutes, and sequential dehydration (70, 80, 95% each once, 100% twice, xylene twice) was performed by dipping several times. Finally, the glass slides were air-dried and mounted with Canada balsam and coverslip. The pictures were obtained with using a microscope (Carl Zeiss, Axiovert 40 CFL).
Quantitation of relative fluorescence
The average of fluorescence intensity from fluorescence images was calculated as previously described.Citation13
Statistical analysis
Results were expressed as the mean ± SD. Statistical differences among groups (indicated at the Figures) were calculated using Student t-tests and one-way analysis of variance for comparison between two groups. P-values <0.05 were considered statistically significant.
Results and discussion
In this study, we investigated whether the knockdown of IDH2 could modulate apoptosis in H9c2 rat ventricular cells exposed to H2O2, a well-established model to study cardiomyocyte apoptosis associated with oxidative stress induced by ischemia/reperfusion of the heart.Citation14 We have previously demonstrated that 10 nM IDH2 siRNA alone induces cell death in cardiomyocytes.Citation13 The present results show that 2.5 nM IDH2 siRNA significantly exacerbates H2O2-induced cell death. Cardiomyocyte apoptosis has previously been shown to play a pivotal role in the pathogenesis of several heart dysfunctions related to ischemia–reperfusion injury, pressure overload, chronic heart failure, and the transition from compensated cardiac hypertrophy to heart failure.Citation15,Citation16 In this study, we wanted to determine if cardiomyocytes with suppressed IDH2 expression were more prone to undergo apoptosis in response to oxidative stress. At higher ROS levels, cellular division is stalled and cells undergo apoptosis after prolonged arrest.Citation17 p53 becomes activated by oxidative stress, binds to DNA, and activates the expression of several genes including p21, a protein that arrests cells in the G1 phase and modulates the kinase activity of various cyclin-dependent kinases.Citation18,Citation19 When H9c2 cells were exposed to H2O2, Western blot analysis revealed that the amount of p21 and phosphorylated p53 was increased and the level of CDK2 was decreased in the IDH2 siRNA-transfected cells compared to control cells (Fig. A). The effect of knocking down IDH2 expression on the modulation of apoptotic marker proteins in the H9c2 cells was examined next. As shown in Fig. B, cleavage of caspase-3 induced by H2O2 was more pronounced in IDH2 siRNA-transfected cells. In addition, the level of Bcl-XL was increased and the level of X-linked inhibitor of apoptosis protein (XIAP) was decreased in IDH2 siRNA-transfected cells compared to control cells upon exposure to H2O2. In order to determine the association between apoptosis and ER stress in H9c2 cells, several ER-specific markers were measured. As shown in Fig. C, C/EBP homologous protein (CHOP), endoplasmic reticulum oxidoreductin 1-α (ERO1-α), and membrane-bound transcription factor peptidase site 2 (MBTPS2) were markedly reduced in IDH2 siRNA-transfected cells as compared to control siRNA-transfected cells upon exposure to H2O2. This result indicates that ER stress responses may be involved in the survival pathway. Attenuated IDH2 activity confers suppression of ER stress, in which ER stress counteracts H2O2-induced apoptosis.
Figure 1 H2O2-induced apoptosis in IDH2 siRNA-transfected H9c2 cells. (A) Immunoblot analysis of cell cycle-associated proteins in scrambled (scr) or IDH2 siRNA-transfected H9c2 transfectant cells. Cell extracts were subjected to 10–12.5% SDS-PAGE and immunoblotted with antibodies specific for protein markers of cell cycle. β-Actin was used as an internal control. (B) Immunoblot analysis of apoptosis-related proteins in H9c2 cells. Cell extracts were subjected to SDS-PAGE using 10–12.5% gels and immunoblotted with antibodies specific for protein markers of apoptosis. (C) Modulation of ER stress marker proteins in H9c2 transfectant cells. (A–C) β-actin was used as an internal control. Bands were normalized to β-actin. Src, control cells; IDH2, IDH2 siRNA-transfected cells; HP, H2O2. (D) Images of rhodamine 123 staining indicative of MPT change and mitochondrial fragmentation.
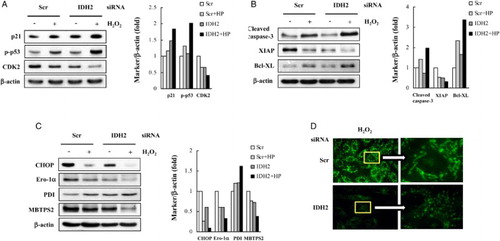
Mitochondria are common integrators and transducers of various proapoptotic signals, and mitochondrial MPT is the rate limiting manifestation of mitochondrial cell death.Citation20 Alteration of MPT indicated by the attenuation of rhodamine 123 fluorescence was more pronounced in the mitochondria of IDH2 siRNA-transfected cells than that of control cells (Fig. D). Mitochondrial morphology has become a new parameter for evaluating mitochondrial functionality and seems to coordinate with changes in the surrounding cellular milieu.Citation21 A shift toward mitochondrial fission will lead to mitochondrial fragmentation and fragmented mitochondria is casually associated with apoptotic cell death.Citation22 Rhodamine 123 staining indicated that suppression of IDH2 expression enhanced H2O2-induced mitochondrial fragmentation in which mitochondria were split into small pieces (Fig. D).
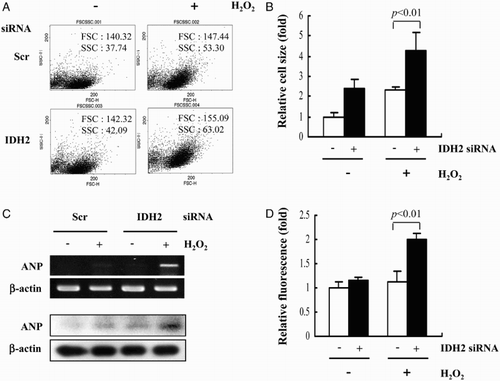
Next, the effect of IDH2 knockdown on H2O2-induced hypertrophy in H9c2 cells was investigated. The increase in heart muscle mass observed in cardiac hypertrophy is associated with an increase in myocyte size rather than number.Citation23 Cell size was measured using a flow cytometer 5 hours after the addition of H2O2. When treated with H2O2, H9c2 cell size was significantly increased by transfection with IDH2 siRNA (Fig. A). This finding was consistent with results obtained from the analysis of cell size by H&E staining (Fig. B). The effect of IDH2 knockdown on artrial natriuretic peptide (ANP) gene expression, a marker of cardiomyocyte hypertrophy,Citation24 was also assessed. As shown in Fig. C, ANP mRNA and protein expression increased significantly after the addition of H2O2 in IDH2 siRNA-transfected H9c2 cells compared to the control cells. It has previously been shown that the vimentin gene, a family of intermediate filaments that are thought to perform an organizing function in the cytoplasm, is up-regulated during cardiac hypertrophy.Citation25 Immunostaining of H9c2 cells indicated that vimentin was significantly up-regulated in IDH2 siRNA-transfected H9c2 cells after addition of H2O2 (Fig. D). These results suggest that knockdown of IDH2 resulted in the enhancement of hypertrophy development in H2O2-treated H9c2 cells.
Figure 2 H2O2-induced cardiomyocyte hypertrophy in IDH2 siRNA-transfected H9c2 cells. (A) H9c2 cell size was measured by FACS. (B) H9c2 cell size was measured by microscopy after H&E staining. Data are presented as the mean ± SD of three separate experiments. (C) The levels of ANP mRNA and protein were determined with RT–PCR and immunoblotting analysis, respectively. β-Actin was used as an internal control. (D) Immunofluorescence analysis of H9c2 transfectant cells using an anti-vimentin antibody. The average of fluorescence intensity was calculated as previously described.Citation13Data are presented as the mean ± SD of three separate experiments.
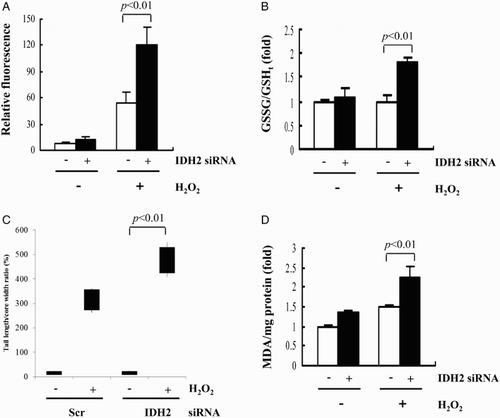
One potential mechanism for H2O2-induced cell damage is the secondary generation of ROS.Citation26 Therefore, intracellular levels of ROS were determined using the oxidant-sensitive probe DCFH-DA and fluorescence microscopy. As shown in Fig. A, an increase in DCF fluorescence was observed in H9c2 cells when they were exposed to H2O2. The increase in fluorescence was significantly enhanced in IDH2 siRNA-transfected cells. The [GSSG]/[GSHt] ratio, which reflects the efficiency of GSH turnover was significantly higher in IDH2 siRNA-transfected cells compared to the control cells (Fig. B). Mitochondrial NADPH, required for GSH generation by glutathione reductase in mitochondria, is an essential factor for the mitochondrial antioxidant system.Citation7 Previously, we demonstrated that IDH2 knockdown induces the attenuation of the mitochondrial [NADPH]/[NADP + NADPH] ratio.Citation13 We suggest that mitochondrial GSH recycling rely on NADPH within the mitochondria, independent from cytosolic NADPH producers such as glucose 6-phosphate dehydrogenase and cytosolic NADP+-dependent isocitrate dehydrogenase (IDH1). Oxidative DNA damage and lipid peroxidation were evaluated as markers indicative of cellular oxidative damage. To directly evaluate DNA strand breaks by H2O2, we measured overall DNA fragmentation using Comet assay. As shown in Fig. C, the Comet assay revealed that the induction of DNA damage following H2O2 treatment was enhanced by knockdown of IDH2. In this assay, damaged DNA presents the shape of a comet of which the tail length is related to the number of DNA strand breaks. To determine whether IDH2 knockdown increased the sensitivity to oxidative stress, we measured MDA levels in transfected cardiomyocytes. The MDA level of IDH2 siRNA-transfected cells was significantly higher than that observed in control cells (Fig. D). Taken together, these results indicate that decreased activity of IDH2 by siRNA enhanced H2O2-mediated ROS generation and subsequently induced oxidative damage of H9c2 cells.
Figure 3 H2O2-induced modulation of cellular redox status and oxidative damage of H9c2 transfectant cells. (A) ROS levels in the transfected H9c2 cells were measured using a fluorescence microscope after staining with DCF-DA. The average of fluorescence intensity was calculated as previously described.Citation13 (B) GSSG versus total GSH concentrations in H9c2 transfectant cells. (C) The Comet assay analysis of H9c2 cells and the tail length/core width ratio obtained from captured images. (D) Levels of MDA accumulated in cell extracts were determined using a TBARS assay. (A–D) Data are presented as the mean ± SD of three separate experiments.
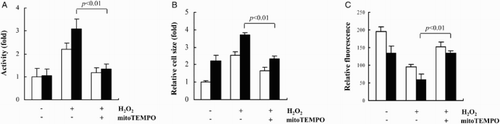
The association between the shift in redox balance to a prooxidant state and H2O2-mediated apoptosis and hypertrophy of IDH2 siRNA-transfected cells was confirmed further by the protecting effect of mitoTEMPO, which is a mitochondria-targeted SOD mimetic. As shown in Fig. , the pretreatment of the cells with 2 μM mitoTEMPO for 1 hour efficiently suppressed increased caspase-3 activity, increased cell size, and depletion of cellular GSH levels in IDH2 siRNA-transfected cells that were treated with H2O2. In conclusion, the disruption of the cellular redox balance by the knockdown of an antioxidant enzyme responsible for the generation of mitochondrial NADPH exacerbates apoptosis and hypertrophy in cardiomyocytes under oxidative stress.
Figure 4 The effect of mitoTEMPO on H2O2-induced apoptosis and hypertrophy of H9c2 transfectant cells. The transfected H9c2 cells were pretreated with 2 μM mitoTEMPO for 1 hour and exposed to H2O2. (A) Activation of caspase 3 in H9c2 transfectant cells was determined by colorimetric assay. (B) H9c2 cell size was measured by microscopy after H&E staining. (C) Total GSH was determined by fluorescence measured in the images of CMF-DA-loaded cells. The average of fluorescence intensity was calculated as previously described.Citation13 (A–C) Open and shaded bars represent H9c2 cells transfected with scrambled siRNA and IDH2 siRNA, respectively. Data are presented as the mean ± SD of three separate experiments.
Disclaimer statements
Contributors All authors contributed equally.
Funding This work was supported by the National Research Foundation of Korea (NRF) grant funded by the Korea government (MSIP) (Grant No. NRF-2015R1A4A1042271).
Conflict of interest There are no conflicts of interest.
Ethical approval Ethical approval was not required. No human subjects or animals involved this research.
References
- Barger PM, Kelly DP. PPAR signaling in the control of cardiac energy metabolism. Trends Cardiovasc Med 2000;10:238–45. doi: 10.1016/S1050-1738(00)00077-3
- Finkel T. Signal transduction by reactive oxygen species. J Cell Biol 2011;194:7–15. doi: 10.1083/jcb.201102095
- Droge W. Free radicals in the physiological control of cell function. Physiol Rev 2002;82:47–95. doi: 10.1152/physrev.00018.2001
- Canton M, Menazza S, Sheeran FL, Polverino de Laureto P, Di Lisa F, Pepe S. Oxidation of myofibrillar proteins in human heart failure. J Am Coll Cardiol 2011;57:300–9. doi: 10.1016/j.jacc.2010.06.058
- Barth E, Stämmler G, Speiser B, Schaper J. Ultrastructural quantitation of mitochondria and myofilaments in cardiac muscle from 10 different animal species including man. J Mol Cell Cardiol 1992;24:669–81. doi: 10.1016/0022-2828(92)93381-S
- Downey JM. Free radicals and their involvement during long-term myocardial ischemia and reperfusion. Annu Rev Physiol 1990;52:487–504. doi: 10.1146/annurev.ph.52.030190.002415
- Jo SH, Son MK, Koh HJ, Lee SM, Song IH, Kim YO, et al. Control of mitochondrial redox balance and cellular defense against oxidative damage by mitochondrial NADP+-dependent isocitrate dehydrogenase. J Biol Chem 2001;276:16168–76. doi: 10.1074/jbc.M010120200
- Ernster L, Forsmark P, Nordenbrand K. The mode of action of lipid-soluble antioxidants in biological membranes: relationship between the effects of ubiquinol and vitamin E as inhibitors of lipid peroxidatin in submitochondrial particles. Biofactors 1992;3:241–8.
- Murphy MP, Smith RA. Drug delivery to mitochondria: the key to mitochondrial medicine. Adv Drug Deliv Rev 2000;41:235–50. doi: 10.1016/S0169-409X(99)00069-1
- Dikalova AE, Bikineyeva AT, Budzyn K, Nazarewicz RR, McCann L, Lewis W, et al. Therapeutic targeting of mitochondrial superoxide in hypertension. Cir Res 2010;107:106–16. doi: 10.1161/CIRCRESAHA.109.214601
- Schröder E, Eaton P. Hydrogen peroxide as an endogenous mediator and exogenous tool in cardiovascular research: issues and considerations. Curr Opin Pharmacol 2008;8:153–9. doi: 10.1016/j.coph.2007.12.012
- Zhou Y, Jiang Y, Kang YJ. Copper reverses cardiomyocyte hypertrophy through vascular endothelial growth factor-mediated reduction in the cell size. J Mol Cell Cardiol 2008;45:106–17. doi: 10.1016/j.yjmcc.2008.03.022
- Lee JH, Park J-W. Attenuated mitochondrial NADP+-dependent isocitrate dehydrogenase activity induces apoptosis and hypertrophy of H9c2 cardiomyocytes. Biochimie 2014;90:110–8. doi: 10.1016/j.biochi.2013.11.016
- Han H, Long H, Wang H, Wang J, Zhang Y, Wang Z. Progressive apoptotic cell death triggered by transient oxidative insult in H9c2 rat ventricular cells: a novel pattern of apoptosis and the mechanisms. Am J Physiol Heart Circ Physiol 2004;286:H2169–82. doi: 10.1152/ajpheart.00199.2003
- Gill C, Mestril R, Samali A. Losing heart: the role of apoptosis in heart disease – a novel therapeutic target? FASEB J 2002;16:135–46. doi: 10.1096/fj.01-0629com
- Foo RS, Mani K, Kitsis RN. Death begets failure in the heart. J Clin Invest 2005;115:565–71. doi: 10.1172/JCI24569
- Burhans WC, Heintz NH. The cell cycle is a redox cycle: linking phase-specific targets to cell fate. Free Radic Biol Med 2009;47:1282–93. doi: 10.1016/j.freeradbiomed.2009.05.026
- Zetterberg A, Larsson O, Wiman KG. What is the restriction point? Curr Opin Cell Biol 1995;7:835–42. doi: 10.1016/0955-0674(95)80067-0
- Yu Y, Kovacevic Z, Richardson DR. Tuning cell cycle regulation with an iron key. Cell Cycle 2007;6:1982–94. doi: 10.4161/cc.6.16.4603
- Green DR, Reed JC. Mitochondria and apoptosis. Science 1998;281:1309–12. doi: 10.1126/science.281.5381.1309
- Galloway CA, Lee H, Yoon Y. Mitochondrial morphology-emerging role in bioenergetics. Free Radic Biol Med 2012;53:2218–28. doi: 10.1016/j.freeradbiomed.2012.09.035
- Yu T, Sheu SS, Robotham JL, Yoon Y. Mitochondrial fission mediates high glucose-induced cell death through elevated production of reactive oxygen species. Cardiovasc Res 2008;79:341–351. doi: 10.1093/cvr/cvn104
- Abel ED, Doenst T. Mitochondrial adaptations to physiological vs. pathological cardiac hypertrophy. Cardiovasc Res 2011;90:234–42. doi: 10.1093/cvr/cvr015
- Iwai N, Shimoike H, Kinoshita M. Genes up-regulated in hypertrophied ventricle. Biochem Biophys Res Commun 1995;209:527–34. doi: 10.1006/bbrc.1995.1533
- Fang L, Moore XL, Gao XM, Dart AM, Lim YL, Du XJ. Down-regulation of mitofusin-2 expression in cardiac hypertrophy in vitro and in vivo. Life Sci 2007;80:2154–60. doi: 10.1016/j.lfs.2007.04.003
- Zorov DB, Filburn CR, Klotz LO, Zweier JL, Sollott SJ. Reactive oxygen species (ROS)-induced ROS release: a new phenomenon accompanying induction of the mitochondrial permeability transition in cardiac myocytes. J Exp Med 2000;192:1001–14. doi: 10.1084/jem.192.7.1001