
Abstract
Oxidative stress and excessive nitric oxide production via induction of inducible nitric oxide synthase (NOS)-2 have been shown in the pathogenesis of liver ischemia–reperfusion (IR) injury. Neutral sphingomyelinase (N-SMase)/ceramide pathway can regulate NOS2 expression therefore this study determined the role of selective N-SMase inhibition on nitrative and oxidative stress markers following liver IR injury. Selective N-SMase inhibitor was administered via intraperitoneal injections. Liver IR injury was created by clamping blood vessels supplying the median and left lateral hepatic lobes for 60 min, followed by 60 min reperfusion. Nitrative and oxidative stress markers were determined by evaluating NOS2 expression, protein nitration, nitrite/nitrate levels, 4-hydroxynonenal (HNE) formation, protein carbonyl levels and xanthine oxidase/xanthine dehydrogenase (XO/XDH) activity. Levels of sphingmyelin and ceramide in liver tissue were determined by an optimized multiple reaction monitoring method using ultra-fast liquid chromatography coupled with tandem mass spectrometry (MS/MS). Spingomyelin levels were significantly increased in all IR groups compared to controls. Treatment with a specific N-SMase inhibitor significantly decreased all measured ceramides in IR injury. NOS2 expression, nitrite/nitrate levels and protein nitration were significantly greater in IR injury and decreased with N-SMase inhibition. Treatment with a selective N-SMase inhibitor significantly decreased HNE formation, protein carbonyl levels and the hepatic conversion of XO. Data confirm the role of nitrative and oxidative injury in IR and highlight the protective effect of selective N-SMase inhibition. Future studies evaluating agents blocking N-SMase activity can facilitate the development of treatment strategies to alleviate oxidative injury in liver I/R injury.
Introduction
Partial or mostly total interruption of hepatic blood flow is often necessary when liver surgery is performed. This interruption of blood flow is termed ‘warm ischemia’ and upon revascularization, when molecular oxygen is reintroduced, the organ undergoes a process called ‘reperfusion injury’ that causes deterioration of organ function. Warm hepatic ischemia–reperfusion (IR) injury occurs in many clinical conditions such as liver transplantation, hepatic surgery for tumor excision, trauma and hepatic failure after hemorrhagic shock.Citation1
The initial phase of warm IR injury is characterized by reactive oxygen species (ROS) production from Kupffer cells. Kupffer cell activation in the initial phase of reperfusion injury produces morphological changes in the cell which makes it protrude into the sinusoids, contributing to the reduction of blood flow within the sinusoidal lumen. The initial phase of liver injury is also associated with neutrophil accumulation which contributes to post-ischemic oxidant stress during reperfusion.Citation2
Activation of Kupffer cells leads to the release of significant amounts of pro-inflammatory cytokines tumor necrosis factor (TNF)-α.Citation3 The major effect of TNF-α is to induce hepatocellular and endothelial injury. Leukocyte chemotaxis, neutrophil activation, upregulation of free radical production, mitochondrial toxicity and apoptotic cell death through activation of caspases also occur as a result of TNF-α production.Citation4
Liver ROS generation due to IR injury can be through xanthine oxidoreductase activity, autoxidation of mitochondrial respiratory chain components, and activated nicotinamide adenine dinucleotide phosphate oxidase.Citation5 Upregulation of inducible nitric oxide synthase (NOS)-2 expression and elevated tissue nitrite and nitrate levels are documented in animal models of liver IR injury.Citation6 IR-induced tissue injury is attenuated in liver of NOS-2–/– mice.Citation7 Increased nitric oxide (NO) generation observed in warm hepatic IR injury causes cytotoxicity through direct reactions of NO with ROS and the formation of secondary species capable of oxidation and nitration reactions.
Accumulation of ceramide and alteration of sphingolipid metabolism have been demonstrated in IR injury.Citation8 It has become increasingly clear that ceramide is a membrane sphingolipid and is a key mediator of cell stress responses that play a critical role in IR-induced mitochondrial damage.Citation8 In fact reported data point to excessive ceramide accumulation in hepatic tissue following warm liver IR.Citation9
Ceramide can be generated through de novo synthesis, hydrolysis of sphingomyelin by sphingomyelinase (SMase) and breakdown of glycosphingolipids.Citation10 Among the different types of SMase that are present, acid and neutral SMase (N-SMase) enzymes have been investigated in response to warm liver IR.Citation9 N-SMase is localized in sphingolipid rich membrane fractionsCitation11 which constitute the structural basis for its functional interaction with NOS.Citation12 Both NOS2 and endothelial NOS (NOS3) enzymes are localized at plasma membranes via interaction with caveolin-3 and/or caveolin-1 proteins.Citation13 Changes in N-SMase activity associated with cellular stress responses have been reported to affect NOS3 and nitric oxide bioavailability.Citation14 Similarly, it was shown that ceramide production by N-SMase is a key mediator in the induction of NOS2.Citation15 Here, we used a rat model to investigate the role of N-SMase in modulating NOS2, nitrative and oxidative stress in warm liver IR injury. To our knowledge this is the first study to determine the role of selective N-SMase inhibition on oxidative and nitrative stress following liver IR injury.
Materials and methods
Animals
All experimental protocols conducted on rats were performed in accordance with the standards established by the Institutional Animal Care and Use Committee at Akdeniz University Medical School. Male Wistar rats weighing 350–450 g were housed in stainless steel cages and were allowed free access to standard rat chow. Animals were maintained at 12 h light-dark cycles and a constant temperature of 23 ± 1°C at all times. N-SMase inhibition was initiated 72 h before liver IR injury was carried out. A selective N-SMase inhibitor, GW 4869 (1.25 mg/kg), was administered daily via intraperitoneal (ip) injections as previously described.Citation16 GW4869 hydrate (Sigma-Aldrich, St. Louis, MO, USA) was dissolved in saline with 2.5% DMSO. It was previously reported that this dose of GW4869 does not produce any adverse effects, does not alter the sphingomyelin or ceramide content of heart, skeletal muscle and liver.Citation17 Dimethyl sulfoxide treated rats were-injected with the same volume of vehicle used to dissolve GW4869 (2.5% DMSO).
Rat model of hepatic IR injury
Animals were fasted 12 h before surgery, but allowed to drink tap water ad libitum. Rats were anesthetized with urethane anesthesia (1.2 g/kg subcutaneously). A model of lobar (70%) hepatic warm ischemia was performed according to a method previously described.Citation18 After shaving and disinfecting the abdomen with betadine, a complete midline incision was made. The portal vein was exposed and vessels supplying the median and left lateral hepatic lobes were clamped for 60 min. Reperfusion followed for 60 min via removal of the microvascular clip. The caudal and right lobes retained an intact portal and arterial blood flow, in addition to venous outflow. These lobes served as control and also prevented intestinal congestion. The abdomen was kept closed throughout the experimental period and body temperature was maintained by placing rats under warming lamps. Blood samples were obtained before and after the experiment, from the tail vein and the right ventricle, respectively. At the end of the experimental period, liver was perfused with 0.9% NaCl injected from the left ventricle en route for inferior vena cava. Tissue samples obtained from the left and median lobes of the liver accounted for I/R while dissected right lateral and caudate lobes served as non-ischemic group. Obtained liver tissues were either flash frozen in liquid nitrogen and stored at −70°C; or fixed for histological evaluation.
The rat model of hepatic IR injury performed in our study allowed us to obtain both control and IR-injured tissue from the same liver. Tissue samples obtained from the left and median lobes of the liver accounted for IR, whereas dissected right lateral and caudate lobes served as the non-ischemic group. From this standpoint, control and IR livers (n = 10) were obtained from rats that underwent IR injury. GW and GW+IR livers were obtained from rats that were treated with GW4869 and underwent IR injury (n = 10). DMSO and DMSO+IR livers were obtained from rats that were treated with 2.5% DMSO and underwent IR injury (n = 4). Sham livers (n = 5) were obtained from rats in which only laparotomy was performed.
Histopathological evaluation of liver sections
Paraffin sections stained with hematoxylin and eosin were evaluated by two pathologists blinded to the experimental condition. Twenty high-power fields (HPF, 200×) were evaluated in all sections for congestion, intracellular edema and necrosis as previously described.Citation19 Congestion and intracellular edema was scored as follows: 0 = none, 1 = present in zone III, 2 = present in zones II-III, 3 = present in zones I-II-III. Necrosis was scored as follows: 0 = none, 1 = single or focal necrosis, 2 = submassive necrosis, 3 = massive necrosis+infarction. Total histopathological score was obtained by summation of all scores given to each parameter.
Measurement of N-SMase activity
Neutral-SMase activity was measured in liver tissue via a sphingomyelinase assay kit (Biovision, Catalog # K599–100, Milpitas, CA, USA). In this assay, SMase converts sphingomyelin substrate to phosphocholine and ceramide, which is then further utilized to produce an intermediate that reacts with a highly specific probe to generate color which is measured colorimetrically at 570 nm. A standard curve of absorbance values of known amounts of choline standards was generated. One unit of sphingomyelinase activity was defined as the amount of enzyme that caused the formation of 1 μmol of choline per minute at 37°C. Sphingomyelinase activity in the samples (nmol/min/mL) was calculated from their corresponding absorbance values via the standard curve.
Measurement of serum alanine aminotransferase
Serum alanine aminotransferase activity was measured via an alanine transaminase assay kit (Cayman Chemical, Cat No. 700260, Ann Arbor, MI, USA). The rate of NADH oxidation was monitored by a coupled reaction system using lactate dehydrogenase (LDH). One unit of enzyme activity was defined as the amount of enzyme that caused the oxidation of 1 μmol of NADH to NAD+ per minute at 37°C.
Xanthine oxidase/xanthine dehydrogenase enzyme activity measurements
All tissues were weighed and homogenized in ice-cold 50 mmol/L sodium phosphate buffer (pH 7.4). Homogenates were centrifuged (23 000g for 40 min at 4°C) and supernatants were stored at −80°C. Xanthine oxidase/xanthine dehydrogenase (XO/XDH) activity was determined with a fluorimetric assay described previously.Citation20 This assay is based on the conversion of pterin to the fluorescent product isoxanthopterin and is performed with and without methylene blue to determine XO/XDH activity and XO activity, respectively.
Immunohistochemical staining
Liver tissues were fixed in 10% buffered formalin solution, washed in phosphate-buffered saline (pH 7.4), embedded in paraffin, and cut into 4-μm sections. For peroxidase staining, sections were deparaffinized, rehydrated and washed with tris buffered saline. Endogenous peroxidase activity was blocked by incubating tissue sections with 3% hydrogen peroxide for 5 min prior to application of the primary antibody. Primary antibody incubations were for 60 min at 25°C using rabbit polyclonal anti-nitrotyrosine (NO2Tyr) (1:50, Cayman Chemical, Ann Arbor, MI, USA), NOS2 (1:50, sc-649, Santa Cruz Biotechnology, Inc., USA), anti-hydroxynonenal (HNE)-Michael adducts (1:50, Cat. No. 393207, Calbiochem, USA). After sections were washed they were immunostained with an avidin biotin complex kit (Dako, Carpinteria, CA) followed by hematoxylin counterstaining. Negative controls were performed by replacing the primary antibody with non-immune serum followed by immunoperoxidase staining. The presence of a red-brown colored end-product in the cytoplasm was indicative of positive staining. Counterstaining with hematoxylin resulted in a pale to dark blue coloration of cell nuclei. All stained tissue sections were visualized via light microscopy (Olympus IX81, Tokyo, Japan). To obtain a quantitative standard for immunostaining within the different experimental groups morphometric analysis was performed as previously described.Citation21 The percentage of positive stained cells was scored as follows: 0, less than 5% of the cells/HPF (40X) are stained; 1, 5% to less than 30% of cells/HPF are stained; 2, 30% to less than 50% of cells/HPF are stained; 3, more than 50% of cells/HPF are stained. The intensity of staining within each counted cell was also scored as follows: 0, no staining; 1, weak staining (pale red-brown); 2, moderate staining (red-brown); 3, strong staining (dark red-brown). A final immunostaining score was obtained for all sections by adding the two scores.
Measurement of sphingomyelins and ceramides
Standards for N-palmitoyl-D-erythro-sphingosylphosphorylcholine (C16 sphingomyelin), N-stearoyl-D-erythro-sphingosylphosphorylcholine (C18 sphingomyelin), N-lignoceroyl-D-erythro sphingosylphosphorylcholine (C24 sphingomyelin) N-palmitoyl-D-erythro-sphingosine (C16 Ceramide), N-stearoyl-D-erythro-sphingosine (C18 Ceramide), N-arachidoyl-D-erythro-sphingosine (C20 Ceramide), N-behenoyl-D-erythro-sphingosine (C22 Ceramide) and N-lignoceroyl-D-erythro-sphingosine (C24 Ceramide) were purchased from Avanti Polar Lipids (Alabaster, AL, USA). Labeled C16 ceramide d18:1/16:0 (Palmitoyl-U-13C16) internal standard was obtained from Cambridge Isotope Laboratories (Andover, MA, USA). Solutions of each sphingolipid standard was prepared in methanol (Sigma-Aldrich, St. Louis, MO, USA) at 40°C with sonication. An optimized multiple reaction monitoring (MRM) method was developed using ultra-fast liquid chromatography (UFLC) coupled with tandem mass spectrometry (MS/MS) as previously described.Citation22,Citation23 A UFLC system (LC-20 AD UFLC XR, Shimadzu Corporation, Japan) was coupled to a LCMS-8040 triple quadrupole mass spectrometer (Shimadzu Corporation, Japan). Chromatographic separations were carried out using an HPLC column (XTerra C18, 2.1 mm×50 mm, Waters, MA, USA) maintained at 60°C. Sphingolipids were separated using a gradient elution with a flow rate of 0.45 mL/min. Mobile phase solvent A was water–acetonitrile–2-propanol (8:1:1, v/v/v) with 10 mM ammonium formate and solvent B was acetonitrile–2-propanol (9:1, v/v). Gradient program was solvent B, 65% (0–2 min), 90% (2.01–13 min), 100% (13.01–20 min) and 65% (20.1–23 min). MRM transitions and responses were automatically optimized for individual compounds in positive electrospray ionization (ESI). In the positive ESI-MS mode the precursor and product m/z values for all analyzed sphingolipids are given in Table . Responses to analyzed sphingolipids were optimized to a linear calibration range from 39 to 625 ng/mL and a sample analysis time of 23 min.
Table 1 The precursor and product m/z values for analyzed sphingolipids
Preparation of samples for mass spectrometric analysis
Liver samples were weighed and homogenized in ice-cold 50 mmol/L sodium phosphate buffer at pH 7.4. Homogenates were centrifuged (10 000g for 15 min at 4°C) and supernatants were stored at −80°C until lipid extraction. Lipid extraction from liver tissue was done with minor modifications as previously described.Citation22 Two μL of 5 µg/mL internal standard solution was added to 500 μL of tissue supernatant. Samples were briefly vortexed and 375 μL of chloroform/methanol (1:2, v/v) was added. The samples were sonicated for 30 sn and 100 μL of water was added. The mixtures were vortexed for 5 min and stood at room temperature for 30 min. After centrifugation at 2000g for 5 min, the supernatant was taken and 125 μL of chloroform and 125 μL of water was added. The samples were vortexed and stood for 30 min for phase separation. The upper organic layer was transferred to glass tubes and evaporated at room temperature under a constant stream of nitrogen with height adjustable gas distribution unit (VLM, Bielefeld, Germany). The dried residue was dissolved in 100 μL of methanol and 10 ul was injected into the column.
Nitrite and nitrate assay
Samples were transferred to an ultrafiltration unit and centrifuged through a 10-kDa molecular mass cut-off filter (Amicon, Millipore Corporation, Bedford, MA, USA) for 1 h to remove protein. Analyses were performed in duplicate using a fluorometric assay kit (Cayman Chemical, Cat. No. 780051, Ann Arbor, MI, USA).
Measurement of nitrotyrosine levels
Nitrotyrosine content in the liver homogenates was measured via ELISA using a commercial kit (Cat. no. STA-305, Cell Biolabs, Inc., San Diego, CA, USA). Antigen captured by a solid phase monoclonal antibody (nitrated keyhole limpet hemocyanin raised in mouse) was detected with a biotin-labeled goat polyclonal anti-nitrotyrosine. A streptavidin peroxidase conjugate was then added to bind the biotinylated antibody. A TMB substrate was added and the yellow product was measured at 450 nm. A standard curve of absorbance values of known nitrotyrosine standards was plotted as a function of the logarithm of nitrotyrosine standard concentrations using the GraphPad Prism Software program for windows version 5.03. (GraphPad Software, Inc.) Nitrotyrosine concentrations in the samples were calculated from their corresponding absorbance values via the standard curve.
Measurement of HNE-His protein adducts
The amount of HNE-His protein adducts in liver homogenates was measured via ELISA using a commercial kit (Cat. no. STA-334, Cell Biolabs, Inc., San Diego, CA, USA). The quantity of HNE-His adduct in protein samples was determined by comparing its absorbance with that of a known HNE-BSA standard curve. HNE concentrations in the samples were expressed as μg/mg protein.
Measurement of tissue protein carbonyl content
Protein-bound carbonyls were measured via a protein carbonyl assay kit (Cat. No. 10005020 Cayman Chemical, Ann Arbor, MI). The utilized method is based on the covalent reaction of the carbonylated protein side chain with 2,4-dinitrophenylhydrazine (DNPH) and detection of the produced protein-hydrazone at an absorbance of 370 nm. The results were calculated using the extinction coefficient of 22 mM−1 cm−1 for aliphatic hydrazones and were expressed as nmol/mg protein.
Protein measurements
Protein concentrations were measured at 595 nm by a modified Bradford assay using Coomassie Plus reagent with bovine serum albumin as a standard (Pierce Chemical).
Statistical analysis
Statistical analysis was performed using SigmaStat statistical software version 2.0. Statistical analysis for each measurement is described in the figure and table legends.
Results
Analysis of liver IR injury
Hepatic photomicrographs of a representative rat from each group are shown in Fig. . Histopathological scores of liver IR injury are given in Table . Congestion, intracellular edema and total histopathological score were significantly greater in IR and DMSO+IR when compared to control, GW, sham and DMSO groups.
Figure 1 Hematoxylin and eosin staining of liver sections. Hepatic photomicrographs of representative rat are shown from each of the experimental groups. Magnification: 20×. CV, central vein; IR, ischemia–reperfusion; GW, animals treated with GW 4869; DMSO, group treated with dimethyl sulfoxide. Bar, 200 µm.
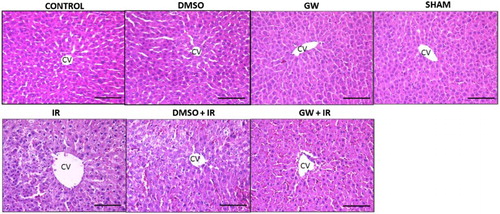
Table 2 Histopathological scores of liver sections
N-SMase, ALT, XO and XDH enzyme activity
Biochemical results of enzyme activity measurements are given in Table . Liver N-SMase activity was significantly increased in IR and DMSO+IR groups when compared to control, GW, sham and DMSO groups. Treatment with a specific N-SMase inhibitor decreased N-SMase activity in GW treated IR injury group. Plasma ALT levels were significantly increased in all IR groups. Liver XDH levels and XDH/XO ratio were significantly decreased in IR and DMSO+IR groups. The XDH/XO ratio returned to control levels in GW treated IR injury group.
Table 3 Activity of neutral N-SMase, alanine aminotransferase, XO and xanthine dehydrogenase
NOS-2 expression and nitrite/nitrate concentrations
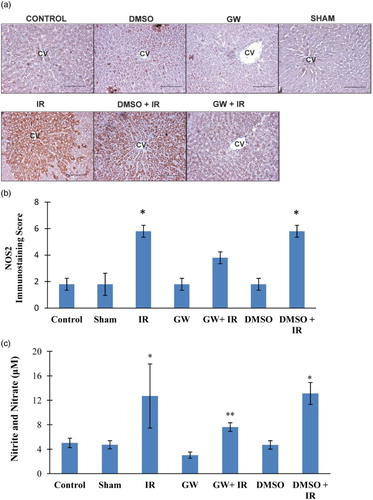
Figure A shows hepatic photomicrographs representative from each experimental group. Increased NOS2 staining was localized to the pericentral hepatocytes in both IR groups and not as evident in the control, DMSO, GW and sham groups. The immunostaining scores, obtained according to both the percentage and intensity of positive stained cells were statistically increased in IR and DMSO+IR group rats compared to control, sham, GW and DMSO groups (Fig. B). No significant difference was found in NOS2 staining of GW treated IR injury group compared to control, sham, GW and DMSO groups. Hepatic tissue homogenate nitrite (NO2−) and nitrate (NO3−) levels are shown in Fig. C. Nitrite and nitrate levels (mean ± SD) in the liver affirmed significantly increased levels of nitric oxide generation in IR (12.70 ± 5.25 μM) and DMSO+IR (13.11 ± 1.80 μM) groups vs. control (5.02 ± 0.78 μM), DMSO (4.70 ± 0.69 μM), GW (3.03 ± 0.51μM) and sham (4.72 ± 0.67μM). No significant difference was found in NO2−/NO3− levels of GW treated IR injury group (7.63 ± 0.70 μM) compared to control, sham, GW and DMSO groups.
Figure 2 (A) Immunostaining of NOS2 in the liver. Liver photomicrographs of representative rat are shown from each experimental group. Magnification: 20×. Bar, 200 µm. CV, central vein; IR, ischemia–reperfusion; GW, animals treated with GW 4869; DMSO, group treated with dimethyl sulfoxide. (B) Immunostaining scores of NOS2. Values are mean ± SD, n = 4–5. Statistical analysis was by Kruskal–Wallis one-way analysis on ranks. All pairwise multiple comparisons were done by Dunn's method.*, p<.05 compared to control, sham, GW and DMSO. (C) Liver nitrite and nitrate levels. Values are mean ± SD, n = 4–10. Statistical analysis was by Kruskal–Wallis one-way analysis on ranks. All pairwise multiple comparisons were done by Dunn's method. *, p<.05 vs. control, sham, GW and DMSO. **, p<.05 vs. GW.
Immunostaining and quantitation of nitrotyrosine in the liver
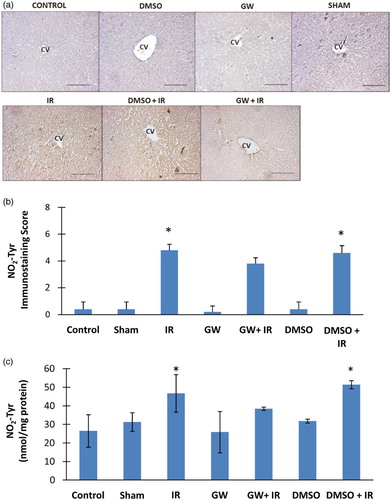
Nitrotyrosine positive staining was observed throughout the pericentral hepatocytes in all IR groups (Fig. A). Nitrotyrosine was not evident in the liver of control, DMSO, GW and sham groups. The immunostaining scores obtained according to both the percentage and intensity of positive stained cells were statistically increased in IR and DMSO+IR group rats compared to control, DMSO, GW and sham group rats (Fig. B). No significant difference was found in NO2Tyr staining of GW treated IR injury group compared to control, sham, GW and DMSO groups. Nitrotyrosine content (mean ± SD) measured in the liver of experimental groups is shown in Fig. C. The formation of protein NO2Tyr was significantly increased in IR (46.75 ± 10.15 nmol/mg protein) and DMSO+IR (51.40 ± 2.18 nmol/mg protein) groups as compared to control (26.52 ± 8.74 nmol/mg protein), DMSO (31.82 ± 1.05 nmol/mg protein), GW (25.84 ± 11.14 nmol/mg protein) and sham (31.30 ± 5.04 nmol/mg protein). No significant difference was found in NO2Tyr levels of GW treated IR injury group (38.46 ± 0.86 nmol/mg protein) compared to control, sham, GW and DMSO groups.
Figure 3 (A) Immunostaining of NO2Tyr in the liver. Liver photomicrographs of representative rat are shown from each experimental group. Magnification: 20×. Bar, 200 µm. CV, central vein; IR, ischemia–reperfusion; GW, animals treated with GW 4869; DMSO, group treated with dimethyl sulfoxide. (B) Immunostaining scores of NO2Tyr. Values are mean ± SD, n = 4–5. Statistical analysis was by Kruskal–Wallis one-way analysis on ranks. All pairwise multiple comparisons were done by Dunn's method.*, p<.05 compared to control, sham, GW and DMSO. (C) Liver NO2Tyr levels. Values are mean ± SD. n = 4–10. Statistical analysis was by Kruskal–Wallis one-way analysis on ranks. All pairwise multiple comparisons were done by Dunn's method. *, p<.05 compared to control, sham, GW and DMSO.
Immunostaining and quantitation of HNE in the liver
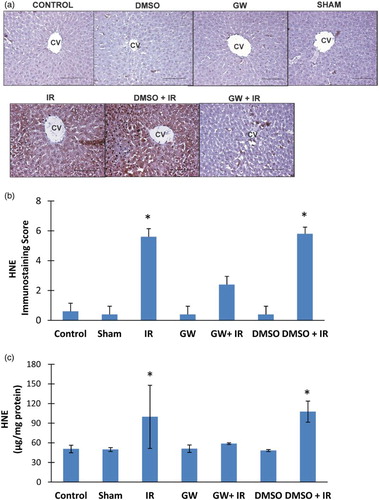
HNE positive staining was observed throughout the pericentral hepatocytes in all IR groups (Fig. A). HNE staining was not evident in the liver of control, DMSO, GW and sham groups. The immunostaining scores obtained according to both the percentage and intensity of positive stained cells were statistically increased in IR and DMSO+IR group rats compared to control, DMSO, GW and sham group rats (Fig. B). No significant difference was found in HNE staining of GW treated IR injury group compared to control, sham, GW and DMSO groups. HNE content (mean ± SD) measured in the liver of experimental groups is shown in Fig. C. The formation of HNE-His protein adducts was significantly increased in IR (99.83 ± 48.26 μg/mg protein) and DMSO+IR (107.77 ± 16.14 μg/mg protein) groups as compared to control (50.73 ± 5.73 μg/mg protein), DMSO (48.25 ± 1.59 μg/mg protein), GW (51.16 ± 5.70 μg/mg protein) and sham (49.80 ± 3.02 μg/mg protein). No significant difference was found in HNE-His protein adduct levels of GW treated IR injury group (58.83 ± 1.30 μg/g protein) compared to control, sham, GW and DMSO groups.
Figure 4 (A) Immunostaining of HNE in the liver. Liver photomicrographs of representative rat are shown from each experimental group. Magnification: 20×. Bar, 200 µm. CV, central vein; IR, ischemia–reperfusion; GW, animals treated with GW 4869; DMSO, group treated with dimethyl sulfoxide. (B) Immunostaining scores of HNE. Values are mean ± SD, n = 4–5. Statistical analysis was by Kruskal–Wallis one-way analysis on ranks. All pairwise multiple comparisons were done by Dunn's method.*, p<.05 compared to control, sham, GW and DMSO. (C) Liver HNE levels. Values are mean ± SD. n = 4–10. Statistical analysis was by Kruskal–Wallis one-way analysis on ranks. All pairwise multiple comparisons were done by Dunn's method. *, p<.05 compared to control, sham, GW and DMSO.
Protein carbonyl levels
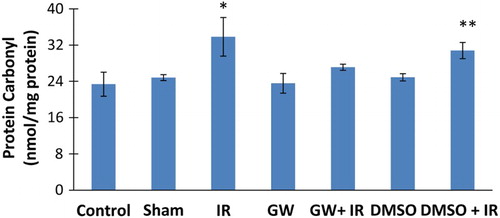
Ischemia/reperfusion caused a significant increase in liver protein carbonyl levels (mean ± SD) in both IR (33.83 ± 4.26 nmol/mg protein) and DMSO+IR (30.80 ± 1.78 nmol/mg protein) groups (Fig. ). No significant difference was found in HNE-His protein adduct levels of GW treated IR injury group (27.11 ± 0.68 nmol/mg protein) compared to control (23.37 ± 2.66 nmol/mg protein), sham (24.83 ± 0.65 nmol/mg protein), GW (23.56 ± 2.17 nmol/mg protein) and DMSO (24.89 ± 0.80 nmol/mg protein) groups.
Figure 5 Liver protein carbonyl content. IR, ischemia–reperfusion; GW, animals treated with GW 4869; DMSO, group treated with dimethyl sulfoxide. All pairwise multiple comparisons were done by Dunn's method.*, p<.05 compared to control, sham, GW and DMSO. **, p<.05 compared to control and GW.
Sphingomyelin and ceramide levels
A representative pozitif ion mode spectra of sphingomyelins (SM) and ceramides measured in control liver tissue is shown in Fig. . Figure C shows the tandem mass spectra of the analyzed sphingolipids. Sphingomyelins provide a common ion at m/z 184 based on the phosphocholine group. Ceramides provide a distinctive product ion at m/z 264 by elimination of fatty acid and two hydroxyl groups. Levels of sphingmyelins and ceramides measured in liver tissue are given in Table . Spingomyelin levels were significantly increased in all IR groups compared to control groups. Treatment with a specific N-SMase inhibitor significantly decreased all measured ceramides in IR injury group.
Figure 6 (A) representative pozitif ion mode spectra of sphingomyelins (SM) and ceramides measured in control liver tissue (A) Pozitif ion mode spectra of C16, C18 and C24 SM. (B) Mass spectra of C16, C18, C20, C22 and C24 ceramide. (C) Tandem mass spectra of the analyzed sphingolipids
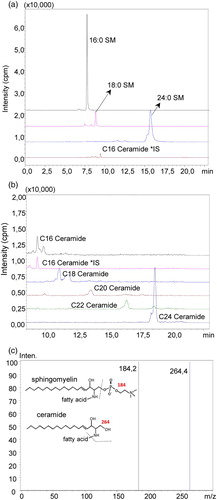
Table 4 Levels of sphingomyelins and ceramides
Discussion
Ceramide has been shown to regulate cell stress responses that play a critical role in IR-induced mitochondrial damage.Citation8 With respect, recent studies have focused on the identification and understanding of tissue- and disease-specific sphingolipid signaling in liver diseases.Citation24 This study makes the novel observation that inhibition of N-SMase activity modulates nitrative and oxidative stress markers associated with warm liver IR injury. To our knowledge this is the first study evaluating the affect of N-SMase inhibition following liver IR. Using now an animal model, we have evaluated the effect of SMase inhibition on NOS2 levels, protein nitration, nitrite/nitrate levels, HNE formation, protein carbonyl levels and XO/XDH activity. Our data clearly show that N-SMase inhibition leads to decreased NOS2 levels, with a parallel decrease in protein nitration and nitrite/nitrate levels. Neutral-SMase inhibition also causes a reduction in HNE formation, protein carbonyl levels and hepatic conversion of XO when compared to untreated, IR groups.
The given ip dose of N-SMase inhibitor (1.25 mg/kg/day) was sufficient for the compound to inhibit hepatic tissue N-SMase activity (Table ). In agreement with previous reports, this dose of GW4869 did not produce any adverse effects and was in sufficient quantity to inhibit N-SMase activity.Citation17 We have observed that IR caused a significant increase in hepatic N-SMase activity compared to control groups which is in agreement with a previous report demonstrating increased N-SMase activity in warm IR injury.Citation10 N-SMases mediate the release of ceramide from sphingomyelin in cellular membranes and can be activated by certain stresses. Ceramide can act as a signaling molecule, or it can be further processed to generate sphingosine-1-phosphate. GW 4869 is a cell-permeable, non-competitive inhibitor of N-SMases (IC50 = 1 μM), but does not affect acid sphingomyelinase activity.Citation25
Plasma ALT activity was significantly increased in our model of warm liver I/R. The increase in serum activity of ALT is a specific marker of liver damageCitation26 and thus confirms the presence of hepatic injury in the animal model used herein (Table ). Histopathological evaluation of liver sections confirmed the presence of liver I/R injury (Table ) and is in agreement with biochemical findings of increased serum activity of ALT. GW4869 treatment showed no significant effect on ALT activity and histopathological findings of liver I/R injury. Considering that ALT activity in the liver is much greater than in plasma, a small amount of enzyme released from hepatic tissues can cause a significant increase in circulating plasma levels of the enzyme.
There is accumulating evidence that ceramide induces the activation of ROS-generating enzymes and the mitochondrial respiratory chain.Citation27,Citation28 Neutral-SMase inhibition caused a reduction in the hepatic conversion of XO when compared to untreated, IR groups (Table ). Xanthine dehydrogenase is a molybdopterin-containing flavoprotein that oxidizes hypoxanthine to xanthine, and xanthine to uric acid. It has two identical subunits containing FAD, molybdenum, and Fe–S clusters that facilitate electron transfer from substrate to the electron acceptor NAD+.Citation29 Xanthine dehydrogenase can be converted to XO by either proteolytic cleavage of the amino terminus or more rapidly by thiol oxidation leading to intramolecular disulfide formation.Citation30 Only the dehydrogenase form of the enzyme can reduce NAD+ and form NADH, and XO remains a major source for superoxide (O2•_) and hydrogen peroxide (H2O2) production. Administration of N-SMase inhibitor before I/R injury increased the XDH/XO ratio compared to untreated I/R livers. Knowing that ceramide triggers the generation of ROS and increases oxidative stress in many mammalian cells and animal models,Citation31 this effect of N-SMase is most probably due to decreased thiol oxidation, which will lead to a decrease in intramolecular disulfide formation. Prevention of intramolecular disulfide formation within XDH will decrease conversion of the enzyme to XO and increase the XDH/XO ratio as seen in this study.
Increased expression of NOS2 and elevated tissue NO2−/NO3− levels observed herein (Fig. ), are in agreement with previous animal models of liver I/R injury.Citation6 In many cases, NOS2 inhibitors significantly improve organ function in tissue I/R injury.Citation6 Similarly, I/R-induced tissue injury is attenuated in the liver of NOS2−/–mice.Citation7 We have observed a significant down regulation of NOS2 protein and NO2−/NO3− levels with NSMase inhibition. Previous studies have shown that exogenous ceramide and SMase induce NOS2 expression in rat primary astrocytes and rat glioma cells.Citation31 Studies have also shown a positive modulation of NOS2 gene expression by SMase and/or ceramide in vascular smooth muscle cells and microglia.Citation32,Citation33 Furthermore, inhibitors of N-SMase decreased NOS2 gene transcription by the downregulation of NF-kB.Citation15
Protein nitration observed during IR could be either via the formation of the oxidizing and nitrating species peroxynitrite (ONOO―)Citation34 or by peroxidase catalyzed oxidation of NO2−, an NO metabolite that is elevated in IR, to the nitrating species nitrogen dioxide (NO2).Citation35 Myeloperoxidase, a heme peroxidase released during neutrophil, monocyte, and macrophage activation, can give rise to nitrotyrosine formation.Citation36 As stated previously, the initial phase of liver IR injury is associated with neutrophil accumulation. Leukocyte chemotaxis and neutrophil activation occur as a result of TNF-α production.Citation3 We have observed a significant decrease of protein nitration with N-SMase inhibition which appears to occur due to down regulation of NOS2 protein and NO2−/NO3− levels. Our observation is in agreement with a recent study which has also shown that N-SMase inhibition decreases both NOS2 and nitrotyrosine levels in an experimental model of glaucoma.Citation37
Ceramide has been shown to activate oxidant stress and increase the production of O2•– in a variety of mammalian cells, including human aortic smooth muscle cells, endothelial cells, and macrophages.Citation38,Citation39 Treatment with N-SMase significantly decreased HNE and protein carbony formation following I/R injury (Figs. and ). 4-HNE-His protein adducts and protein carbonyl formation is a widely utilized marker for tissue oxidation reactions.Citation40 Lipid peroxides decompose to form more complex and reactive compounds such as 4-HNE, a natural product of lipid peroxidation. HNE has been shown to be capable of binding to proteins and forming stable adducts, also termed advanced lipid peroxidation end products.Citation41 These modifications of proteins by HNE can cause both structural and functional changes of oxidized proteins.Citation41 Carbonyls, formed following ROS mediated oxidation of sugar and membrane lipids, are able to form adducts commonly known as CO-proteins (proteins bearing carbonyl groups) with structural proteins, causing alterations in their biological activity.Citation42 Reactive carbonyl groups on proteins can also be formed by direct oxidation of protein side-chains.Citation43
In conclusion, the present study revealed that liver IR injury significantly increased sphingomyelin/ceramide levels, N-SMase activity,. nitrative and oxidative stress markers in liver tissue specimens. N-SMase inhibition significantly decreased oxidant and nitrative stress in postischemic liver. Future studies evaluating agents blocking N-SMase activity can facilitate the development of treatment strategies to alleviate inflammation in liver IR injury.
Disclaimer statements
Contributors None.
Funding This study was supported by a grant (No.: 2013.01.0103.004) from Akdeniz University Research Foundation, Turkey.
Conflicts of interest None.
Ethics approval None.
References
- Dogan S, Aslan M. Hepatic ischemia-reperfusion injury and therapeutic strategies to alleviate cellular damage. Hepatol Res 2011;41:103–17. doi: 10.1111/j.1872-034X.2010.00765.x
- Jaeschke H, Bautista AP, Spolarics Z, Spitzer JJ. Superoxide generation by neutrophils and Kupffer cells during in vivo reperfusion after hepatic ischemia in rats. J Leukoc Biol 1992;52:377–82.
- Tsukamoto H. Redox regulation of cytokine expression in Kupffer cells. Antioxid Redox Signal 2002;4:741–48. doi: 10.1089/152308602760598882
- Colletti LM, Kunkel SL, Walz A, Burdick MD, Kunkel RG, Wilke CA, et al. The role of cytokine networks in the local liver injury following hepatic ischemia/reperfusion in the rat. Hepatology 1996;23:506–14. doi: 10.1002/hep.510230315
- Urakami H, Abe Y, Grisham MB. Role of reactive metabolites of oxygen and nitrogen in partial liver transplantation: lessons learned from reduced-size liver ischaemia and reperfusion injury. Clin Exp Pharmacol Physiol 2007;34:912–19. doi: 10.1111/j.1440-1681.2007.04640.x
- Isobe M, Katsuramaki T, Kimura H, Nagayama M, Matsuno T, Yagihashi A, et al. Role of inducible nitric oxide synthase on hepatic ischemia and reperfusion injury. Transplant Proc 2000;32:1650–52. doi: 10.1016/S0041-1345(00)01435-4
- Lee VG, Johnson ML, Baust J, Laubach VE, Watkins SC, Billiar TR. The roles of iNOS in liver ischemia-reperfusion injury. Shock 2001;16:355–60. doi: 10.1097/00024382-200116050-00006
- Novgorodov SA, Gudz TI. Ceramide and mitochondria in ischemia/reperfusion. J Cardiovasc Pharmacol 2009;53:198–208. doi: 10.1097/FJC.0b013e31819b52d5
- Llacuna L, Marí M, Garcia-Ruiz C, Fernandez-Checa JC, Morales A. Critical role of acidic sphingomyelinase in murine hepatic ischemia-reperfusion injury. Hepatology 2006;44:561–752. doi: 10.1002/hep.21285
- Wu BX, Clarke CJ, Hannun YA. Mammalian neutral sphingomyelinases: regulation and roles in cell signaling responses. Neuromol Med 2010;12:320–30. doi: 10.1007/s12017-010-8120-z
- Sawai H, Hannun YA. Ceramide and sphingomyelinases in the regulation of stress responses. Chem Phys Lipids 1999;102:141–47. doi: 10.1016/S0009-3084(99)00082-1
- Perrotta C, Clementi E. Biological roles of acid and neutral sphingomyelinases and their regulation by nitric oxide. Physiology (Bethesda) 2010;25:64–71. doi: 10.1152/physiol.00048.2009
- Kone BC, Kuncewicz T, Zhang W, Yu ZY. Protein interactions with nitric oxide synthases: controlling the right time, the right place, and the right amount of nitric oxide. Am J Physiol Renal Physiol 2003;285:F178–F190. doi: 10.1152/ajprenal.00048.2003
- Zhang W, Kuncewicz T, Yu ZY, Zou L, Xu X, Kone BC. Protein-protein interactions involving inducible nitric oxide synthase. Acta Physiol Scand 2003;179:137–42. doi: 10.1046/j.1365-201X.2003.01119.x
- Won JS, Im YB, Khan M, Singh AK, Singh I. The role of neutral sphingomyelinase produced ceramide in lipopolysaccharide-mediated expression of inducible nitric oxide synthase. J Neurochem 2004;88:583–93. doi: 10.1046/j.1471-4159.2003.02165.x
- Aslan M, Özcan F, Tuzcu H, Kıraç E, Elpek GO. Inhibition of neutral sphingomyelinase decreases arachidonic acid mediated inflammation in liver ischemia-reperfusion injury. Int J Clin Exp Pathol 2014;7:7814–23.
- Tabatadze N, Savonenko A, Song H, Bandaru VV, Chu M, Haughey NJ. Inhibition of neutral sphingomyelinase-2 perturbs brain sphingolipid balance and spatial memory in mice. J Neurosci Res 2010;88:2940–51.
- Dogan S, Ozlem Elpek G, Kirimlioglu Konuk E, Demir N, Aslan M. Measurement of intracellular biomolecular oxidation in liver ischemia-reperfusion injury via immuno-spin trapping. Free Radic Biol Med 2012;53:406–14. doi: 10.1016/j.freeradbiomed.2012.05.028
- Curek GD, Cort A, Yucel G, Demir N, Ozturk S, Elpek GO, et al. Effect of astaxanthin on hepatocellular injury following ischemia/reperfusion. Toxicology 2010;267:147–53. doi: 10.1016/j.tox.2009.11.003
- Beckman JS, Parks DA, Pearson JD, Marshall PA, Freeman BA. A sensitive fluorometric assay for measuring xanthine dehydrogenase and oxidase in tissues. Free Radic Biol Med 1989;6:607–15. doi: 10.1016/0891-5849(89)90068-3
- Yücel I, Akar Y, Yücel G, Ciftçioğlu MA, Keleş N, Aslan M. Effect of hypercholesterolemia on inducible nitric oxide synthase expression in a rat model of elevated intraocular pressure. Vision Res 2005;45:1107–14. doi: 10.1016/j.visres.2004.11.018
- Yoo HH, Son J, Kim DH. Liquid chromatography-tandem mass spectrometric determination of ceramides and related lipid species in cellular extracts. J Chromatogr B Analyt Technol Biomed Life Sci. 2006;843:327–33. doi: 10.1016/j.jchromb.2006.06.025
- Bui HH, Leohr JK, Kuo MS. Analysis of sphingolipids in extracted human plasma using liquid chromatography electrospray ionization tandem mass spectrometry. Anal Biochem. 2012;423:187–94. doi: 10.1016/j.ab.2012.01.027
- Marí M, Fernández-Checa JC. Sphingolipid signalling and liver diseases. Liver Int 2007;27:440–50. doi: 10.1111/j.1478-3231.2007.01475.x
- Luberto C, Hassler DF, Signorelli P, Okamoto Y, Sawai H, Boros E, et al. Inhibition of tumor necrosis factor-induced cell death in MCF7 by a novel inhibitor of neutral sphingomyelinase. J Biol Chem. 2002;277:41128–39. doi: 10.1074/jbc.M206747200
- Ozer J, Ratner M, Shaw M, Bailey W, Schomaker S. The current state of serum biomarkers of hepatotoxicity. Toxicology 2008;245:194–205. doi: 10.1016/j.tox.2007.11.021
- Corda S, Laplace C, Vicaut E, Duranteau J. Rapid reactive oxygen species production by mitochondria in endothelial cells exposed to tumor necrosis factor-alpha is mediated by ceramide. Am J Respir Cell Mol Biol 2001;24:762–68. doi: 10.1165/ajrcmb.24.6.4228
- Lecour S, Van der Merwe E, Opie LH, Sack MN. Ceramide attenuates hypoxic cell death via reactive oxygen species signaling. J Cardiovasc Pharmacol 2006;47:158–63. doi: 10.1097/01.fjc.0000198520.28674.41
- Enroth C, Eger BT, Okamoto K, Nishino T, Nishino T, Pai EF. Crystal structures of bovine milk xanthine dehydrogenase and xanthine oxidase: structure-based mechanism of conversion. Proc Natl Acad Sci USA 2000;97:10723–28. doi: 10.1073/pnas.97.20.10723
- McKelvey TG, Höllwarth ME, Granger DN, Engerson TD, Landler U, Jones HP. Mechanisms of conversion of xanthine dehydrogenase to xanthine oxidase in ischemic rat liver and kidney. Am J Physiol 1988;254:G753–G760.
- Pahan K, Sheikh FG, Khan M, Namboodiri AM, Singh I. Sphingomyelinase and ceramide stimulate the expression of inducible nitric-oxide synthase in rat primary astrocytes. J Biol Chem 1998;273:2591–600. doi: 10.1074/jbc.273.5.2591
- Katsuyama K, Shichiri M, Marumo F, Hirata Y. Role of nuclear factor-kappaB activation in cytokine- and sphingomyelinase-stimulated inducible nitric oxide synthase gene expression in vascular smooth muscle cells. Endocrinology 1998;139:4506–12. doi: 10.1210/endo.139.11.6309
- Yang MS, Jou I, Inn-Oc H, Joe E. Sphingomyelinase but not ceramide induces nitric oxide synthase expression in rat brain microglia. Neurosci Lett 2001;311:133–36. doi: 10.1016/S0304-3940(01)02162-0
- Beckman JS, Beckman TW, Chen J, Marshall PA, Freeman BA. Apparent hydroxyl radical production by peroxynitrite: implications for endothelial injury from nitric oxide and superoxide. Proc Natl Acad Sci USA 1990;87:1620–24. doi: 10.1073/pnas.87.4.1620
- Eiserich JP, Hristova M, Cross CE, Jones AD, Freeman BA, Halliwell B, et al. Formation of nitric oxide-derived inflammatory oxidants by myeloperoxidase in neutrophils. Nature 1998;391:393–97. doi: 10.1038/34923
- Aslan M, Yucel I, Ciftcioglu A, Savaş B, Akar Y, Yucel G, et al. Corneal protein nitration in experimental uveitis. Exp Biol Med (Maywood) 2007;232:1308–13. doi: 10.3181/0702-RM-34
- Aslan M, Basaranlar G, Unal M, Ciftcioglu A, Derin N, Mutus B. Inhibition of neutral sphingomyelinase decreases elevated levels of inducible nitric oxide synthase and apoptotic cell death in ocular hypertensive rats. Toxicol Appl Pharmacol 2014;280:389–98. doi: 10.1016/j.taap.2014.08.026
- Bhunia AK, Han H, Snowden A, Chatterjee S. Redox-regulated signaling by lactosylceramide in the proliferation of human aortic smooth muscle cells. J Biol Chem 1997;272:15642–49. doi: 10.1074/jbc.272.25.15642
- Zhang Y, Li X, Carpinteiro A, Gulbins E. Acid sphingomyelinase amplifies redox signaling in pseudomonas aeruginosa-induced macrophage apoptosis. J Immunol 2008;181:4247–54. doi: 10.4049/jimmunol.181.6.4247
- Stadtman ER, Oliver CN. Metal-catalyzed oxidation of proteins. Physiological consequences. J Biol Chem 1991;266:2005–08.
- Tuma DJ, Thiele GM, Xu D, Klassen LW, Sorrell MF. Acetaldehyde and malondialdehyde react together to generate distinct protein adducts in the liver during long-term ethanol administration. Hepatology 1996;23:872–80. doi: 10.1002/hep.510230431
- Shacter E. Protein oxidative damage. Methods Enzymol 2000;319:428–36. doi: 10.1016/S0076-6879(00)19040-8
- Reznick AZ, Packer L. Oxidative damage to proteins: spectrophotometric method for carbonyl assay. Methods Enzymol 1994;233:357–63. doi: 10.1016/S0076-6879(94)33041-7