
Abstract
Objectives: Listeria monocytogenes is a facultative anaerobic foodborne pathogen that can traverse the blood–brain barrier and cause brain infection. L. monocytogenes infection induces host cell apoptosis in several cell types. In this study, we investigated the apoptosis of human glioma cell line U251 invaded by L. monocytogenes and evaluated the function of bacterial reactive oxygen species (ROS) during infection.
Methods: Bacterial ROS level was reduced by carrying out treatment with N-acetyl cysteine (NAC) and diphenyleneiodonium chloride (DPI). After infection, the apoptosis of U251 cells was examined by flow cytometry assay and propidium iodide staining.
Results: DPI and NAC efficiently decreased ROS level in L. monocytogenes without affecting bacterial growth. Moreover, the apoptosis of glial cells was enhanced upon invasion of DPI- and NAC-pretreated L. monocytogenes.
Discussion: Results indicate that the apoptosis of glial cells can be induced by L. monocytogenes, and that the inhibition of bacterial ROS increases the apoptosis of host cells.
Introduction
Listeria monocytogenes is a Gram-positive foodborne pathogen that ubiquitously exists in water, soil, gastrointestinal tracts of animals, and 5% of healthy human adults.Citation1 L. monocytogenes contamination frequently occurs in the food industry; these bacteria cannot be easily eliminated because they can survive under dry, salty, and low-temperature conditions.Citation2 L. monocytogenes can traverse the intestinal, blood–brain, and placental barriers.Citation3 These organisms can also survive and replicate in monocytes and other non-phagocytic cells. L. monocytogenes infection can lead to meningitis, meningoencephalitis, septicemia, and abortion. The mortality rate of listeriosis has reached 30%.Citation3,Citation4 Pregnant women, infants, and immunocompromised people are susceptible to L. monocytogenes infection. Although severe L. monocytogenes infection is unusual, the high mortality rate of listeriosis renders L. monocytogenes a threat to the food industry and human wellness.
L. monocytogenes prefers to invade the human brain, and this phenomenon occurs in 28–79% of listeriosis cases.Citation5 Crossing the blood–brain barrier through the bloodstream is one of the mechanisms by which L. monocytogenes invades the brain. Glial cells are the most abundant cells in the brain; they are important components of the blood–brain barrier and essential to maintaining the permeability of the barrier.Citation6 Glial cells act as immune cells by releasing pro-inflammatory factors during brain infection.Citation7 Hence, validating the behavior of glial cells during infection may contribute to uncovering the pathogenesis of brain listeriosis.
Reactive oxygen species (ROS) are byproducts of aerobic metabolism in the presence of environmental stress.Citation8 is a type of ROS that is generated through one-electron reduction of O2 by NAD(P)H oxidase.Citation9,Citation10 Cytosolic
is rapidly converted into H2O2 through the enzymatic activity of superoxide dismutase (SOD).Citation11 The instability and membrane diffusibility of H2O2 provides an advantage with signaling capacity.Citation12,Citation13 During bacterial infection, host cells generate ROS to kill bacteria; this process is called ‘oxidative burst.’ To overcome this effect, bacteria have developed a system involving SOD, catalase, and peroxidases.Citation14 Studies on host-generated ROS during infection have proven that ROS plays an important role in host–pathogen interactions.Citation15,Citation16 Although minimal information is known about the function of ROS in bacteria, its role has been supported by evidence reported in several microbiological studies. Tang et al.,Citation17 for example, reported that the virulence of Streptococcus suis type 2 decreases upon the inactivation of the sodA gene. Makino et al.Citation18 revealed that ROS can enhance the expression of genes associated with the virulence of L. monocytogenes; these genes include prfA and hly, which play essential roles in the invasion of L. monocytogenes into host cells.
Cell death occurs during viral and bacterial infection and is presumed as a primitive method for limiting the replication and systemic spread of infectious pathogens.Citation19 Apoptosis of host cells induced by L. monocytogenes has been reported in hepatocytes,Citation20,Citation21 dendritic cells,Citation22 and neurons.Citation23 Parra et al.Citation23 reported that the apoptosis of the neural cell line N2a is influenced by listeriolysin O, which is coded by the hly gene of L. monocytogenes in a dose- and time-dependent manner.
In the current study, we assessed the apoptosis of glial cells during L. monocytogenes infection and evaluated the function of bacterial ROS during the infection by pretreating L. monocytogenes with antioxidants. The findings of this study can provide evidence supporting the assumption that bacterial genes play important roles in the apoptosis of host cells.
Materials and methods
Bacteria and cells
L. monocytogenes EGDe (1/2a) were stored at −80°C in brain heart infusion (BHI, Beijing Land Bridge, Co.) containing 15% glycerol. Cultures were streaked onto BHI agar and incubated at 37°C for 24 hours to obtain isolated colonies. Prior to the experiment, a single colony was inoculated into BHI and cultured at 37°C overnight with shaking.
Human glioma cell line U251 were cultured in Dulbecco's Modified Eagle Media (DMEM, Gibco) containing 10% fetal bovine serum (FBS, Biosera) at 37°C with 5% CO2. For the invasion assay, cells were planted into 12-well plates one day before the experiment.
Chemical treatment and ROS measurement
ROS production was evaluated using 2′,7′-dichlorodihydrofluorescein diacetate (DCFH-DA, Sigma-Aldrich, CA, USA). Diphenyleneiodonium chloride (DPI) and N-acetyl cysteine (NAC) were used to decrease the bacterial ROS level.
L. monocytogenes EGDe was cultured in BHI to an optical density of 0.3 at 600 nm (OD600). Then the bacteria cultures were added into six tubes at 1 mL each, and incubated with DPI for 0.5 hour at concentrations of 0, 0.01, 0.1, 0.5, 1.0, and 2.0 μM. After the incubation, the bacteria were centrifuged at 3000 × g for 5 minutes and washed with phosphate buffered saline (PBS, pH 7.4) three times. The bacteria were then resuspended in BHI and placed into 96-well plates. Subsequently, 10 μM DCFH-DA was added into each well and incubated with the bacteria at 37°C for 50 minutes. Fluorescence was detected by a microplate reader (excitation, 488 nm; emission, 530 nm).
For NAC treatment, the bacteria were incubated with 0, 0.1, 0.25, 0.5, 1.0, and 2.0 mM NAC for 16 hours. Then the bacteria were placed into 96-well plates without washing to measure the ROS level with DCFH-DA.
3-(4,5-Dimethyl-2-thiazolyl)-2,5-diphenyl-2-H-tetrazolium bromide (MTT) assay and determination of growth activity
Bacteria were treated with DPI or NAC according to the protocol presented in Section ‘Chemical treatment and ROS measurement’. For the MTT assay, the treated bacteria were washed with PBS thrice to remove DPI or NAC before placement into a 96-well plate. Next, 20 µL of MTT was added to each well, and the plate was incubated at 37°C for 4 hours. After incubation, the plate was centrifuged at 3000 × g for 10 minutes. Then the supernatant was discarded and 150 µL of dimethyl sulfoxide was added to dissolve the purple formazan. Fluorescence was detected at 570 nm. For the determination of growth activity, DPI- or NAC-treated bacteria were diluted at 1:100 000 and spread on the BHI agar plates. After being cultured at 37°C for 1 day, the colony-forming units (CFU) numbers on each plate were counted, and CFU of each group was calculated.
Invasion and flow cytometry assays
U251 cells were placed in 12-well plates at a density of 105 per well. The cultured medium was replaced with fresh DMEM without FBS before bacterial invasion. L. monocytogenes was cultured in BHI to an optical density OD600 of 0.3. Then, 1 ml of bacteria were collected and incubated with 2.0 μM DPI for 0.5 hour or 1.0 mM NAC for 16 hours. Then, the bacteria were washed with PBS for three times after DPI treatment; no washing was needed after NAC treatment. Bacteria were added to the cell cultures at a multiplicity of infection of 100 bacteria per cell, and incubated at 37°C for 2 hours. After invasion, the cultures were incubated with gentamicin (500 μg/mL) for 0.5 hour, to kill the extracellular bacteria and then washed with PBS thrice.
For the apoptosis examination by flow cytometry assays, U251 cells were digested with 0.25% Trypsin to form single-cell suspension and treated with an annexin V-FITC/PI apoptosis detection kit (Beyotime, Shanghai, China) according to instructions of the manufacturer. Apoptotic cells were detected and analyzed with FACS Calibur (BD Bioscience, USA).
Immunostaining, propidium iodide (PI) staining and imaging
U251 cells were cultured in 12-well plate with round cover glasses (Fisher Scientific) for adherent growth a day before bacterial invasion. For PI staining, 200 μL of PI (100 μg/mL) was added to each well and then incubated at 4°C for 30 minutes after bacterial invasion. Next, the cells were washed twice with PBS to remove the PI and then stained with DAPI before observation using a Leica microscope DM2500. All images were captured by Leica V3.6 software. PI-positive cells were counted in each image. The percentage of apoptosis cells was calculated by dividing the number of PI-positive cells by the number of DAPI-positive cells.
For immunostaining, U251 cells were fixed with 1% paraformaldehyde after bacterial invasion for 30 minutes at 4°C. Cells were washed with PBS thrice and incubated with a rabbit L. monocytogenes antibody. To observe the internalized bacteria, no permeability was taken. A Texas Red goat anti-rabbit secondary antibody was used to label L. monocytogenes. Acti-stain 488 (Cytoskeleton, Inc.) and DAPI were utilized to stain actin and to label the nucleus, respectively.
Statistical analysis
Each experiment was repeated for three or more times, and the data were analyzed with Graphpad Prism. One-way ANOVA was used for the statistical analysis of ROS level after DPI or NAC treatment, and paired t-test was conducted to determine the statistical differences between the experimental and control groups in the apoptosis assays.
Results
DPI treatment induced ROS downregulation in L. monocytogenes without affecting bacterial growth
In plant and animal cells, ROS is mainly generated by NAD(P)H oxidase, which can be inhibited by DPI.Citation24 In the present study, we used DPI to treat L. monocytogenes and determine whether ROS generation could be inhibited. Six DPI concentrations were investigated to determine the optimal concentration for generating the lowest ROS level in L. monocytogenes. As shown in Fig. , DPI treatment reduced ROS level in L. monocytogenes in a dose-dependent manner (Fig. A). To rule out the influence of DPI on bacterial growth, we performed MTT analysis and determined the CFU of each group. After treatment with DPI for 0.5 hour, the log CFU value did not significantly change between the non-treated and DPI-treated groups (Fig. B). MTT assay was also conducted after the DPI treatment, and the results were not different among the tested groups (Fig. C). Hence, DPI treatment efficiently reduced ROS levels in L. monocytogenes without affecting bacterial growth.
Figure 1 DPI treatment efficiently decreased ROS levels in a dose-dependent manner without affecting the growth of L. monocytogenes. (A) ROS level in L. monocytogenes decreased dose-dependently with DPI concentrations. ROS was measured by DCFH-DA, and fluorescence was determined to indicate the ROS level. The ROS level of 0 μM DPI-treated bacteria was set at 100%, and those of the other groups were divided by that of the 0 μM-treated group to normalize the data. One-way ANOVA was used to perform statistical analysis, *P < 0.05, **P < 0.01, ***P < 0.001. (B) CFU of L. monocytogenes was not altered when treated with DPI. CFU of each group was transformed to log CFU. C, MTT assays suggested no considerable changes in bacterial activity under DPI treatment. The absorbance data at 570 nm of each group were normalized with the same method used in (A) and (B).
NAC treatment decreased ROS levels in L. monocytogenes without affecting bacterial growth
NAC is an antioxidant that can directly eliminate ROS through the redox potential of thiols or by increasing glutathione levels in the cells.Citation25 To reveal the function of bacterial ROS, we used NAC to eliminate ROS in L. monocytogenes. Bacteria were treated with different concentrations of NAC, and the ROS levels were measured. The results showed that the ROS levels in NAC-treated bacteria decreased compared with those in the untreated group; in particular, the group treated with 1.0 mM NAC exhibited the lowest level of ROS. Moreover, treatment with 2.0 mM NAC did not downregulate the ROS level (Fig. A). Thus, treatment with 1.0 mM NAC was adopted for the subsequent analysis. We conducted bacterial CFU determination and MTT assay on NAC-treated bacteria to rule out the influence of NAC on bacterial growth. No significant changes were observed in CFU values (Fig. B) or MTT results (Fig. C). Thus, NAC treatment did not affect the bacterial growth.
Figure 2 NAC treatment decreased ROS level in L. monocytogenes without affecting bacterial growth. (A) ROS in L. monocytogenes decreased with decreasing NAC concentration. The ROS level of 0 mM NAC-treated bacteria was set at 100%, and those of the other groups were divided by that of the 0 mM-treated group to normalize the data. One-way ANOVA was used to perform statistical analysis, *P < 0.05. (B) CFU of L. monocytogenes was not altered when treated with NAC. CFU of each group was transformed to log CFU. (C) MTT assays suggested no considerable changes in bacterial activity under NAC treatment. The absorbance data at 570 nm of each group were normalized with same method used in (A) and (B).
Reducing ROS levels in L. monocytogenes by antioxidant treatment promoted the apoptosis of glial cells
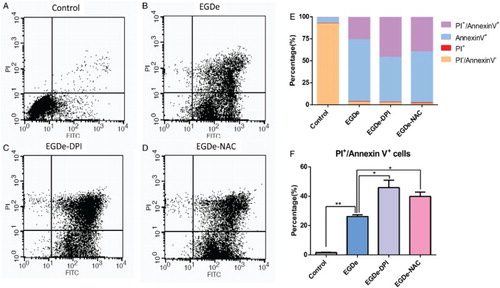
To determine the effect of bacterial infection on glial cells, we performed flow cytometry assays after the invasion of L. monocytogenes. Annexin V-FITC was used to label early apoptotic cells, and PI was used to label late apoptotic and necrotic cells. In the control group that was uninfected by bacteria, the percentages of annexin V+ and annexin V+/PI+ cells were about 5% and 1%, respectively (Fig. A, E, and F). However, in the EGDe-infected group, the percentages of annexin V+ and annexin V+/PI+ cells increased to 25% and 70%, respectively (Fig. B, E, and F). To evaluate the function of ROS on the invasiveness of L. monocytogenes, we treated the bacteria with 2.0 μM DPI and 1.0 mM NAC before adding then to the U251 cells. The resulting percentages of annexin V+/PI+ cells were about 45% and 50%, respectively, in the DPI-treated group (Fig. C, E, and F) and 40 and 55%, respectively, in the NAC-treated group (Fig. D, E, and F). The percentages of apoptotic cells in the groups treated with antioxidant significantly increased. The above mentioned results suggested that reducing the ROS of L. monocytogenes could promote the apoptosis of glial cells.
Figure 3 Apoptosis ratio of glial cells increased upon invasion by DPI- and NAC-treated L. monocytogenes. (A) Flow cytometry data of U251 cells without L. monocytogenes invasion. X-axis refers to the annexin V-FITC, and the Y-axis refers to PI. Cell status is analyzed in four quadrants, and annexin V+/PI+ double-positive cells are presented in the upper-right quadrant. (B) Flow cytometry assay of U251 cells after invasion by EGDe. (C) Flow cytometry assay of U251 cells after invasion by DPI-treated EGDe. (D) Flow cytometry assay of U251 cells after invasion by NAC-treated EGDe. (E) Statistical analysis of cells in each quadrant of the cytometry assay. (F) Statistical data of annexin V+/PI+ positive cells. Student t-test was used for statistical analysis, *P < 0.05, **P < 0.01.
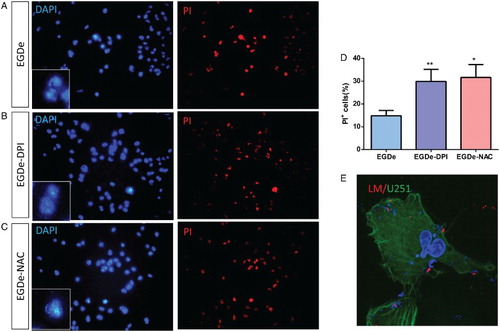
The flow cytometry results indicated that most PI+ cells were apoptotic cells while few cells were necrotic, which can be considered negligible. Based on this result, PI staining was performed under a microscope to analyze the apoptosis of glial cells. Total cells were determined by DAPI staining, and PI+ cells were considered as apoptotic cells whose nuclei were fragmented (Fig. ). After the staining, a small portion of PI+ cells was observed after EGDe invasion (Fig. A). Numerous PI+ cells were observed when the cells were invaded by DPI- or NAC-treated L. monocytogenes (Fig. B and C). The percentages of apoptotic cells were calculated by dividing the number of PI+ cells with the total number of cells. Statistical results showed that the apoptotic ratio was about 15% in the control group, and then increased up to 30% in DPI- and NAC-treated groups (Fig. D). To observe whether bacteria entered into U251 cells, L. monocytogenes was labeled with antibodies without permeation so that only the extracellular bacteria could be labeled with an antibody and the intracellular bacteria could be labeled by DAPI. From the immunostaining images (Fig. E), we observed that many bacteria entered into the U251 cells. Hence, the apoptosis of glial cells was enhanced upon infection by L. monocytogenes with low ROS levels.
Figure 4 PI staining analysis of U251 cells after invasion by L. monocytogenes. (A) DAPI and PI staining of U251 cells after invasion by EGDe without treatment. (B) DAPI and PI staining of U251 cells after invasion by 2.0 μM DPI-treated EGDe. (C) DAPI and PI staining of U251 cells after invasion by 1.0 mM DPI-treated EGDe. (D) Statistical analysis of apoptotic cells in (A–C). Apoptosis ratio was calculated by dividing the number of PI-positive cells with that of DAPI-positive cells. Student t-test was used for statistical analysis, *P < 0.05, **P < 0.01. (E) Immunostaining of L. monocytogenes. As no permeation was taken, only extracellular bacteria can be labeled (Red), intracellular bacteria and cell nucleus were labeled with DAPI (Blue), U251 cells were labeled with Acti-stain 488(Green).
Discussion
The apoptosis of host cells upon bacterial or viral infection has been observed in many cell types. Induction of apoptosis in infected cells significantly confers protection to the host from the pathogen.Citation19,Citation26 In the present study, we investigated the function of bacterial ROS in the apoptosis of host cells. The results showed that reducing ROS level in L. monocytogenes through antioxidant treatment enhanced the apoptosis of glial cells during the invasion. Hence, bacterial ROS may play an important role in the interaction between pathogens and host cells.
The cytometry results indicated that the percentage of annexin V+/PI+ cells increased in both the DPI- and NAC-treated groups compared with those in the EGDe group (Fig. E). However, the percentages of annexin V+ cells were not considerably altered, indicating that reducing the ROS level of bacteria may accelerate apoptosis. Most studies investigated the function of host ROS during infection. For example, phagocytic cells produce ROS to kill engulfed bacteria by damaging bacterial DNA and proteins.Citation27 Excessive ROS can also damage the host cells by triggering the caspase 9-based apoptosis pathway.Citation28 In the present study, we reported the function of bacterial ROS during infection. As signaling molecules, ROS affects many physiological processes in cells. Considering its membrane diffusibility, ROS may regulate the apoptosis of host cells by affecting the signaling pathways in the bacteria or host cells. The results of this study may help elucidate the mechanisms of host–pathogen interactions during L. monocytogenes infection. However, factors affecting the molecular mechanisms of bacterial ROS during invasion must be investigated in future studies.
After bacterial invasion, the total percentages of annexin V+ and annexin V+/PI+ cells were both higher than 90%, indicating that most cells underwent apoptosis instead of necrosis. This result suggests that apoptosis may be a strategy of glial cells to avoid further infection. However, another possibility also exists. As an important component of the brain's immune system, glial cells could trigger immunoresponse upon infection by playing immunomodulatory roles as CNS antigen-presenting cells secreting chemokines and cytokines.Citation29,Citation30 As no immunoresponse is triggered under apoptosis, the sensitivity of the brain's immune system may be impaired in the face of bacterial infection. This process may also be utilized by L. monocytogenes during brain infection to elude the observation of the brain's immune system.
Disclaimer statement
Contributor Sen Li conducted the study and performed experiments in Figure and Figure , Yixuan Li performed experiments in Figure and Figure , Guowei Chen and Man Wu provided assistance in performing experiments, Jingchen Zhang and Fei Xu provided pivotal advices during the research.
Funding This work was supported by funding from the Grant Program for the Shanghai Youth Teachers of Colleges [No. 10-15-308-802], and Key Programs of Science and Technology Commission of Shanghai Municipality [13391901400-3].
Conflict of interest The authors declare no conflicts of interest to this work.
Ethics approval No animals or human samples were used in this research.
References
- Lorber B. Listeriosis. Clin Infect Dis 1997;24(1):1–9; quiz 10–1. doi: 10.1093/clinids/24.1.1
- Farber JM, Peterkin PI. Listeria monocytogenes, a food-borne pathogen. Microbiol Rev 1991;55(3):476–511.
- Drevets DA, Bronze MS. Listeria monocytogenes: epidemiology, human disease, and mechanisms of brain invasion. FEMS Immunol Med Microbiol. 2008;53(2):151–65. doi: 10.1111/j.1574-695X.2008.00404.x
- Ramaswamy V, Cresence VM, Rejitha JS, Lekshmi MU, Dharsana KS, Prasad SP, et al. Listeria – review of epidemiology and pathogenesis. J Microbiol Immunol Infect 2007;40(1):4–13.
- Drevets DA, Leenen PJ, Greenfield RA. Invasion of the central nervous system by intracellular bacteria. Clin Microbiol Rev 2004;17(2):323–47. doi: 10.1128/CMR.17.2.323-347.2004
- Alvarez JI, Katayama T, Prat A. Glial influence on the blood brain barrier. Glia 2013;61(12):1939–58. doi: 10.1002/glia.22575
- Huber AK, Duncker PC, Irani DN. Immune responses to non-tumor antigens in the central nervous system. Front Oncol 2014;4:328. doi: 10.3389/fonc.2014.00328
- Holmstrom KM, Finkel T. Cellular mechanisms and physiological consequences of redox-dependent signalling. Nat Rev Mol Cell Biol 2014;15(6):411–21. doi: 10.1038/nrm3801
- Brandes RP, Weissmann N, Schroder K. Nox family NADPH oxidases: molecular mechanisms of activation. Free Radic Biol Med 2014;76:208–26. doi: 10.1016/j.freeradbiomed.2014.07.046
- Quinlan CL, Treberg JR, Perevoshchikova IV, Orr AL, Brand MD. Native rates of superoxide production from multiple sites in isolated mitochondria measured using endogenous reporters. Free Radic Biol Med 2012;53(9):1807–17. doi: 10.1016/j.freeradbiomed.2012.08.015
- Murphy MP. How mitochondria produce reactive oxygen species. Biochem J 2009;417(1):1–13. doi: 10.1042/BJ20081386
- D'Autreaux B, Toledano MB. ROS as signalling molecules: mechanisms that generate specificity in ROS homeostasis. Nat Rev Mol Cell Biol 2007;8(10):813–24. doi: 10.1038/nrm2256
- Reczek CR, Chandel NS. ROS-dependent signal transduction. Curr Opin Cell Biol 2015;33:8–13. doi: 10.1016/j.ceb.2014.09.010
- Kaihami GH, Almeida JR, Santos SS, Netto LE, Almeida SR, Baldini RL. Involvement of a 1-Cys peroxiredoxin in bacterial virulence. PLoS Pathog 2014;10(10):e1004442. doi: 10.1371/journal.ppat.1004442
- Dubbs JM, Mongkolsuk S. Peroxide-sensing transcriptional regulators in bacteria. J Bacteriol 2012;194(20):5495–503. doi: 10.1128/JB.00304-12
- Melstrom KA, Jr., Kozlowski R, Hassett DJ, Suzuki H, Bates DM, Gamelli RL, et al. Cytotoxicity of Pseudomonas secreted exotoxins requires OxyR expression. J Surg Res 2007;143(1):50–7. doi: 10.1016/j.jss.2007.02.046
- Tang Y, Zhang X, Wu W, Lu Z, Fang W. Inactivation of the sodA gene of Streptococcus suis type 2 encoding superoxide dismutase leads to reduced virulence to mice. Vet Microbiol 2012;158(3–4):360–6. doi: 10.1016/j.vetmic.2012.02.028
- Makino M, Kawai M, Kawamura I, Fujita M, Gejo F, Mitsuyama M. Involvement of reactive oxygen intermediate in the enhanced expression of virulence-associated genes of Listeria monocytogenes inside activated macrophages. Microbiol Immunol 2005;49(8):805–11. doi: 10.1111/j.1348-0421.2005.tb03661.x
- Campisi L, Cummings RJ, Blander JM. Death-defining immune responses after apoptosis. Am J Transplant 2014;14(7):1488–98. doi: 10.1111/ajt.12736
- Santos SA, Andrade DR, Andrade Junior DR. Rat hepatocyte invasion by Listeria monocytogenes and analysis of TNF-alpha role in apoptosis. Rev Inst Med Trop Sao Paulo 2005;47(2):73–80. doi: 10.1590/S0036-46652005000200003
- Rogers HW, Callery MP, Deck B, Unanue ER. Listeria monocytogenes induces apoptosis of infected hepatocytes. J Immunol 1996;156(2):679–84.
- Guzman CA, Domann E, Rohde M, Bruder D, Darji A, Weiss S, et al. Apoptosis of mouse dendritic cells is triggered by listeriolysin, the major virulence determinant of Listeria monocytogenes. Mol Microbiol 1996;20(1):119–26. doi: 10.1111/j.1365-2958.1996.tb02494.x
- Parra MC, Baquero F, Perez-Diaz JC. The role of apoptosis in Listeria monocytogenes neural infection: listeriolysin O interaction with neuroblastoma Neuro-2a cells. Infect Genet Evol 2008;8(1):59–67. doi: 10.1016/j.meegid.2007.10.002
- Balcerczyk A, Soszynski M, Rybaczek D, Przygodzki T, Karowicz-Bilinska A, Maszewski J, et al. Induction of apoptosis and modulation of production of reactive oxygen species in human endothelial cells by diphenyleneiodonium. Biochem Pharmacol 2005;69(8):1263–73. doi: 10.1016/j.bcp.2005.01.010
- Halasi M, Wang M, Chavan TS, Gaponenko V, Hay N, Gartel AL. ROS inhibitor N-acetyl-l-cysteine antagonizes the activity of proteasome inhibitors. Biochem J 2013;454(2):201–8. doi: 10.1042/BJ20130282
- Carrero JA, Unanue ER. Mechanisms and immunological effects of apoptosis caused by Listeria monocytogenes. Adv Immunol 2012;113:157–74. doi: 10.1016/B978-0-12-394590-7.00001-4
- Belikov AV, Schraven B, Simeoni L. T cells and reactive oxygen species. J Biomed Sci 2015;22(1):85. doi: 10.1186/s12929-015-0194-3
- Circu ML, Aw TY. Reactive oxygen species, cellular redox systems, and apoptosis. Free Radic Biol Med 2010;48(6):749–62. doi: 10.1016/j.freeradbiomed.2009.12.022
- Claycomb KI, Johnson KM, Winokur PN, Sacino AV, Crocker SJ. Astrocyte regulation of CNS inflammation and remyelination. Brain Sci 2013;3(3):1109–27. doi: 10.3390/brainsci3031109
- Jensen CJ, Massie A, De Keyser J. Immune players in the CNS: the astrocyte. J Neuroimmune Pharmacol 2013;8(4):824–39. doi: 10.1007/s11481-013-9480-6