
Abstract
Objective: Studies on the regulation of human blood flow revealed several modes of oscillations with frequencies ranging from 0.005 to 1 Hz. Several mechanisms were proposed that might influence these oscillations, such as the activity of vascular endothelium, the neurogenic activity of vessel wall, the intrinsic activity of vascular smooth muscle, respiration, and heartbeat. These studies relied typically on non-invasive techniques, for example, laser Doppler flowmetry. Oscillations of biochemical markers were rarely coupled to blood flow.
Methods: The redox potential difference between the artery and the vein was measured by platinum electrodes placed in the parallel homonymous femoral artery and the femoral vein of ventilated anesthetized pigs.
Results: Continuous measurement at 5 Hz sampling rate using a digital nanovoltmeter revealed fluctuating signals with three basic modes of oscillations: ∼ 1, ∼ 0.1 and ∼ 0.01 Hz. These signals clearly overlap with reported modes of oscillations in blood flow, suggesting coupling of the redox potential and blood flow.
Discussion: The amplitude of the oscillations associated with heart action was significantly smaller than for the other two modes, despite the fact that heart action has the greatest influence on blood flow. This finding suggests that redox potential in blood might be not a derivative but either a mediator or an effector of the blood flow control system.
Introduction
The blood flow control system manifests itself in rhythmic activitiesCitation1 that have been frequently studied to understand the mechanisms of cardiovascular control. Several distinct frequencies have been identified, such as metabolic (0.008–0.02 Hz), neurogenic (0.02–0.05 Hz), myogenic (0.05–0.15 Hz), respiratory (0.15–0.4 Hz), and cardiac (0.4–2.0 Hz).Citation2–Citation4 The wavelet-based method of analysis of blood flow oscillations has been adopted for further research on cardiovascular control under various conditions.Citation5–Citation8 However, we still do not understand the explicit physiologic meanings of these characteristic frequencies, and the underlying mechanisms require further validation at a biochemical level. The main issue is that oscillations in blood apply not only to blood flow or respiratory gases but also to blood pressure (so-called Mayer waves), pH,Citation9 or blood volume,Citation10 not to mention the various oscillations that appear in pathological states.
The Fick principles stem from an idea that arteriovenous concentration differences can be used to determine the state of metabolism.Citation11 As the electrochemical potential measured between blood in the artery and vein was assumed to be an effect of pH and the partial pressures of O2 and H2, platinum electrodes with the aid of injection or inhalation of hydrogen were used to detect intravascular shunts.Citation12 As the arteriovenous concentrations of metabolites were extensively studied,Citation13–Citation15 the researchers’ attention shifted to measurements of certain blood components (such as pH or pCO2) with specialized electrodes. In particular, the arteriovenous CO2 difference was frequently measured – it was assessed as a marker of, among others, hemodynamic status,Citation16 septic shock,Citation17 regional ischemic or hypoxic hypoxia.Citation18 Recently, arteriovenous differences of blood gases were supplemented by markers of anaerobic metabolism (such as lactate) and outperformed other methods in the assessment of the hemodynamic state of patients with circulatory failure.Citation19 Only recently, Ivanisevic et al.Citation20 systematically assessed arteriovenous blood metabolomics via targeted and untargeted mass spectrometry, revealing a wide spectrum of changes and concluding that this type of analysis might provide a new means of identifying possible metabolic pathway disruptions.
While it is common to consider redox pairs as a major driving force regulating biological events,Citation21–Citation23 biochemical constraints related to enzyme availability often make them indicators, not regulatory forces.Citation24,Citation25 All of the factors mentioned above (hemodynamic status, septic shock, and hypoxia) as well as many others are collectively represented by the state of blood redox components. A direct influence of certain redox pairs has been shown for blood metabolismCitation26 and for blood flow.Citation27 All of the above suggests that arteriovenous redox potential difference must be coupled to blood flow, at least at the non-neurogenic level. The difference in redox potential between arterial and venous blood was assessed several times. The redox potential was either measured directlyCitation28,Citation29 or assessed using concentrations of lactate/pyruvate couple.Citation30 In addition, the redox potential of arterial and venous blood was measured simultaneously with the same reference electrode.Citation31 In all cases, the measured values were in the range of ±200 mV. However, given that the electrode preparation protocol strongly influences the results of redox potential measurements of blood,Citation32 it is likely that all of these values bear a significant error. None of the studies mentioned above used the arteriovenous redox potential difference to assess blood flow.
In this study, we monitored the physiological and induced changes in the arteriovenous potential difference on the timescales of a second to dozens of minutes using 1–5 Hz sampling rates. Oscillations of different frequencies were identified in the measured signal, with three clear major modes most probably stemming from heart action, breathing and possibly metabolism – similar to studies on blood flow oscillations. The amplitudes of the oscillations with the highest frequency (cardiac) were much lower than the other oscillations. This observation suggests a presence of complex relationships between the redox status of the blood and the blood flow; as such, it opens a new avenue for research on cardiovascular control mechanisms.
Materials and methods
Animal preparation and placement of electrodes
The study protocol was approved by the Local Ethics Committee at Warsaw University of Life Sciences in accordance with the European Communities Council Directive of 24 November 1986 (86/609/EEC). The studies were performed on six polish landrace sows (60–95 kg body weight). During the entire study, the sows were healthy. Intramuscular injection with Azaperone (Stresnil, 3 mg/kg b.wt., i.m., Janssen Pharmaceutica, Beerse, Belgium) was administered as the sedative management at the beginning. Afterward, the combination of medetomidine (2 μg/kg ScanVet, Gniezno, Poland), butorphanol (Butomidor 0.025 mg/kg b.wt., i.m., Richter Pharma AG, Wels, Austria), and ketamine (Ketamina 10%, 20 mg/kg b.wt., i.v., Pharmanovo GmbH, Hannover, Germany) was used as the preanesthetic. The induction of general anesthesia was performed with intravenous injection with propofol (3 mg/kg b.wt., i.v., Fresenius Kabi, Bad Homburg, Germany). The endotracheal intubation was made, allowing for the maintenance of the general anesthesia with isoflurane (Aerrane 5–2‰, Baxter, Deerfield, USA) under the control ventilation (IPPV). The animals were sacrificed with pentobarbital (Morbital 0.5 ml/kg, Biowet Pulawy, Pulawy, Poland) at the end of the research procedure.
Arterial and femoral sheaths (4F) were placed bilaterally into the external iliac artery and the vein. Two standard diagnostic catheters (4F fixed curve, 4 – pole diagnostic catheters with 2,2,2 or 5,5,5 electrode spacing, St Jude Medical, MN, USA) were placed in the parallel femoral artery and the femoral vein with X-ray control (Fig. ).
Figure 1 The placement of electrodes and alignment of their signal. (A) Arrows indicate which pair of electrodes was used for measurement in the majority of experiments. Four pairs were used for multiple channel monitoring. (B) Alignment of the signal for the experiments with multiple channel vmonitoring.
The maintenance of general anesthesia was performed with isoflurane (1.5 vol.%). The signal was stabilized typically after 2 minutes from the probes via intra-arterial insertion. The data were collected five times per second and one time per second, while the respiration rate was maintained at either 8 times per minute or 12 times per minute. Due to the limitations of data acquisition equipment, a lower sampling rate was required for simultaneous monitoring of two or more voltaic channels. The blood oxygen saturation level was 100% throughout all the experiments to rule out the possibility that we measure saturation oscillations caused by hypoxic conditions.Citation33,Citation34
Signal acquisition
The dedicated system was set up on the basis of Agilent 34970A Data Acquisition/Switch unit equipped with 34901A 20-channel multiplexer module, using either Agilent BenchLink Data Logger 3 software (tested by us to be sufficient for four galvanically separated channels with a 2 Hz sampling rate) or a built in-house application that enabled the sampling rate of 5 Hz for a single channel. Both programs enabled an on-line graphical interface. Agilent company guaranties 6½ resolution with 0.004% accuracy and a thermal drift smaller than 3 µV/° outside the reference temperature range of 18–28°C (291–301 K). Altogether, the above indicates that eventual biases should not exceed 50 µV. The partial oxygen concentration was in parallel monitored with the aid of a MOX-4 Gas Sensor (MediceL®) attached to the subsequent channel of the multiplexer.
The differences in the arteriovenous potential were monitored using pairs of sensors located in parallel (see Fig. A). In all the setups, the terminal pairs were found not applicable due to the resulting extremely high noise level, probably due to vibrations from the terminal parts of the probes caused by irregular blood flow.
Data analysis
The signals were analyzed using R language and its procedures for signal analysis (package stats), including cross-correlation analyses. First of all, linear trends were removed from the data prior to analysis using the ‘detrend’ function from the package pracma. Analysis of oscillations was done using two methods, Lomb–Scargle periodogram and wavelet power spectrum.
In the first case, we have proceeded under the assumption that data are not sampled evenly (standard deviation during 5-Hz sampling was 0.0005 seconds). Therefore, the assessment of statistical significance of observed oscillations was performed using the Lomb–Scargle periodogram for unevenly sampled data implemented in the lomb package. Oscillations were judged to be statistically significant if their P-value was lower than 0.01.
In addition, we analyzed the data using the WaveletComp package to obtain the wavelet spectrum of the signal. Data were spread evenly using ‘approx.’ function implemented in R stats library. Computations of wavelet spectrum were done using 100 simulations (default of WaveletComp package) with surrogate time series generated with while noise model. On all wavelet plots contour lines delineate areas for which P-value was lower than 0.1. Coherence analysis was done using the same package. Arrows indicate areas with P-value lower than 0.05.
Results
Single channel monitoring
Electrochemical potential difference between arterial and venous blood was initially monitored for 30 minutes at a 5-Hz sampling rate but was restricted to a single channel. During the experiment, the respiration rate was precisely controlled at 8 breaths/min in two 10-minute blocks. During the central 10-minute period (10–20), the respiration was increased up to 12 breaths/min. Oscillations of the same frequency representing the actual respiratory rate were observed in both cases (see Fig. A and B). The increase in the respiratory rate resulted in a decrease in the amplitude of the EMF oscillations: from ca. 1 mV at 8 bpm to ca. 0.5 mV at 12 bpm. Cross-correlation analyses of the breathing signal and the measured potential revealed a significant correlation of the two, with breathing leading by ca. 1.2 seconds to the redox potential in blood. In addition, the interference of respiratory-related oscillations with higher frequency oscillations (∼1 Hz, 50 µV amplitude) could have been easily resolved. The latter effect should be clearly related to cardiac actions (observed at 60–80 beats/min).
Figure 2 Agreement between oscillations in redox potential and breathing. Fragment of the oscillations for two breathing frequencies, ∼7.5 Hz (A) and 5 Hz (B). The scale is preserved – faster breathing resulted in visibly lower amplitude of oscillations. (C) The wavelet analysis of the measured signal. The change in period of the observed oscillations due to change in the breathing frequency is clearly visible. Heartbeat oscillations are seen as a wide band in the period range of 0.3–1. Slow oscillations are visible, albeit not statistically significant, in this measured window.
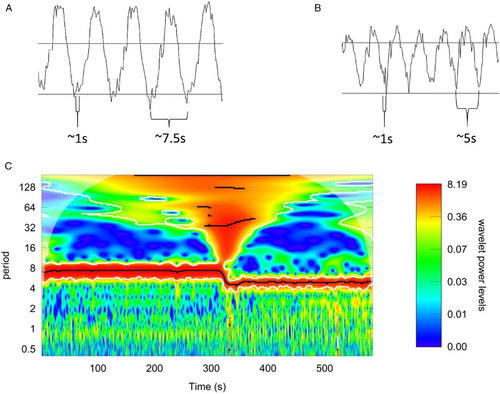
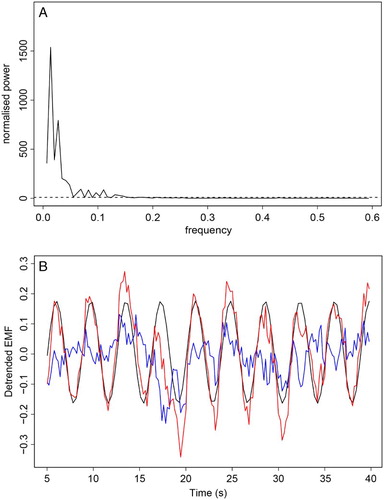
Wavelet analysis confirmed the existence of the dominant EMF oscillation of the frequency consistent with the respiration rate (Fig. C). The observed high-frequency modulations could also be identified as a band of signals located at periods 0.3–1, although these were not judged as statistically significant using this method. These values are consistent with the heartbeat rates monitored during the experiment. Variations in the EMF induced by the heartbeat were assessed by correction for respiratory oscillations by removing from the data, the regular sinusoidal signal. The resulting variability in amplitude and frequency is shown in blue in Fig. . The unambiguous evidence of fast low-amplitude oscillations (attributed to the effect of cardiac action) was supported by statistical analysis using the Lomb–Scargle periodogram method.
Figure 3 (A) Lomb–Scargle periodogram – dashed line denotes threshold of statistical significance (P-value of 0.05). Oscillations with normalized power above dashed line are statistically significant. (B) Observed signal (red), dominating the sinusoid contribution (black), and the difference between these two (blue) that represents oscillations induced by the cardiac action.
The third putative region revealed slow oscillations, the frequency of which could be estimated in the range 0.5–1 min−1 (Fig. C), which was also judged to be statistically significant in the periodogram analysis. However, often, the frequency of these oscillations was not sharply defined.
Multiple channel monitoring
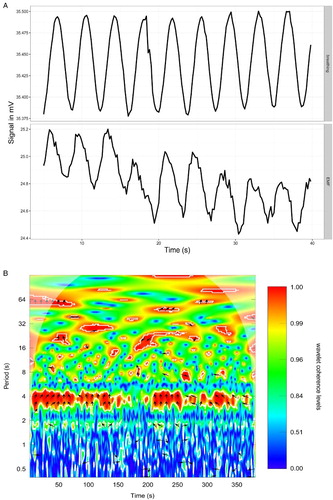
In the succeeding experiment, for a comparison, we in parallel monitored four signals at a 1-Hz sampling rate. Respiration-induced oscillations were again observed at exactly the same frequency as the respiratory rate, and the amplitudes were ca. 1 mV, as observed earlier. The phase of these oscillations was clearly synchronized with respiratory action: the rise of the signal indicated exhalation, while the drop indicated inhalation. The signal appeared to be aligned with the O2 oscillations in breathing air (Fig. A). Using cross-correlation analysis, we found that in all four pairs, the measured signal had a similar course, although it appears that either the electrodes had a different sensitivity or the location (e.g. touching the vessel wall) influenced the signal because there were substantial differences in its absolute values (Fig. A). Wavelet coherence analysis of signals from electrodes and from oxygen sensor indicate high coherence between the two, with the measured signal almost consistently shifted across the timeframe of the measurement by roughly one-fourth of the period (Fig. B). This value is consistent with the results from the cross-correlation analyses. A presence of areas of statistically significant coherence between the breathing and the redox potential at higher periods (Fig. B) requires further investigation, since these frequencies are not always identified in the wavelet power spectrum of the oxygenation signal.
Figure 4 (A) Alignment between raw data from oxygenation sensor in breathing air (upper panel) and the redox potential difference between arterial and venous blood (lower panel). The oxygenation data increase with inhalation and decrease with exhalation. (B) Wavelet coherence analysis of oxygenation signal and redox potential. Areas delineated by white contour are areas with significance level of 0.1. Arrows indicate phase difference and are placed in areas of P-value of 0.05 or lower.
Spectral density analyses again clearly evidenced respiration-related oscillations albeit slow changes of the frequency 0.3–0.4 min−1, and their first harmonics at 0.7 min−1 were also found to be statistically significant. Lomb–Scargle periodogram analyses again clearly evidenced cardiac oscillations, respiration-related oscillations, and their putative harmonics (Fig. B).
Signal variability
Placement of the electrodes and electrode exhaustion played a substantial role in the quality of the acquired signal. As long as the signal was still in the range of tens of mV, the oscillatory properties were clearly visible in all the animals. Small shifts (on the order of millimeters) in the placement could and indeed did dramatically worsen the quality of the signal. In addition, electrodes were exhausted to the point that almost no signal was acquired on the order of hours. Due to these issues, comparative analysis of the data was not possible because we did not acquire data in the same physiological stage for any animal.
Discussion
Here, we report the analysis of oscillatory modes in the arteriovenous redox potential of blood. The three modes of observed oscillations agree quite well with the three major peak oscillations of blood flow (see Rienzo et al.Citation35 and references therein) – respiratory frequency, heartbeat frequency and several floating slow modes of ca. 0.05 Hz. The same frequencies were found in blood pressure, heart-rate variability, or peripheral blood flow (although the latter exhibits the most complex low-frequency component).
Cardiac action and respiratory action result in changes in the flow of the blood. Periodic changes in the velocity of blood flowing around the electrodes in arteries can reach 10-fold but typically are ca. 5-fold.Citation36 Such changes are reflected in the measurement, as reactions on the electrodes will be influenced by oscillatory changes of the environment around the electrode. No biochemical process in the blood has sufficient speed to be responsible for the changes in the signal.
Respiratory oscillations of the measured signal are supplemented by the large arterial oscillations of oxygen partial pressure that naturally occur in blood due to breathing. The characteristics of the response of the signal to the ventilation period is similar to previously recorded measurements of pH oscillations caused by breathing in the arterial bloodCitation37,Citation38 and in the medullary extracellular fluid.Citation39 Coherence between the measured signal and the oxygenation levels observed in our experiments does not seem to be surprising, given the location of the electrodes. The coherence between skin blood flow and oxygen saturation in limbs has been already observed.Citation40 However that study failed to observe the coherence where the measurements were from deeper tissues of arms and legs. The most plausible explanation is the complexity of the tissue structure and, resulting from that, very different power spectra of oxygen saturation. In this study, where isolated vessels were studied, the signal was less prone to surrounding noise of the tissues. As for the source at biochemical level, the putative candidate for this redox reaction is any pH-dependent one, such as in the NAD+–NADH couple.
The oscillations with the longest period (ca. 100 seconds, frequency of ∼0.01 Hz) are difficult to interpret directly from metabolic processes or from oxygen partial pressure. It has been already suggested that these are metabolic-related frequencies.Citation2 Further studies on the influence of vasodilators on blood flow pointed to an endothelium-mediated mechanism.Citation3 However, these studies were focused on peripheral blood flow, where endothelium-based vasodilation has a substantial effect on blood flow. In major vessels, endothelium-based vasodilation is not likely to have significant effect on blood flow. In the search of the mechanisms, we reviewed the knowledge regarding erythrocyte metabolism. Hald et al.Citation41 have built a model of metabolic entrainment of erythrocytes based on oscillatory changes in the partial pressures of oxygen and carbon dioxide due to travel between arterial and venous blood. This model predicts an oscillatory overshoot of the central metabolites of erythrocyte's glycolysis, with a period comparable to the circulation time. Spikes in the lactate flux that presumably stem from the overshooting phenomena of erythrocyte glycolysis have a period that is in agreement with the observed oscillations. The lack of a well-defined, narrow signal is easily explainable by different circulatory travel times of red blood cells. Lactate oscillations of a similar period (few minutes) have been shown for the cerebral spinal fluidCitation42; unfortunately, no experimental confirmation for blood exists yet. Further support for this hypothesis stems from the results of Ivanisevic et al.,Citation20 as they have shown that lactate levels are significantly different between arterial and venous blood. However, further studies on dynamics of the lactate metabolism should be performed.
As shown, the oscillations in the redox potential differences between arterial and venous blood are explainable by known processes in the circulatory system. Given the larger data collection times, we would probably observe other oscillations, such as insulin spikes or circadian clock parameters. However, such observation would require a novel experimental setup, as our experiments clearly have shown the limits of standard platinum catheters.
Obviously, our work again raises the question of whether the absolute values of that potential are also meaningful and interpretable. Despite numerous attempts at such an interpretation,Citation13,Citation16,Citation28,Citation29,Citation31 at this point, we support the general premise of the Flohe essay on the GSSG-GSH coupleCitation24 that redox potential is more of an analytical tool, i.e., an indicator, and not the direct cause of the changes in the system. To have a regulatory role, several redox couples should be allowed to reach equilibrium, which is often not the case. However, further studies are required to clarify the putative link between blood flow and oscillations of biochemical markers in blood.
Disclaimer statements
Contributors Conceiving and designing the study: L.P., Z.G., J.P., and P.Z. Obtaining funding and/or ethics approval: Z.G. and L.P. Collecting the data: J.P., P.S., B.P., and T.M. Analysing the data: J.P., and P.S. Interpreting the data: J.P., P.S., B.P., T.M., P.Z., Z.G., and L.P. Writing the article in whole or in part: J.P., P.S., P.Z., and L.P. Revising the article: J.P., P.S., B.P., T.M., P.Z., Z.G., and L.P.
Funding None.
Conflicts of interest No conflict of interest declared.
Ethics approval Study protocol was approved by the Local Ethics Committee at Warsaw University of Life Sciences in accordance with the European Communities Council Directive of 24 November 1986 (86/609/EEC).
ORCID
Pawel Szczesny http://orcid.org/0000-0001-8442-0157
Tomasz Mazurek http://orcid.org/0000-0002-3693-8741
References
- Akselrod S, Gordon D, Ubel FA, Shannon DC, Berger AC, Cohen RJ. Power spectrum analysis of heart rate fluctuation: a quantitative probe of beat-to-beat cardiovascular control. Science 1981;213(4504):220–2. doi: 10.1126/science.6166045
- Bračič M, Stefanovska A. Wavelet-based analysis of human blood-flow dynamics. Bull Math Biol 1998;60(5):919–35. doi: 10.1006/bulm.1998.0047
- Kvernmo HD, Stefanovska A, Kirkebøen KA, Kvernebo K. Oscillations in the human cutaneous blood perfusion signal modified by endothelium-dependent and endothelium-independent vasodilators. Microvasc Res 1999;57(3):298–309. doi: 10.1006/mvre.1998.2139
- Söderström T, Stefanovska A, Veber M, Svensson H. Involvement of sympathetic nerve activity in skin blood flow oscillations in humans. Am J Physiol-Heart Circ Physiol 2003;284(5):H1638–46. doi: 10.1152/ajpheart.00826.2000
- Geyer MJ, Jan Y-K, Brienza DM, Boninger ML. Using wavelet analysis to characterize the thermoregulatory mechanisms of sacral skin blood flow. J Rehabil Res Dev 2004;41(6A):797–806. doi: 10.1682/JRRD.2003.10.0159
- Humeau A, Koïtka A, Abraham P, Saumet J-L, L'Huillier J-P. Spectral components of laser Doppler flowmetry signals recorded in healthy and type 1 diabetic subjects at rest and during a local and progressive cutaneous pressure application: scalogram analyses. Phys Med Biol 2004;49(17):3957–70. doi: 10.1088/0031-9155/49/17/009
- Li Z, Leung JY, Tam EW, Mak AF. Wavelet analysis of skin blood oscillations in persons with spinal cord injury and able-bodied subjects. Arch Phys Med Rehabil 2006;87(9):1207–12, quiz 1287. doi: 10.1016/j.apmr.2006.05.025
- Jan Y-K, Struck BD, Foreman RD, Robinson C. Wavelet analysis of sacral skin blood flow oscillations to assess soft tissue viability in older adults. Microvasc Res 2009;78(2):162–8. doi: 10.1016/j.mvr.2009.05.004
- Band DM, Wolff CB, Ward J, Cochrane GM, Prior J. Respiratory oscillations in arterial carbon dioxide tension as a control signal in exercise. Nature 1980;283(5742):84–85. doi: 10.1038/283084a0
- Vern BA, Schuette WH, Leheta B, Juel VC, Radulovacki M. Low-frequency oscillations of cortical oxidative metabolism in waking and sleep. J Cereb Blood Flow Metab 1988;8(2):215–26. doi: 10.1038/jcbfm.1988.52
- Zierler KL. Theory of the use of arteriovenous concentration differences for measuring of metabolism in steady and non-steady states. J Clin Invest 1961;40(12):2111–25. doi: 10.1172/JCI104437
- Clark LC, Bargeron LM, Lyons C, Bradley MN, Mcarthur KT. Detection of right-to-left shunts with an arterial potentiometric electrode. Circulation 1960;22(5):949–55. doi: 10.1161/01.CIR.22.5.949
- Grosz HJ, Farmer BB. Reduction–oxidation potential of blood as a function of partial pressure of oxygen. Nature 1967;213(5077):717–8. doi: 10.1038/213717a0
- Kraupp O, Adler-Kastner L, Kolassa N, Nell G, Plank B, Chirikdjian JJ. Arterial levels, cardiac and hepatic arteriovenous differences, extraction coefficients and oxygen extraction ratios of various substrates in normal, and in acute and chronic alloxan-diabetic dogs. Eur J Biochem 1968;6(1):114–25. doi: 10.1111/j.1432-1033.1968.tb00427.x
- Neill WA, Jensen PE, Rich GB, Werschkul JD. Effect of decreased O2 supply to tissue on the lactate:pyruvate ratio in blood. J Clin Invest 1969;48(10):1862–9. doi: 10.1172/JCI106152
- Adrogué HJ, Rashad MN, Gorin AB, Yacoub J, Madias NE. Assessing acid–base status in circulatory failure. Differences between arterial and central venous blood. N Engl J Med 1989;320(20):1312–6. doi: 10.1056/NEJM198905183202004
- Bakker J, Vincent JL, Gris P, Leon M, Coffernils M, Kahn RJ. Veno-arterial carbon dioxide gradient in human septic shock. Chest 1992;101(2):509–15. doi: 10.1378/chest.101.2.509
- Vallet B, Teboul JL, Cain S, Curtis S. Venoarterial CO(2) difference during regional ischemic or hypoxic hypoxia. J Appl Physiol Bethesda Md 1985 2000;89(4):1317–21.
- Monnet X, Julien F, Ait-Hamou N, Lequoy M, Gosset C, Jozwiak M, et al. Lactate and venoarterial carbon dioxide difference/arterial-venous oxygen difference ratio, but not central venous oxygen saturation, predict increase in oxygen consumption in fluid responders. Crit Care Med 2013;41(6):1412–20. doi: 10.1097/CCM.0b013e318275cece
- Ivanisevic J, Elias D, Deguchi H, Averell PM, Kurczy M, Johnson CH, et al. Arteriovenous blood metabolomics: a readout of intra-tissue metabostasis. Sci Rep 2015;5:12757. doi: 10.1038/srep12757
- Schafer FQ, Buettner GR. Redox environment of the cell as viewed through the redox state of the glutathione disulfide/glutathione couple. Free Radic Biol Med 2001;30(11):1191–212. doi: 10.1016/S0891-5849(01)00480-4
- Jones DP. Redefining oxidative stress. Antioxid Redox Signal 2006;8(9–10):1865–79. doi: 10.1089/ars.2006.8.1865
- Chaiswing L, Zhong W, Liang Y, Jones DP, Oberley TD. Regulation of prostate cancer cell invasion by modulation of extra- and intracellular redox balance. Free Radic Biol Med 2012;52(2):452–61. doi: 10.1016/j.freeradbiomed.2011.10.489
- Flohé L. The fairytale of the GSSG/GSH redox potential. Biochim Biophys Acta BBA-Gen Subj 2013;1830(5):3139–42. doi: 10.1016/j.bbagen.2012.10.020
- Berndt C, Lillig CH, Flohé L. Redox regulation by glutathione needs enzymes. Exp Pharmacol Drug Discov 2014;5:168.
- Rogers SC, Said A, Corcuera D, McLaughlin D, Kell P, Doctor A. Hypoxia limits antioxidant capacity in red blood cells by altering glycolytic pathway dominance. FASEB J 2009;23(9):3159–70. doi: 10.1096/fj.09-130666
- Sommer N, Dietrich A, Schermuly RT, Ghofrani HA, Gudermann T, Schulz R, et al. Regulation of hypoxic pulmonary vasoconstriction: basic mechanisms. Eur Respir J 2008;32(6):1639–51. doi: 10.1183/09031936.00013908
- Clark LC, Lyons C. Electrode systems for continuous monitoring in cardiovascular surgery. Ann N Y Acad Sci 1962;102(1):29–45. doi: 10.1111/j.1749-6632.1962.tb13623.x
- Nordenström BEW. An additional circulatory system: Vascular-interstitial closed electric circuits (VICC). J Biol Phys 1987;15(3):43–55. doi: 10.1007/BF01858151
- Sundermeyer JF, Gudbjarnason S, Wendt VE, Bakker PBD, Bing RJ. Myocardial metabolism in progressive muscular dystrophy. Circulation 1961;24(6):1348–55. doi: 10.1161/01.CIR.24.6.1348
- Jellinek M, Chandel B, Abdulla R, Shapiro MJ, Baue AE. The effect of shock on blood oxidation-reduction potential. Experientia 1992;48(10):980–5. doi: 10.1007/BF01919146
- Khubutiya MS, Evseev AK, Kolesnikov VA, Goldin MM, Davydov AD, Volkov AG, et al. Measurements of platinum electrode potential in blood and blood plasma and serum. Russ J Electrochem 2010;46(5):537–41. doi: 10.1134/S1023193510050071
- Lovell AT, Owen-Reece H, Elwell CE, Smith M, Goldstone JC. Predicting oscillation in arterial saturation from cardiorespiratory variables. Implications for the measurement of cerebral blood flow with NIRS during anaesthesia. Adv Exp Med Biol 1997;428:629–38. doi: 10.1007/978-1-4615-5399-1_88
- Williams EM, Viale JP, Hamilton RM, McPeak H, Sutton L, Hahn CEW. Within-breath arterial Po2 oscillations in an experimental model of acute respiratory distress syndrome. Br J Anaesth 2000;85(3):456–70. doi: 10.1093/bja/85.3.456
- Rienzo MD, Mancia G, Parati G. Computer analysis of cardiovascular signals. IOS Press; 1995. 340 p.
- Gabe IT, Gault JH, Ross J, Mason DT, Mills CJ, Schillingford JP, et al. Measurement of instantaneous blood flow velocity and pressure in conscious man with a catheter-tip velocity probe. Circulation 1969;40(5):603–14. doi: 10.1161/01.CIR.40.5.603
- Band DM, Cameron IR, Semple SJG. The effect on respiration of abrupt changes in carotid artery pH and PCO2 in the cat. J Physiol 1970;211(2):479–94. doi: 10.1113/jphysiol.1970.sp009288
- Cross BA, Davey A, Guz A, Katona PG, Maclean M, Murphy K, et al. The pH oscillations in arterial blood during exercise; a potential signal for the ventilatory response in the dog. J Physiol 1982;329(1):57–73. doi: 10.1113/jphysiol.1982.sp014290
- Millhorn DE, Eldridge FL, Kiley JP. Oscillations of medullary extracellular fluid pH caused by breathing. Respir Physiol 1984;55(2):193–203. doi: 10.1016/0034-5687(84)90022-7
- Bernjak A, Stefanovska A, McClintock PVE. Coherence between fluctuations in blood flow and tissue oxygen saturation. Fluct Noise Lett 2012;11(1):1240013. doi: 10.1142/S0219477512400135
- Hald B, Madsen MF, Danø S, Quistorff B, Sørensen PG. Quantitative evaluation of respiration induced metabolic oscillations in erythrocytes. Biophys Chem 2009;141(1):41–48. doi: 10.1016/j.bpc.2008.12.008
- Parkin M, Hopwood S, Jones DA, Hashemi P, Landolt H, Fabricius M, et al. Dynamic changes in brain glucose and lactate in pericontusional areas of the human cerebral cortex, monitored with rapid sampling on-line microdialysis: relationship with depolarisation-like events. J Cereb Blood Flow Metab 2005;25(3):402–13. doi: 10.1038/sj.jcbfm.9600051