
Abstract
Objectives: The aim of the work was the development of a simple method for measuring the plasma prothrombin carbonylation and the study the impact of prothrombin and fibrinogen oxidation on the rate of plasma clotting.
Methods: A new method was based on the ability of prothrombin to be adsorbed by the barium sulfate. It consists of four steps: prothrombin mixing with the water suspension of BaSO4; reaction of 2,4-dinitrophenylhydrazine with the BaSO4-bound prothrombin; desorption of prothrombin-2,4-dinitrophenylhydrazone complex from BaSO4 in an alkaline medium; neutralization and reading of the optical absorbance of the complex (λ = 370 nm). The prothrombin/fibrinogen carbonylation and plasma clotting rate in vitro in the presence of reactive oxygen species (ROS)-generating agents (0.05–0.8 mM Fe2+/H2O2) were monitored.
Results: The plasma volume required for measurement of carbonylated prothrombin was 0.4 ml. High level of linearity and reproducibility was observed (r = 0.9995, P = 0.0005 – for the protein; r = 0.9971, P = 0.0029 – for carbonyls). In the intact rats, the concentration of blood plasma prothrombin was 0.355 ± 0.009 mg/ml, and that of carbonyls was 4.94 ± 0.09 nmol/mg.
Discussion: Prothrombin and plasma clotting rate was not affected by low concentrations of ROS (0.05–0.2 mM Fe2+/H2O2). The fibrinogen was susceptible to ROS-related effect over all the used range of concentration (0.05–0.8 mM Fe2+/H2O2). Carbonylation of fibrinogen did not affect the plasma clotting activity at low ROS concentration (0.05–0.2 mM Fe2+/H2O2), however it retarded the clotting at higher ROS (0.2–0.8 mM Fe2+/H2O2).
Introduction
Oxidative modification of proteins mainly may lead to the loss of protein functional activities. Protein carbonyl content is actually the most general indicator and by far the most commonly used marker of protein oxidation.Citation1–Citation5 The accumulation of protein carbonyls has been observed in several human diseases including Alzheimer's disease, diabetes, inflammatory bowel disease, arthritis etc.Citation2,Citation3
Nowadays the protein carbonyls measurement is a routinely used approach to quantify the level of protein oxidative damage and to assess the imbalance of the pro-/antioxidant system. The most popular method of protein carbonyls assay had been suggested by Levine et al.Citation6 This method is based on the reaction of protein carbonyl groups with 2,4-dinitrophenylhydrazine (DNPH), with the consequent formation of the protein-bound 2,4-dinitrophenylhydrazones (DNP) hydrazones. These can be measured spectrophotometrically or, with greater sensitivity, immunochemically using anti-dinitrophenyl antibodies.Citation7 In order to increase the sensitivity of such measurements, several immunoassay approaches (DNPH-based Enzyme-Linked Immuno-sorbent Assay, dot blot, and Western blot) have been developed, and some commercial kits are available today.Citation8,Citation9 HPLC-separation with electrochemical detection of hydrazones can also be used.Citation10
The analysis of oxidative modifications in specific proteins is the most informative approach in investigation of the role of oxidative stress in the development of certain pathology. The joint use of anti-dinitrophenyl antibody and antibody to specific protein would probably allow to solve such a problem. However, this approach is complicated and would impact negatively the price of the test. So, the finding of simple, fast and inexpensive method for the evaluation of carbonylation of individual protein seems urgent. The development of such methods might be based on the physicochemical properties of proteins, which are underlie the protein isolation and purification techniques. Undoubtedly, this approach is not suitable for the low-abundance proteins. However, if the content of a specific protein in the biological sample is substantial, its carbonylation can be determined by combining the isolation technique with spectrophotometric measurement of DNP.
In the present work, a new method for the determination of the plasma prothrombin carbonylation is described. This method is based on prothrombin adsorption onto barium sulfate, which was followed by DNP formation. The carbonylation state of the prothrombin that was released by BaSO4 was evaluated spectrophotometrically.
Prothrombin (also called coagulation factor II) is one of the key proteins in the blood coagulation system. After enzymatic cleavage, prothrombin is converted to the active form – thrombin (factor IIa), catalyzing the conversion of fibrinogen to fibrin, thus ensuring clot formation.Citation11 Slow coagulation rate of oxidatively damaged fibrinogen was reported previously.Citation12–Citation14 However, we did not find any data concerning the level of prothrombin carbonylation and its impact on the hemostasis rate.
The aim of this study was to develop a simple method for prothrombin carbonylation measurement in blood plasma, and to analyze the impact of the oxidatively damaged prothrombin and fibrinogen on the plasma clotting rate.
Methods
Animals and blood collection
Male outbreed albino rats ranging in weight from 180 to 200 g were used. Blood was collected by heart puncture with 3.8% sodium citrate-containing syringes (9:1, v:v). Samples were, then, centrifuged (500 × g, 10 minutes). In order to monitor the impact of prothrombin and fibrinogen carbonylation on the plasma clotting rate, an aliquot of plasma was incubated for 120 minutes with 0.05–0.8 mM Fe2+/H2O2 (Fenton system).Citation15 This sample was divided to three parts and assayed for prothrombin/fibrinogen carbonylation and plasma clotting.
Prothrombin carbonylation assay
BaSO4 adsorption was used for getting the crude prothrombin preparation.Citation16 Equal volumes of citrated plasma aliquot and 3% water suspension of BaSO4 (Sigma, Taufkirchen, Germany) (0.05; 0.1; 0.2; 0.4; 0.6; 0.8; 1.0 ml) were mixed. The mixture was incubated for 60 minutes at room temperature (25°C) under shaking conditions, and then centrifuged at 1500 × g for 10 minutes. The supernatant was discarded. The sediment that was formed by prothrombin-BaSO4 complex was washed three times with 5.0 ml of 1.0 mM sodium citrate. The crude prothrombin was not eluted from the BaSO4 pellet. The reaction of DNPH with proteins in the pellet was applied as described earlier.Citation6 Further, sodium hydroxide (0.5 ml; 0.5 M) was added to the pellet (boiling water bath, 10 minutes) for desorption of prothrombin in accordance with the reaction:Finally, 2.5 ml of 8 M urea solution in 0.2 M HCl was added to dissolve the protein and to lower the pH (neutralization step). After centrifugation, the absorption spectrum of the supernatant was registered in the electromagnetic range between 230 and 600 nm, using a Hitachi 150-20 UV–VIS spectrophotometer. The amount of generated DNP was monitored at 370 nm (extinction coefficient of 22 000 M−1 cm−1).Citation6 Protein concentration was determined by the biuret method, using a calibration curve that was obtained from bovine serum albumin standards. The purity of prothrombin in the supernatant (BaSO4 eluate) was analyzed by PAAG electrophoresis (7.5%, w/v) in non-denaturing conditions, using Bio-Rad Mini-PROTEAN Tetra System.Citation17 The molecular mass of the isolated prothrombin was determined in 10% (w/v) sodium dodecyl sulfate-polyacrylamide gel electrophoresis (SDS-PAGE).Citation18
Fibrinogen carbonylation assay
Fibrinogen was precipitated from 0.1 ml of citrated plasma by the addition of 12.7% (w/v) aqueous sodium sulfate (Na2SO4) solution, up to final concentration of 10.67%.Citation19 The solution was, then, incubated at 37°C for 2 hours and then centrifuged at 2000 × g for 10 minutes. The pellet was washed three times with 5 ml of 10.67% Na2SO4 and mixed with 1 ml of 20 mM 2.4-DNPH.Citation6 The amount of DNPs formed and protein concentration were measured as described above. The purity of fibrinogen was analyzed by non-denaturing PAGE (7.5%, w/v).Citation17
Plasma clotting assay
Plasma recalcification time (PRCT) was assayed by mixing an equal volume of CaCl2 20 mM to the citrated plasma that was preincubated in a glass tube for 5 minutes at 37°C. The mixture was then incubated at 37°C, and the clot formation time was established by visual inspection.
Statistical analysis
The statistical analysis was performed using GraphPad InStat software (GraphPad Software, Inc., San Diego, CA, USA, www.graphpad.com). In particular, linear regression analyses were performed to determine the minimum amount of plasma that ensured reliable results of the concentration and the carbonylation of prothrombin in plasma. Non-parametric correlation analysis (Spearman r) was applied to characterize the relationship between prothrombin/fibrinogen carbonylation and plasma clotting rate. Five independent experiments (n = 5) were carried out and the results were expressed as means ± standard errors. P < 0.05 was considered as statistically significant.
Results
Prothrombin carbonylation assay
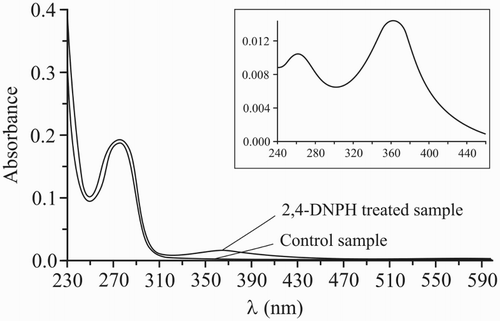
A single band of 80–90 kDa MW was shown by the SDS-PAGE performed on the BaSO4 eluate (Fig. A). The purity of prothrombin was also demonstrated through non-denaturing PAGE. It was demonstrated that isolated protein was included in the α2-globulins fraction (Fig. B). The spectral analysis revealed several absorbance picks. The absorbance maximum of prothrombin (278 nm) was detected both in the control and DNPH-treated samples. This peak is typical for aromatic aminoacids (tyrosine, tryptophane, and phenylalanine) of protein.Citation20 In differential spectrum two peaks at 262 and 367 nm were observed (Fig. ). These are typical for DNP produced in the reaction of DNPH with carbonyls of prothrombin and were assigned to π–π* and n–π* transitions of the aromatic compound (DNP).Citation21
Figure 1 Polyacrylamide gel electrophoresis of prothrombin and fibrinogen. A – SDS-PAGE electropherogram of prothrombin (BaSO4 eluate). Line 1 – molecular mass markers; Line 2 – prothrombin. B – non-denaturing PAGE of prothrombin and fibrinogen. Line 1 – rat's blood plasma; Line 2 – supernatant after proteins adsorbtion on the BaSO4 (1.5% final); 3 – prothrombin (BaSO4 eluate); Line 4 – supernatant after proteins sedimentation in Na2SO4 (10.67% final); Line 5 – fibrinogen (Na2SO4-precipitate dissolved in PBS 10 mM, pH 7.4).
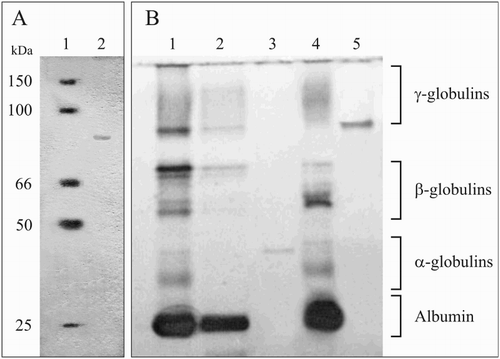
Figure 2 Optical absorption spectra of 2,4-dinitrophenylhidrazone (DNP) derivative of prothrombin. Prothrombin was isolated from 1.0 ml plasma and treated with 2,4-DNPH as described in the methods. Urea solution (8 M) was used as a blank. In control samples, all the steps of carbonylation assay procedure were retained, with the exception of the addition of 2,4-DNPH. The inset shows the differential spectrum (2,4-DNPH-treated control).
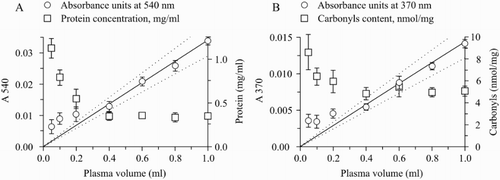
The measurement of the protein content and carbonylation (Fig. ) showed high variability and non-reproducibility of the data in the samples from 0.05 to 0.20 ml of plasma. These volumes of plasma brought to falsely overestimated data. On the other hand, high linearity of the absorbance and consistency of the final results (protein or carbonyls final concentration) was shown in the plasma samples 0.40–1.00 ml. The analysis of these samples provided the following data: 0.355 ± 0.009 mg protein/ml (values recalculated taking into account the prothrombin content in plasma) and 4.94 ± 0.09 nmol carbonyls/mg. The linear regression analysis of the 540 nm (biuret) and 370 nm (carbonyls) revealed significant correlation with initial plasma volumes (0.40–1.00 ml) (r = 0.9995, P = 0.0005 and r = 0.9971, P = 0.0029 for biuret and carbonyls, respectively).
Figure 3 Minimal plasma volume applicable for prothrombin carbonylation assay. Different volumes of plasma (0.05; 0.1; 0.2; 0.4; 0.6; 0.8; 1.0 ml) were used to establish a linearity range. A – linear regression fit for biuret: absorbance (λ = 540 nm) vs. initial plasma volume (r = 0.9995; P = 0.0005) and prothrombin content in plasma. The prothrombin content was calculated using appropriate calibration curve for biuret. B – linear regression fit for carbonyls (DNP): absorbance (λ = 370 nm) vs. initial plasma volume (r = 0.9971; P = 0.0029) and carbonyls content in prothrombin. Prothrombin carbonylation was quantified using the extinction coefficient of 22 000 M−1 cm−1. Protein concentration was calculated using the calibration curve with the bovine serum albumin. n = 5.
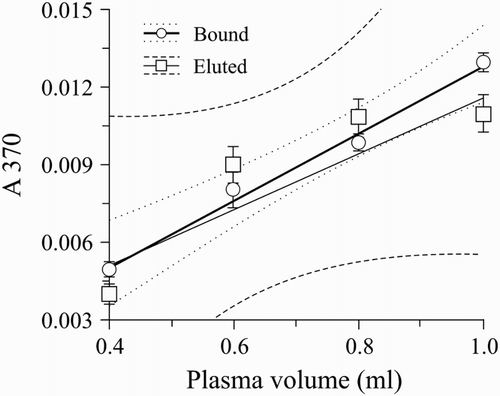
In order to qualify the advantage of DNPH reaction with BaSO4-bound prothrombin, a reaction with prothrombin that was eluted from BaSO4 (with 100 mM sodium citrate) was carried out. Results are represented as linear regression curves for the samples 0.40–1.00 ml of plasma (Fig. ). Linear regression data obtained for BaSO4-bound prothrombin (r = 0.9971; P = 0.0029) were better than those obtained on the prothrombin that was eluted from BaSO4 before the reaction (r = 0.9129; P = 0.081).
Figure 4 Data on the reaction of DNPH with BaSO4-bound and eluted prothrombin. Linear regression fit for carbonyls (DNP): absorbance (λ = 370 nm) vs. initial plasma volume. Bound – BaSO4-bound prothrombin was used for carbonylation assay (r = 0.9971; P = 0.0029); Eluted – prothrombin eluted from BaSO4 was used for carbonylation assay (r = 0.9129; P = 0.081). n = 5.
Effects of ROS on prothrombin and fibrinogen carbonylation in vitro
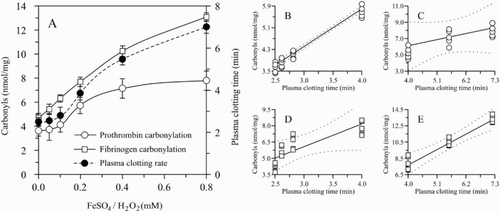
Non-denaturing PAGE revealed that the purity of the separated fibrinogen was sufficient. A single band near the γ-globulins fraction was observed (Fig. B). The dynamics of prothrombin/fibrinogen carbonylation and plasma clotting velocity (PRCT) was traced in vitro after treatment with ROS generated agents (0.05–0.80 mM of Fe2+/H2O2). We showed that low concentrations of ROS (0.05–0.20 mM Fe2+/H2O2) did not affect significantly the level of prothrombin carbonylation and plasma clotting activity (Fig. A), whereas the prothrombin carbonylation was sharply increased in the interval of 0.20–0.40 mM of Fe2+/H2O2, reaching a plateau. On the other hand, plasma clotting rate gradually increased in the range of 0.20–0.80 mM Fe2+/H2O2. In the same time, the fibrinogen was susceptible both to low and high ROS concentrations. A gradual increase of fibrinogen carbonylation was observed concurrently to the increase of Fe2+/H2O2 concentration in the whole range used (0.05–0.8 mM). Non-parametric correlation (Spearman r) analysis between protein carbonylation and plasma coagulation velocity revealed higher correlation values between PRCT and prothrombin oxidation (r = 0.9409; P < 0.0001) obtained using lower ROS concentrations – 0.05–0.20 mM of Fe2+/H2O2 (Fig. B), and between PRCT and fibrinogen oxidation (r = 0.9487; P = 0.0004) obtained using higher concentrations of ROS-generating agents – 0.20–0.80 mM (Fig. E).
Figure 5 ROS effect on prothrombin/fibrinogen carbonylation and plasma clotting rate. ROS were generated by adding different concentrations of Fe2+/H2O2 (0.05–0.8 mM final). A – dynamics of protein carbonylation and plasma clotting rate in the presence of increasing concentrations of oxidizing agents; B – correlation between prothrombin carbonylation and plasma clotting rate in poor ROS-generating conditions (0.05–0.20 mM of Fe2+/H2O2): r = 0.9409; P < 0.0001; C – correlation between prothrombin carbonylation and plasma clotting rate in ROS-enriched conditions (0.20–0.80 mM of Fe2+/H2O2): r = 0.8433; P = 0.0061; D – Correlation between fibrinogen carbonylation and plasma clotting rate in poor ROS-generating conditions: r = 0.8853; P = 0.0003; E – Correlation between fibrinogen carbonylation and plasma clotting rate in ROS-enriched conditions: r = 0.9487; P = 0.0004. n = 5
Discussion
Prothrombin isolation and purification technique includes barium salts adsorption and elution, ion-exchange chromatography and gel filtration steps with final yield of prothrombin about 50%.Citation16,Citation22 In order to simplify the purification process and minimize the loss of the protein, a new method was restricted to BaSO4 adsorption followed the removal of unbound proteins. As shown above, it was enough for the subsequent detection of prothrombin carbonyls. Other vitamin K-dependent proteins (VKDPs) adsorption on BaSO4 was anticipated.Citation23 Nevertheless, prothrombin concentration in plasma is much higher than those of VKDPs.Citation24 This aspect strengthens the idea that other VKDPs would not hinder the assay, especially if prothrombin is purified from small plasma volumes (less than 1.0 ml). Indeed, single band of 80–90 kDa was observed in SDS-PAGE. This is in good accordance with rat prothrombin MW (86 kDa) reported by Li and Olson.Citation16 Prothrombin identity and purity were also proved by native PAGE. A single band was observed in the a2-globulins fraction, which is typical for prothrombin.Citation25 Concentrations of other VKDPs were probably below the sensitivity of PAGE method, thus, their contribution to the final result of the proposed method was negligible.
Several peaks characteristic for protein (278 nm) and DNP (262 and 367 nm) were observed in the absorbance spectra of prothrombin-DNP adduct, which indicates the reliability of the suggested approach for the carbonylation assay. The good linearity of the assay was shown in the range of the initial plasma volume of 0.4–1.0 ml.
The protein loss due to washing is probably the main hindrance for the measurement of carbonylation of the protein, when it is present in low concentration. This obstacle was fixed by adding DNPH to the pellet of prothrombin adsorbed on BaSO4. This modification results in increasing the reproducibility and linearity of the assay, as compared to the reaction carried out with dissolved prothrombin eluted from BaSO4 prior to the reaction.
The threshold of prothrombin sensitivity to low concentrations of ROS has been detected (0.20 mM). This was the same threshold for the plasma clotting rate. On the other hand, fibrinogen was shown to be susceptible to low ROS concentrations (0.05 mM), nevertheless this phenomenon was not reflected on the plasma clotting rate. This probably means that with low ROS concentrations, plasma clotting is not affected by oxidized fibrinogen because the prothrombin remains undamaged. On the other hand, with higher ROS concentrations, plasma clotting rate was shown to be affected, which was due to the oxidative damage of the fibrinogen, but not of the prothrombin. Thus, it might be assumed, that prothrombin remains unaffected in mild oxidative stress conditions, and this could be reflected to the prevention of major flaws of the hemostasis rate.
Conclusions
A new method to assay plasma prothrombin carbonylation was developed. This involved prothrombin adsorption on BaSO4, and removal of unadsorbed proteins, as well as the reaction of DNPH with the BaSO4-bound proteins. This method is characterized by simplicity, rapidness and high linearity. Prothrombin was shown susceptible to ROS (no less than 0.20 mM Fe2+/H2O2) and this impacted negatively on plasma clotting activity. On the other hand, fibrinogen carbonylation did not affect the plasma clotting activity with low ROS concentration, unless it is heavily damaged.
Disclaimer statements
Contributors None.
Funding The research is supported by State Committee Science, Ministry of Education and Science of Armenia within the frames of joint Armenian – Belarusian research project № 13РБ-047.
Conflict of interest No conflict of interests.
Ethics approval None
Acknowledgements
Author is especially appreciates to Dr Stefano Falone (University of L'Aquila) for detailed proofreading of the article. Author is also grateful to Dr Sona Mardanyan – head of Laboratory of Adenyline Compaunds Methabolism at the Institute of Biochemistry of NAS RA, to Dr Hermine Yeritsyan – researcher of the Laboratory of Medical Biotechnology at the same Institute, and to Dr Ruzanna Shahinyan – Director of the Language Center of Armenian National Agrarian University for critical reading of the manuscript and language editing.
References
- Dean RT, Fu S, Stocker R, Davies MJ. Biochemistry and pathology of radical-mediated protein oxidation. Biochem J 1997;324:1–18. doi: 10.1042/bj3240001
- Chevion M, Berenshtein E, Stadtman ER. Human studies related to protein oxidation: protein carbonyl content as a marker of damage. Free Radic Res 2000;33:S99–108.
- Dalle-Donne I, Rossi R, Giustarini D, Milzani A, Colombo R. Protein carbonyl groups as biomarkers of oxidative stress. Clin Chim Acta 2003;329:23–28. doi: 10.1016/S0009-8981(03)00003-2
- Shacter E. Quantification and significance of protein oxidation in biological samples. Drug Metab Rev 2000;32:307–26. doi: 10.1081/DMR-100102336
- Beal MF. Oxidatively modified proteins in aging and disease. Free Radic Biol Med 2002;32 (9):797–803. doi: 10.1016/S0891-5849(02)00780-3
- Levine RL, Garland D, Oliver CN, Amici A, Climent I, Lenz AG, et al. Determination of carbonyl content in oxidatively modified proteins. In: Packer L, Glazer AN, (eds.) Oxygen radicals in biological systems part B: oxygen radicals and Antioxidants. Methods in enzymology. Vol. 186. San Diego: Academic Press; 1990. p. 464–478.
- Luo S, Wehr NB. Protein carbonylation: avoiding pitfalls in the 2,4-dinitrophenylhydrazine assay. Redox Rep 2009;14 (4):159–66. doi: 10.1179/135100009X392601
- Rogowska-Wrzesinska A, Wojdyla K, Nedi O, Baron CP, Griffiths HR. Analysis of protein carbonylation – pitfalls and promise in commonly used methods. Free Radic Res 2014;48 (10):1145–62. doi: 10.3109/10715762.2014.944868
- Alamdari DH, Kostidou E, Paletas K, et al. High sensitive Enzyme-Linked Immunosorbent Assay (ELISA) method for measuring protein carbonyl in samples with low amounts of protein. Free Radic Biol Med 2005;39:1362–7. doi: 10.1016/j.freeradbiomed.2005.06.023
- Purdel NC, Margina D, Llie M. Current methods used in the protein carbonyl assay. Annu Res Rev Biol 2014;4 (12):2015–26. doi: 10.9734/ARRB/2014/8763
- Wolberg AS. Thrombin generation and fibrin clot structure. Blood Rev 2007;21 (3):131–42. doi: 10.1016/j.blre.2006.11.001
- Upchurch GR Jr, Ramdev N, Walsh MT, Loscalzo J. Prothrombotic consequences of the oxidation of Fibrinogen and their inhibition by Aspirin. J Thromb Thrombolysis 1998;5:9–14. doi: 10.1023/A:1008859729045
- Azizova OA, Aseichev AV, Piryazev AP, Roitman EV, Shcheglovitova ON. Effects of oxidized fibrinogen on the functions of blood cells, Blood clotting, and rheology. Bull Exp Biol Med 2007;144:397–407. doi: 10.1007/s10517-007-0341-2
- Sermin T, Kurtukulus K, Turay Y. Effect of oxidized fibrinogen on hemostatic system: in vitro study. Clin Appl Thromb Hemost 2011;17 (3):259–63. doi: 10.1177/1076029610363129
- Goldstein S, Meyerstein D, Czapski G. The Fenton reagents. Free Radic Biol Chem 1993;15 (4):435–45. doi: 10.1016/0891-5849(93)90043-T
- Li L.-F., Olson RE. Purification and properties of rat prothrombin. J Biol Chem 1967;242:5611–6.
- Wen J, Zhang M, Horan TP, Philo JS, Li TS, Wypych J, et al. Copper staining method for extracting biologically active proteins from native gels. Biosci Biotechnol Biochem 2001;65:1315–20. doi: 10.1271/bbb.65.1315
- Laemly UK. Cleavage of structural proteins during the assembly of the head of bacteriophage T4. Nature (Lond.);1970;227:680–5. doi: 10.1038/227680a0
- Cohen S. Plasma protein distribution and turnover in the female baboon. Biochem J 1956;64:286–96. doi: 10.1042/bj0640286
- Schmid F.-X. Biological macromolecules: UV–visible spectrophotometry. Encyclopedia of life sciences, Macmillan Publishers Ltd, Nature Publishing Group; 2001. doi:10.1038/npg.els.0003142.
- Bijudas K, Bashpa P, Ayasha Nasrin KP, Krishnapriya K, Krishnan R. Selective oxidation of benzyl alcohols to benzaldeyhydes under phase transfer catalysis. Chem Sci Rev Lett 2014;3(10):123–126.
- Bajaj SP, Mann KG. Simultaneous purification of bovine prothrombin and factor X. J Biol Chem 1973;248:7729–41.
- Johnson HV, Martinovic J, Johnson BC. Vitamin K and the biosynthesis of the glycoprotein prothrombin. Biochem Biophys Res Commun 1971;43:1040–8. doi: 10.1016/0006-291X(71)90567-5
- Schaller J, Gerber S, Kämpfer U, Lejon S, Trachsel C. Human blood plasma proteins. Structure and functions. Chichester, West Sussex: John Wiley & Sons Ltd.; 2008.
- Marks V, Cantor Th, Mesko D, Pullmann R, Nosalova G. Differential diagnosis by laboratory medicine: a quick reference for physicians. Berlin Heidelberg: Springer-Verlag; 2002. p. 187.