
ABSTRACT
Objectives: Reports investigating the effects of antioxidants on obesity have provided contradictory results. We have previously demonstrated that treatment with the antioxidant N-acetylcysteine (NAC) inhibits cellular triglyceride (Tg) accumulation as well as total cellular monoamine oxidase A (MAOA) expression in 3T3-L1 mature adipocytes (Calzadilla et al., Redox Rep. 2013;210–218). Here we analyzed the role of NAC on adipogenic differentiation pathway.
Methods: Assays were conducted using 3T3-L1 preadipocytes (undifferentiated cells: CC), which are capable of differentiating into mature adipocytes (differentiated cells: DC). We studied the effects of different doses of NAC (0.01 or 1 mM) on DC, to evaluate cellular expression of phospho-JNK½ (pJNK½), phospho-ERK½ (pERK½) and, mitochondrial expression of citrate synthase, fumarate hydratase and MAOA.
Results: Following the differentiation of preadipocytes, an increase in the expression levels of pJNK½ and pERK½ was observed, together with mitotic clonal expansion (MCE). We found that both doses of NAC decreased the expression of pJNK½ and pERK½. Consistent with these results, NAC significantly inhibited MCE and modified the expression of different mitochondrial proteins.
Discussion: Our results suggested that NAC could inhibit Tg and mitochondrial protein expression by preventing both MCE and kinase phosphorylation.
Introduction
Current studies show that oxidative stress is involved in the development of obesity and that increased levels of reactive oxygen species (ROS) are present in cells with an accumulation of fat.[Citation1,Citation2] We have shown that the accumulation of triglycerides (Tgs) increases the level of ROS during 3T3-L1 cellular differentiation. In response to this stress and the potential metabolic oxidation that could affect cell viability, the system responds by increasing the activity of antioxidant enzymes such as superoxide dismutase. As a result, differentiation can occur without affecting the cell.[Citation3] Therefore, we studied the effect of an antioxidant precursor of glutathione (GSH); n-acetylcysteine (NAC) and, demonstrated that 0.01 mM NAC provides effectively inhibits adipocyte differentiation by inhibiting the expression of the adipogenic transcription factors C/EBP/β and PPARγ, as well as, terminal differentiation protein ap2.[Citation3,Citation4] Addition of 0.01 mM NAC to cells increased the total intracellular GSH content by 25% after 1 day of the differentiation protocol, and this effect was maintained throughout the entire experiment.[Citation3]
The ERK and JNK mitogen activated protein kinases (MAPKs) are intracellular signaling pathways that play pivotal role in many cellular process such proliferation and adipocyte differentiation,[Citation5] ERK½ can promote adipogenesis.[Citation6,Citation7] Thus, an exploration of the molecular regulation of ERK½ and JNK½ during an antioxidant treatment that inhibits the accumulation of Tgs should be important to better understand the role reactive oxygen species in the differentiation of preadipocytes to adipocytes.
ROS may be generated either by excessive stimulation of NAD(P)H oxidases or by other mechanisms such as production by mitochondria.[Citation8] In mitochondria, the tricarboxylic acid (TCA) cycle is crucial in the redox cell state and, some authors have reported that defects in TCA cycle enzymes can induce redox alterations in the cell.[Citation9] Recent reports show that the function of mitochondria is crucial in human obesity; the expression levels of some mitochondrial proteins are reduced in adipocytes of omental adipose tissue, correlating inversely to the BMI index, such as citrate synthase (CS).[Citation10] Because the TCA cycle is a core pathway for the metabolism of lipids, we evaluated CS and fumarate hydratase (FH) in this model.
Our aim is to investigate the hypothesis that NAC could be responsible of inhibiting Tg accumulation by modifying MAPK pathway and some mitochondrial TCA cycle enzymes expression.
Materials and methods
Cell cultures and drugs
The 3T3-L1 cell line was obtained from the American Type Culture Collection (Rockville, MD, USA). The cells were cultured at 37°C with 5% CO2 in standard medium: Dulbecco’s Modified Eagle’s Medium (DMEM) supplemented with 25 mM glucose and 10% fetal bovine serum. Unless indicated otherwise, all antibodies were purchased from Sigma–Aldrich Inc.
3T3-L1 adipocyte differentiation
The 3T3-L1 preadipocytes were first cultured in MDI medium (0.5 mM 3-isobutyl-1-methyl xanthine, 0.1 μM dexamethasone, and 2 μM insulin) for 48 hours. They were then transferred to fresh DMEM (25 mM glucose; 10% FBS) supplemented with 2 μM insulin and incubated for three days. The cells were then cultured in fresh DMEM (25 mM glucose; 10% FBS) for the remainder of the experiment. DMEM (25 mM glucose; 10% FBS) was considered vehicle. Day 0 of differentiation was defined as the time at which the cells were first introduced to MDI medium. At day 10, the cellular Tg content of 70–80% dramatically increased, thereby generating refractive droplets that were easily observed by microscopy or Oil Red O staining. MDI-treated cells were considered differentiating cells (DC), and vehicle-treated cells were considered control cells (CC).
NAC was added to the MDI medium at day 0 of differentiation and maintained in the medium throughout the remainder of the experiment; these cells were considered NAC-treated differentiating cells (DCN).
Proliferation assay
Cells (50 × 104) were seeded on a plate and cultured in the presence of vehicle or NAC (0.01 or 1 mM). At the indicated times (24 and 48 hours post-differentiation), the cells were counted. Viable cells were discriminated by trypan blue stain exclusion.
Mitochondrial extracts
Mitochondria were isolated using a technique developed with MACS technology with a mitochondria isolation kit (Miltenyi Biotec). Briefly, the cells were lysed and the mitochondria were magnetically labeled with mouse anti-TOMM22 (translocase of the outer membrane of mitochondria; 22 kDa) microbeads, which specifically bind to mitochondria. Next, the labeled tissue lysate was passed through a 30-μm filter and loaded onto a MACS column, which was placed in a magnetic field separator. The magnetically labeled mitochondria were retained within the column, while the unlabeled organelles and cell components ran through the column. After removing the column from the magnetic field, the retained mitochondria were eluted with 1.2 mL of separation buffer provided in the kit. The mitochondrial extracts were centrifuged, and the supernatant was discarded. The mitochondrial pellets were frozen at −70°C until use.
Western blots
To evaluate the kinases, the assays were performed according to the manufacturer’s protocol. Briefly, the experiment was conducted by culturing the cells overnight in medium containing 0.5% FBS to reduce basal levels of phosphorylation; subsequently, MDI medium or MDI medium with NAC (0.01, 0.05, 1 or 5 mM) was added to the cells. Vehicle-treated cells were also cultured in the absence (CC) or presence of NAC (CCN). After treatment, the cell extract was evaluated by western blot analysis; antibodies directed against JNK½, pJNK½, ERK½, p ERK½ and β-actin were used.
To confirm effectively inhibition of phosphorylation of ERK and JNK, cells were treated for 2 hours in the presence of ERK½ inhibitor (10 μM UO126; Sigma) or JNK½ inhibitor (10 μM SP600125; Sigma) prior to MDI medium or MDI + 5 mM NAC treatments.
To assess mitochondrial proteins, cells growing in standard medium were cultured in the absence or presence of NAC in MDI medium. Vehicle-treated cells were also cultured in the absence (CC) or presence of NAC (CCN). MDI-cultured cells in the absence of NAC were collected 10 days after initiating the differentiation protocol (DC); MDI-treated cells cultured in the presence of NAC were collected after two different treatments conducted for 10 days after initiating the differentiation protocol: 0.01 mM NAC treatment (DCN-0.01) and 1 mM NAC treatment (DCN-1). The primary antibodies were as follows: anti-monoamine oxidase A (MAOA), anti-FH and, anti-CS (Santa Cruz Biotechnology INC). Total cellular extracts or mitochondrial extracts were obtained. The expression was normalized to TOMM22 (mitochondrial extracts).
For the western blot analyses and protein determination, scraped 3T3-L1 cells were lysed in lysis buffer (1% SDS in 60 mM Tris–HCl), boiled for 10 minutes and centrifuged at 15 000 rpm at 4°C for 10 minutes. The samples were then resuspended in buffer supplemented with protease inhibitor mixture (Thermo Protease Inhibitor Cocktail). The proteins were separated in a 10% SDS-polyacrylamide gel and transferred to nitrocellulose membranes (Amersham, GE Healthcare). To evaluate kinase, western blot analyses were performed using 40 μg of 3T3-L1 lysate protein; to assess mitochondrial proteins, 10 μg from each sample was used.
The membranes were soaked in blocking buffer (5% BSA, 0.4% Tween, and 1 mM EDTA in 0.01 M PBS) for 1 hour, incubated overnight with primary antibody at 4°C. To detect the western blot signal, membrane were probed with horseradish-peroxidase conjugated secondary antibodies (Santa Cruz Biotechnology), and then treated with an enhanced chemiluminescence (ECL) substrate kit (Amersham ECL plus western blotting detection system, GE Healthcare). The results are expressed as arbitrary units. The proteins were quantified using the Bradford method with crystalline bovine serum albumin as a standard.[Citation11]
Statistical analysis
The results are expressed as the mean ± SD. Statistical analyses was performed using one-way analysis of variance followed by a post hoc analysis.[Citation12] The results represent the average of independent experiments (mean ± standard deviation [SD]). F values and degrees of freedom were calculated for each experiment. Results were considered statistically significant at p < 0.01.
Results
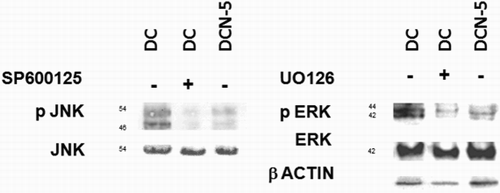
Adipocyte differentiation indicates the occurrence of MAPK phosphorylation, thus we decided to evaluate the effect of antioxidants on the phosphorylation of the kinases JNK and ERK. Non-toxic doses of NAC were evaluated (0.01–5 mM) in this system (). A marked significant decrease in JNK½ phosphorylation was observed in response to different doses of NAC ((a)). Treatment with the lowest dose of NAC (0.01 mM) diminished the levels of pJNK½ almost 50% without affecting JNK. Similarly, both 0.01 mM (DCN-0.01) and 1 mM (DC-1) NAC resulted in a nearly 50% decrease in the phosphorylation of ERK½ ((b)). The results showed that NAC effectively decreased the phosphorylation of both kinases. Vehicle − NAC-treated cells (CCN) showed a not significant increase in p ERK½ expression. Inhibit treatments for ERK½ and pJNK½ showed effectively inhibition of both phospho-kinases protein expression (), as well as, 5 mM NAC treatment.
Figure 1. Effect of NAC on 3T3-L1 cells at 10 days of differentiation. Control cells (CC); MDI-treated cells (DC); MDI + 0.01 mM NAC-treated cells (DCN-0.01); MDI + 5 mM NAC-treated cells (DCN-5). Representative results from one of four independent experiments with similar results are shown.
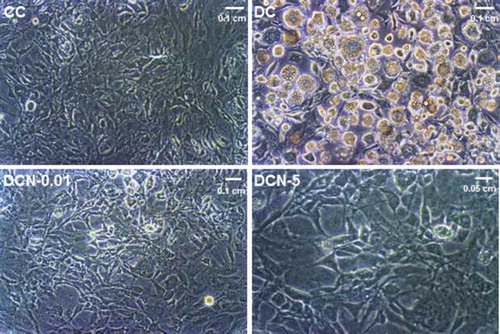
Figure 2. Kinase phosphorylation in response to NAC treatment. Comparison of control cells (CC); Vehicle + NAC-treated cells (CCN); MDI cells (DC); MDI + NAC-treated cells (DCN-0.01: 0.01 mM NAC; DCN-0.05: 0.05 mM NAC; DCN-1: 1 mM NAC; DCN-5: 5 mM NAC). Values represent the fold decrease in protein expression compared with DC. Bars show the average of four different experiments (means ± SD). Representative results from one of independent western blot experiments with similar results are shown. The results are expressed as arbitrary units, *p < 0.01 CC, CCN or DCN vs. DC. (a) JNK½ phosphorylation. Results were normalized to JNK expression, (F = 59.32, degrees of freedom = 21). (b) ERK½ phosphorylation. The results were normalized to ERK and β-actin expression, (F = 39.40, degrees of freedom = 21).
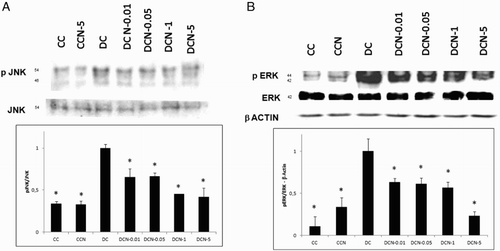
Figure 3. Kinase phosphorylation is abrogated when pre-treated with inhibitors to JNK½ or ERK½. Cells were pre-treated for 2 hours with JNK (SP600125) or ERK (UO126) inhibitor and then treated with MDI (DC) or MDI + 5 mM NAC (DCN-5). Representative results from one of independent western blot experiments with similar results are shown. (a) JNK½ phosphorylation was assessed via western blot analysis and compared to JNK. (b) ERK½ phosphorylation was assessed via western blot analysis and compared to ERK.
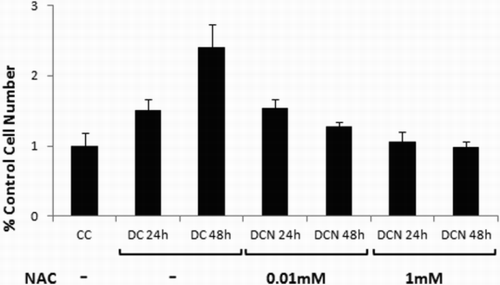
Because ERK½ phosphorylation is involved in cellular proliferation, we evaluated mitotic cellular expansion (MCE) during adipogenic differentiation. As shown in , DC cell number increased 2.5 fold more than CC cell number on day 2 of the differentiation protocol (DC: 1.3 × 10⁶ ± 0.18 × 10⁶ cells/mL vs. CC: 0.51 × 10⁶ ± 0.09 × 10⁶ cells/mL, p < 0.01). Both doses of NAC had an inhibitory effect on MCE ().
Figure 4. Effect of NAC on 3T3-L1 cells during MCE. Comparison of control cells (CC); MDI cells (DC); MDI + NAC-treated cells (DCN). Cells were harvested at day 1 (DC 24 hours, DCN 24 hours) or at day 2 (DC 48 hours, DCN 48 hours) of the differentiation protocol. The concentration of NAC is shown. Cells were counted and, viable cells were evaluated by trypan blue stain exclusion. Data represent the percentage of CC. Results are the average of four different experiments (mean ± SD).
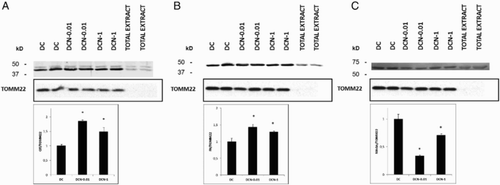
We have shown [Citation3] that during differentiation, there is a marked increase in ROS with a concomitant elevation of antioxidant enzymes. This finding supports the occurrence of aerobic respiration. Although mitochondrial dysfunction is implicated in the pathogenesis of obesity, the molecular mechanisms underlying obesity-related metabolic abnormalities are not well established. Therefore, we decided to evaluate some of the mitochondrial proteins that are important for respiration, such as CS and FH, which participate in the Krebs cycle. In all of the assessed cases, we evaluated two treatment conditions: 0.01 mM NAC (DCN-0.01) and 1 mM NAC (DCN-1). The expression levels of the CS ((a)) and FH ((b)) enzymes increased in mitochondria in response to both NAC treatments. Although the expression levels of the mitochondrial proteins CS and FH differed between the two NAC treatments, none of these differences were statistically significant. Recently, we have demonstrated that the expression levels of some obesity-related proteins are inhibited by treatment with NAC.[Citation4] In the present study, we evaluated MAOA in the mitochondrial extract because it is present in the outer membrane of mitochondria and we confirmed that MAOA expression decreased in response to NAC ((c)) in both treatment regimens. However, MAOA showed a biphasic response to NAC; its expression was higher in DCN-1 than in DCN-0.01. It is worth noting that we used 10μg of each protein extract to perform the western blots analysis. Thus, because TOMM22 was only observed in the mitochondrial extract, we can assume that higher amounts of protein are required to detect TOMM22, as described by Yano et al.[Citation13]
Figure 5. CS (a), FH (b) and MAOA (c) expression in response to NAC treatment. Comparison of MDI cells (DC) and MDI + NAC-treated cells (DCN-0.01: 0.01 mM NAC; DCN-1: 1 mM NAC). Values represent the fold increase or decrease in protein expression compared with DC. Results were normalized to TOMM22 expression. Bars show the average of two different experiments (mean ± SD). Representative results from one of two independent western blot experiments performed in duplicate with similar results are shown. The results are expressed as arbitrary units, *p < 0.01 DCN vs. DC, (CS (a): F = 94.77, degrees of freedom = 9; FH (b): F = 31.97, degrees of freedom = 9; MAOA (c): F = 162.81 degrees of freedom = 9).
Discussion
For adipocyte differentiation to occur, activation of PPARγ is crucial,[Citation3] because this transcription factor recognizes a specific site in the promoter of the ap2 gene to induce its expression in adipocytes.[Citation4] The activation of certain MAPK family members via phosphorylation, including ERK½ and JNK, could be essential for adipocyte differentiation; ERK½ can be activated early in differentiation and is responsible for activating the transcription of C/EBPβ and, thus, PPARγ.[Citation14] Insulin has been shown to activate the MAPK pathway [Citation15]; the effect of insulin on the early stage of the differentiation pathway depends on IGF-receptor activation. Insulin and IGF-1 are well known proadipogenic hormones that are required for adipocyte differentiation.[Citation16] Both, insulin and IGF-1 stimulate the production of ROS, and some authors have suggested that IGF-1 exerts is effect at least in part via ROS.[Citation17] In fact, increased levels of ROS during preadipocyte differentiation have been demonstrated.[Citation2,Citation3] Here, we showed that a NAC concentration as low as 0.01 mM inhibited the phosphorylation of ERK½ and JNK½. NAC is a glutathione precursor and can enhance the antioxidant capacity of the cell both by acting directly as a scavenger of free radicals and by increasing glutathione levels. It is worth to mention that there is a link between the redox active components of glutathione S-transferases such as glutathione S-transferase Pi (GSTP) and stress-activated kinases. Glutathione S-transferases are vital function enzymes in chemical detoxification; in fact, GSTP regulates the activity of numerous biologic pathway, such as JNK.[Citation18] The mechanism traditionally reported for JNK – GSTP considered GSTP as an endogenous regulator of JNK activity, forming a complex which is dissociated by ROS-mediated oxidation. ROS scavengers, such as NAC, prevent GSTP dissociation from JNK and maintain the low basal activity of JNK as a kinase.[Citation19]
We observed MCE in agreement with previous finding.[Citation20,Citation21] It is well established that expression of C/EBPβ in the adipogenic cascade is required for cell proliferation [Citation22,Citation23]; NAC treatment leads to reduced expression of C/EBPβ [Citation3,Citation24] and, as a consequence, inactivates MCE. NAC treatment maintained the number of cells observed at day 0 of the differentiation protocol, confirming its inhibitory effect on cellular proliferation.
Owing to the role of ROS, in this adipogenic differentiation pathway, is also important to assess their effect on proteins involved in aerobic respiration, because up to 5% of ROS result from physiological respiration. Therefore, we evaluated the expression of two mitochondrial proteins that are involved in the Krebs cycle, CS and FH. Recent reports have suggested that the expression and activity of CS, the enzyme that catalyzes the first reaction of the Krebs cycle, are reduced in obesity.[Citation10,Citation25] Our results revealed an increase tendency in mitochondrial CS expression following NAC treatment, consistent with the inhibitory effect of NAC on Tg accumulation. FH is one of the enzymes responsible for NADH production via the Krebs cycle, allowing aerobic respiration. We showed a discreet increase in the mitochondrial expression of this enzyme in response to NAC treatment. Other researchers have shown that a deficiency in FH expression promotes renal cellular proliferation.[Citation26] We hypothesize that the increase in FH correlated with the inhibitory effect of NAC on 3T3-L1 proliferation. CS and FH expression were also evaluated in the total cellular extract, confirming the mitochondrial results (data not shown). Consistent with previous results from our laboratory,[Citation4] we found that the expression of mitochondrial MAOA decreased following treatment with NAC. Several authors showed a direct correlation between MAOA and oxidative stress,[Citation27,Citation28] MAOA is overlooked as a mitochondrial source of ROS.[Citation29] Moreover, inhibition of MAOA (expression or activity) results in the inhibition of pJNK expression [Citation30]; we observed similar results in agreement with these findings. Nevertheless, we did not evaluate the enzyme activities, which would be necessary to generate further conclusions; we observed that the effect of NAC on the evaluated mitochondrial proteins correlated with its overall effect on adipocytes, provoking an increase in CS and FH and a decrease in MAOA.
NAC is currently used pharmacologically as a mucolytic agent in a variety of respiratory illnesses; based on our findings, we suggest that NAC could prevent MAPK phosphorylation. It is unclear to what extent any conclusions from the present in vitro study can be extrapolated to in vivo conditions, but diets that incorporate antioxidants, such as NAC, could potentially have a regulatory effect on adipogenic pathways. Several studies have reported a decrease in GSH levels in obese patients [Citation31–34]; one of them demonstrated an increase of total plasma thiol by 25% in response to treatment with 2 mM NAC administered daily, as well as a decrease in body fat mass after the treatment.[Citation32] Therefore, a translation of the relevant laboratory findings into the clinical setting is needed.
Notes on contributors
Daniela Soto is a student in Biological Science, University of Buenos Aires (2008–present). Current research: Adipocyte differentiation. Scientific articles (last 5 years): 2.
Ms Gómez-Serrano studied Biology at the University of Alcalá, Spain (2006–2011), and received her MsD degree in Molecular Biomedicine from the Autonomous University of Madrid, Spain (2012). In 2012, she moved to Instituto de Investigaciones Biomédicas ‘Alberto Sols’ (IIB) in Madrid, where she started her PhD project in Dr Peral's lab. Her major field of research concerns the application of high-throughput proteomic techniques on the study biology of human adipose tissue in relation to obesity and obesity-related complications. Scientific articles (in the last 5 years): 9.
Azul Victoria Pieralisi is a student in Biological Science, University of Buenos Aires (2011–present). Current research: Antioxidants. Scientific articles (last 5 years): 1.
Juan Carlos Calvo, PhD and full professor of Biological Chemistry, Facultad de Ciencias Exactas y Naturales, University of Buenos Aires. Senior scientist at the Institute of Biology and Experimental Medicine (IBYME), CONICET. Current research: Human reproduction and mammary and prostate cancer.
Belen Peral, PhD and scientific researcher at the Spanish Research Council, Instituto de Investigaciones Biomédicas, Alberto Sols, Madrid. Principal researcher of eight projects. Current research: Obesity. Scientific articles: 52.
Liliana N. Guerra, PhD of Chemical Sciences, University of Buenos Aires. Professor of Pharmacology, University of Lujan. Vice-president of Argentine Cell Bank Association. Laboratory head at Facultad de Ciencias Exactas y Naturales, University of Buenos Aires. Principal researcher of nine projects. Current research: Antioxidants and obesity. Scientific articles and books (last 5 years): 7.
Disclosure statement
No potential conflict of interest was reported by the authors.
ORCiD
María Gomez-Serrano http://orcid.org/0000-0002-9669-091X
Juan C. Calvo http://orcid.org/0000-0001-7632-611X
Additional information
Funding
References
- Gummersbach C, Hemmrich K, Klaus-Dietrich K, Suschek CV, Fehsel K, Pallua N. New aspect of adipogenesis: radicals and oxidative stress. Differentiation. 2009;77:115–120. doi: 10.1016/j.diff.2008.09.009
- Lee H, Jeong Y, Choi H, Ko E, Kim J. Reactive oxygen species facilitates adipocyte differentiation by accelerating mitotic clonal expansion. J Biol Chem. 2009;284:10601–10609. doi: 10.1074/jbc.M808742200
- Calzadilla P, Sapochnik D, Cosentino S, et al. N-acetylcysteine reduces markers of differentiation in 3T3-L1 adipocytes. IJMS. 2011;12:6936–6951. doi: 10.3390/ijms12106936
- Calzadilla P, Gomez-Serrano M, García-Santos E, et al. N-acetylcysteine affects obesity proteins expression in 3T3-L1. Redox Rep. 2013;18:210–218. doi: 10.1179/1351000213Y.0000000066
- Bost F, Aouadi M, Caron L, Binetruy B. The role of MAPKs in adipocyte differentiation and obesity. Biochimie. 2005;87:51–56. doi: 10.1016/j.biochi.2004.10.018
- Prusty D, Park BH, Davis KE, Farmer SR. Activation of MEK/ERK signaling promotes adipogenesis by enhancing peroxisome proliferator-activated receptor gamma (PPARgamma) and C/EBP alpha gene expression during differentiation of 3T3-L1 preadipocytes. J Biol Chem. 2002;277:46226–46232. doi: 10.1074/jbc.M207776200
- Donzelli E, Lucchini C, Ballarini E, et al. ERK1 and ERK 2 are involved in recruitment and maturation of human mesenchymal stem cells induced to adipogenic differentiation. J Mol Cell Biol. 2011;3:123–131. doi: 10.1093/jmcb/mjq050
- Droge W. Free radicals in the physiological control of cell function. Physiol Rev. 2002;82:47–95. doi: 10.1152/physrev.00018.2001
- Cardaci S, Ciriolo MR. TCA cycle defects and cancer: when metabolism tunes redox state. Int J Cell Biol. 2012. doi:10.1155/2012/161837.
- Lindinger PW, Christe M, Eberle AN, et al. Important mitochondrial proteins in human omental adipose tissue show reduced expression in obesity. J Proteomics. 2015;124:79–87. doi: 10.1016/j.jprot.2015.03.037
- Bradford MM. A rapid and sensitive method for the quantitation of microgram quantities of protein utilizing the principle of protein-dye binding. Anal Biochem. 1976;72:248–254. doi: 10.1016/0003-2697(76)90527-3
- Analytical Software. Statistix 8. Tallahassee, FL, USA: McGraw–Hill/Irwin; 2003.
- Yano M, Hoogenradd N, Terada K, Takamori M. Identification and functional analysis of human Tomm22 for protein import into mitocondria. Mol Cell Biol. 2000;20:7205–7213. doi: 10.1128/MCB.20.19.7205-7213.2000
- Bost F, Caron L, Marchetti I, Dani C, Marchand-Brustel Y, Binetry B. Retinoic acid activation of the ERK pathway is required for embryonic stem cell commitment into the adipocytelineage. Biochem J. 2002;361:621–627. doi: 10.1042/bj3610621
- Anjum R, Blenis J. The RSK family of kinases: emerging roles in cellular signaling. Nat Rev Mol Cell. Biol. 2008;9:747–758. doi: 10.1038/nrm2509
- Xu J, Liao K. Protein kinase B/AKT 1 plays a pivotal role in insulin-like growth factor-1 receptor signaling induced 3T3-L1 adipocyte differentiation. J Biol Chem. 2004;279:35914–35922. doi: 10.1074/jbc.M402297200
- Fukuoka H, Iida K, Nishizawa H, et al. IGF-1 stimulates reactive oxygen species (ROS) production and inhibits insulin-dependent glucose uptake via ROS in 3T3-L1 adipocytes. Growth Horm IGF Res. 2010;20:212–219. doi: 10.1016/j.ghir.2010.02.001
- Mc Garry D, Chakravarty P, Wolf CR, Henderson CJ. Altered protein S-glutathionylation identifies a potential mechanism of resistance to acetaminophen-induced hepatotoxicity. J Pharmacol Exp Ther. 2015;355:137–44. doi: 10.1124/jpet.115.227389
- Adler V, Yin Z, Fuchs SY, et al. Regulation of JNK signaling by GSTp. EMBO J. 1999;18:1321–1334. doi: 10.1093/emboj/18.5.1321
- MacDougald OA, Lane MD. Transcriptional regulation of gene expression during adipocyte differentiation. Annu Rev Biochem. 1995;64:345–358. doi: 10.1146/annurev.bi.64.070195.002021
- Tang Q-Q, Otto TC, Lane MD. Mitotic clonal expansion: a synchronous process required for adipogenesis. PNAS. 2003;100:44–49. doi: 10.1073/pnas.0137044100
- Tang Q-Q, Otto TC, Lane MD. CCAT/enhancer-binding protein beta is required for mitotic clonal expansion during adipogenesis. PNAS. 2003;100:850–855. doi: 10.1073/pnas.0337434100
- Zhang Y, Li X, Qian S-W, et al. Transcriptional activation of histone H4 by C/EBPβ during the mitotic clonal expansion of 3T3-L1 adipocyte differentiation. Mol Biol Cell. 2011;22:2165–2174. doi: 10.1091/mbc.E10-11-0912
- Chang YC, Yu YH, Shew JY, et al. Deficiency of NPGPx, an oxidative stress sensor, leads to obesity in mice and human. EMBO Mol Med. 2013;5:1165–1179. doi: 10.1002/emmm.201302679
- Cummins TD, Holden CR, Sansbury BE, et al. Metabolic remodeling of white adipose tissue in obesity. Am J Physiol Endocrinol Metab. 2014;307:262–277. doi: 10.1152/ajpendo.00271.2013
- Ashrafian H, O’Flaherty L, Adam J, et al. Expression profiling in progressive stages of fumarate-hydratase deficiency: the contribution of metabolic changes to tumorigenesis. Cancer Res. 2010;70:9153–9165. doi: 10.1158/0008-5472.CAN-10-1949
- Bianchi P, Kunduzova O, Masini E, et al. Oxidative stress by monoamine oxidase mediates receptor-independent cardiomyocyte apoptosis by serotonin and postischemic myocardial injury. Circulation. 2005;112:3297–3305. doi: 10.1161/CIRCULATIONAHA.104.528133
- Ou XM, Chen K, Shih JC. Monoamine oxidase A and repressor R1 are involved in apoptotic signaling pathway. PNAS. 2006;103:10923–10928. doi: 10.1073/pnas.0601515103
- Alleman RJ, Katunga LA, Nelson MA, Brown DA, Anderson EJ. The Goldilocks Zone from a redox perspective – adaptive vs. deleterious responses to oxidative stress in striated muscle. Front Physiol. 2014;18:358. doi:10.3389/fphys.2014.00358.
- Kunduzova OR, Bianchi P, Pizzinat N, et al. Regulation of JNK/ERK activation, cell apoptosis and tissue regeneration by monoamine oxidases after renal ischemia-reperfusion. FASEB J. 2002;16:1129–1131.
- Pastore A, Piemonte F, Locatelli M. Determination of blood total, reduced, and oxidized glutathione in pediatric subjects. Clin Chem. 2001;47:1467–1469.
- De Tursi Rispoli L, Vazquez Tarragon A, Vazquez Prado A, Saez Tormo G, Ismail A, Gumbau Puchol V. Oxidative stress: a comparative study between normal and morbid obesity group population. Nutr Hosp. 2013;28:671–675.
- Hildebrandt W, Hamann A, Krakowski-Roosen H, et al. Effect of thiol antioxidant on body fat and insulin reactivity. J Mol Med. 2004;82:336–344. doi: 10.1007/s00109-004-0532-5
- Bahmani F, Karamali M, Shareki H, Asemi Z. The effects of folate supplementation on inflammatory factors and biomarkers of oxidative stress in overweight and obese women with polycystic ovary síndrome: a randomized, double blind, placebo controlled clinical trial. Clin Endocrinol. 2014;81:582–587. doi: 10.1111/cen.12451