ABSTRACT
Objective: To examine the effect of galangin on hyperglycemia-mediated oxidative stress in streptozotocin (STZ)-induced diabetic rats.
Methods: Diabetes was induced by intraperitoneal administration of low-dose STZ (40 mg/kg body weight (BW)) into male albino Wistar rats. Galangin (8 mg/kg BW) or glibenclamide (600 µg/kg BW) was given orally, once daily for 45 days to normal and STZ-induced diabetic rats.
Results: Diabetic rats showed significantly increased levels of plasma glucose, thiobarbituric acid reactive substances, lipid hydroperoxides, and conjugated dienes. The levels of insulin and non-enzymatic antioxidants (vitamin C, vitamin E, reduced glutathione) and the activity of enzymatic antioxidants (superoxide dismutase, catalase, glutathione peroxidase, and glutathione-S-transferase (GST)) were decreased significantly in diabetic control rats. These altered plasma glucose, insulin, lipid peroxidation products, enzymatic and non-enzymatic antioxidants ions were reverted to near-normal level after the administration of galangin and glibenclamide.
Conclusion: The present study shows that galangin decreased oxidative stress and increased antioxidant status in diabetic rats, which may be due to its antidiabetic and antioxidant potential.
Introduction
Type 2 diabetes mellitus is the most common metabolic disorder, characterized by hyperglycemia. Diabetes mellitus affects more than 346 million people worldwide and is likely to double by 2030 [Citation1]. Previous study has associated oxidative stress with the development of diabetes mellitus and its complications [Citation2]. Oxidative stress is associated with increased generation of free radicals and decreased antioxidant status. Chronic elevation of plasma glucose is the cause for diabetic complications, such as retinopathy, nephropathy, neuropathy, and cardiovascular damage [Citation3,Citation4]. Decreased antioxidant status and increased free radicals results in tissue damage [Citation5]. Recent studies have shown that the treatment with antioxidants can reduce diabetic complications [Citation6]. Efforts to discover new antioxidants drugs to prevent diabetic complications are going on relentlessly. Flavonoids are a large group of polyphenolic compounds that are found in various plants in appreciable quantities. Several flavonoids have been reported to possess antioxidant, antidiabetic, anti-inflammatory, vasodilatory, and anti-carcinogenic properties [Citation7–9,Citation19].
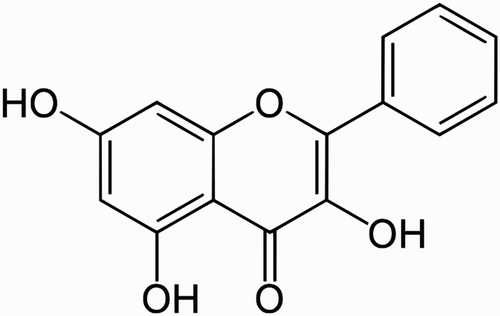
Galangin (3,5,7-trihydroxyflavone; ), a flavonoid dietary ingredient, found in honey and root of Alpinia officinarum Hance has long been used in traditional medicine [Citation10]. Galangin has antioxidant [Citation11], anti-obesity [Citation12], and antiviral [Citation13] properties. Galangin inhibits cell proliferation and induces apoptosis in several human malignancies, such as leukemia [Citation14], breast cancer [Citation15], pancreatic cancer [Citation16], gastric cancer [Citation17], colon cancer [Citation18], and hepatocellular carcinoma [Citation19]. Galangin has also shown anti-inflammatory properties [Citation20]. A previous study has reported that the administration of galangin prevents oxidative damage in fructose-fed rats [Citation11].
Streptozocin (STZ) inhibits insulin secretion and causes a state of insulin-dependent diabetes mellitus [Citation21]. In our study, diabetes was induced by injecting STZ in male albino Wistar rats. Glibenclamide is a commonly used drug in the management of hyperglycemia. It is also used as the standard antidiabetic drug for the STZ-induced diabetic animal model because it stimulates insulin secretion from pancreatic β-cells (insulin secretagogue) without any adverse effect. Therefore, in this study, we have used glibenclamide for the comparison of efficacy of galangin in diabetic rats.
We wanted to investigate the effect of galangin on hyperglycemia-mediated oxidative stress in STZ-induced diabetic rats as this has not yet been studied.
Materials and methods
Experimental animals
Male albino Wistar rats of body weight (BW) between 180 and 200 g were purchased from Central Animal House, King Saud University. The animals were kept in an air-conditioned room at 25 ± 1°C and exposed to a 12-hour light–dark cycle. The animals were fed ad libitum (normal laboratory pellet diet). The procedures of animal care were in accordance with the Research Centre Policy, King Saud University.
Drug and chemicals
Streptozotocin and galangin were purchased from Sigma–Aldrich (St. Louis, MO, U.S.A.). All other chemicals (analytical grade) were purchased from various commercial suppliers.
Experimental induction of diabetes
Animals were fasted overnight and diabetes was induced by an intraperitoneal injection of low-dose STZ (40 mg/kg BW) which was freshly prepared with citrate buffer (0.1 M, pH 4.5). After STZ injection, glucose solution (20%) was given for 24 h to prevent mortality. Blood was collected by retro-orbital puncture and the diabetes was confirmed by measuring the fasting plasma glucose (glucose oxidase method) after 96 h of injecting STZ. Albino rats with plasma glucose level above 220 mg/dl were considered diabetic and only those animals were used in this experiment.
Acute oral toxicity study
Acute oral toxicity study was performed by the guidelines of OECD [Citation22]. Male Wister rats weighing 180–220 g were used in this study and the animals were divided into 5 groups each group containing five animals. After overnight fasting of the animals (provided only water), the different doses of galangin such as 4, 40, 80, 160, and 320 mg/kg were administered orally and the group was observed for any toxic symptoms, behavioral changes, locomotion, convulsions, and mortality for 72 hours. In this study, the galangin had no signs of toxicity even at the highest dose of 320 mg/kg. Therefore, in our study, we have chosen 4, 8, and 16 mg/kg doses of galangin for testing the glucose lowering action, which is relatively safe and can achieve the maximum protective activity in STZ-induced diabetic rats.
Experimental design
Experimental protocol for phase I study
The animals were randomly allocated into seven groups consisting of six animals each. Galangin (4, 8, and 16 mg/kg BW) or glibenclamide (600 µg/kg BW) was dissolved in 5% DMSO and administered by intubation (p.o.) once a day, between 9 a.m. and 10 a.m., for 45 days.
Group I: Normal rats (5% DMSO alone)
Group II: Normal + galangin (16 mg/kg BW)
Group III: Diabetic control
Group IV: Diabetic + galangin (4 mg/kg BW)
Group V: Diabetic + galangin (8 mg/kg BW)
Group VI: Diabetic + galangin (16 mg/kg BW)
Group VII: Diabetic + glibenclamide (600 µg/kg BW)
At the end of the treatment period, the animals were fasted for 12 hours, anesthetized between 8:00 am and 9:00 am using ketamine (24 mg/kg BW, intramuscular injection), and sacrificed by cervical dislocation. The blood was collected in tube with ethylene diamine tetra acetic acid (EDTA) for the separation of plasma and the glucose and insulin evaluations were carried out.
The dose of 8 mg/kg BW showed maximum improvement of glucose compared to other two doses. Hence, the dose of 8 mg/kg BW was fixed as an active dose and used for further experiment throughout the study.
Experimental protocol for phase II study
The animals were randomly allocated into five groups consisting of six animals each. Galangin (8 mg/kg BW) or glibenclamide (600 µg/kg BW) was dissolved in 5% DMSO and administered by intubation (p.o.) once a day, between 9 a.m. and 10 a.m., for 45 days.
Group I: Normal rats (5% DMSO alone)
Group II: Normal rats + galangin (8 mg/kg BW)
Group III: Diabetic control
Group IV: Diabetic rats + galangin (8 mg/kg BW)
Group V: Diabetic rats + glibenclamide (600 µg/kg BW)
At the end of the treatment period, the animals were fasted for 12 hours, anesthetized between 8:00 am and 9:00 am using ketamine (24 mg/kg BW, intramuscular injection), and sacrificed by cervical dislocation. Blood sample was collected in tubes containing a mixture of EDTA for the estimation of plasma lipid peroxidation and antioxidants. Tissue was sliced into pieces and homogenized in appropriate buffer in cold condition (pH 7.0) to give 20% homogenate. The homogenate was centrifuged at 145 × g for 10 minutes at 0°C in cold centrifuge. The supernatant was separated and used for various biochemical estimations.
Biochemical assays
Plasma glucose estimation
Plasma glucose was measured by the Trinder reagent Kit method [Citation23]. To 0.01 ml of plasma, standard and distilled water (blank) taken in separate tubes, 1.0 ml of the enzyme reagent was added. The tubes were mixed well and kept at room temperature. After 15 minutes, the color developed was read at 510 nm against reagent blank. The values were expressed as mg/dl of plasma glucose.
Plasma insulin estimation
The insulin level in plasma was estimated by the method described by Bürgi et al. [Citation24]. Estimated samples and standards containing insulin react with antibodies coated on a microplate and with monoclonal antibodies labeled with horseradish peroxidase (HRP). Standard, control, and sample (50 µl) was added into the appropriate microplate wells. Antiserum HRP conjugate (50 µl) was added into all the wells and incubated at room temperature for 2 hours. The contents were aspirated from each well and then 0.4 ml of washing solution was added into each well. The washing solution was also aspirated. This process was done three times for complete washing. After washing, 200 µl of the freshly prepared revelation solution was added into each well and the plates were incubated for 15 minutes at room temperature. Finally, 50 μl of arresting reagent was added into each well. The absorbance was read at 450 nm. Insulin concentration was expressed as U/ml of plasma.
Assay of thiobarbituric acid reactive substances
The thiobarbituric acid reactive substances concentration (TBARS) in the plasma and tissues was assayed by the method given by Niehaus and Samuelsson [Citation25]. An estimated sample (0.5 ml) was diluted with 0.5 ml of double distilled water and mixed well. TBA-tricarboxylic acid (TCA)-HCl reagent (2 ml of (1:1:1 ratio)) (0.37% thiobarbituric acid, 0.25 N HCl, and 15% TCA) was added and placed in water bath for 15 minutes, cooled, and centrifuged at 1000 g for 10 minutes. The absorbance of clear supernatant was measured against reference blank at 535 nM. The values were expressed as mmol/dl of plasma or mmol/100 g of tissues.
Assay of lipid hydroperoxides
The plasma and tissue concentration of lipid hydroperoxides (LOOH) was assayed by the method described by Jiang et al. [Citation26]. An estimated sample (0.1 ml) was treated with 0.9 ml of Fox reagent (88 mg of butylated hydroxytoluene, 7.6 mg of xylenol orange, and 9.8 mg of ammonium iron sulfate added to 90 ml of methanol and 10 ml of 250 mM sulfuric acid) and incubated at 37°C for 30 minutes. The color developed was read at 560 nm. LOOH were expressed as mmol/dl of plasma or mmol/100 g of tissues.
Assay of conjugated dienes
The plasma and tissue concentration of conjugated dienes (CD) was estimated by the method described by Rao and Recknagel [Citation27]. An estimated sample (1.0 ml) was taken into tubes and mixed well with 5.0 ml of chloroform–methanol reagent (2:1 v/v) and centrifuged for 5 minutes. To this, 1.5 ml of cyclohexane was added and the absorbance was read at 233 nm against blank. The concentration of CD was expressed as mmol/dl plasma or mmol/100 mg tissue.
Assay of superoxide dismutase activity
The tissue activity of superoxide dismutase (SOD) was estimated by the method described by Kakkar et al. [Citation28] and 0.5 ml of estimated sample was diluted with 1 ml of distilled water. Following that, 2.5 ml of ethanol and 1.5 ml of chloroform (all reagents chilled) were added into the sample and mixed well and then centrifuged. The enzyme activity in the supernatant was determined. The assay mixture contained 1.2 ml of sodium pyrophosphate buffer (0.025 M, pH 8.3), 0.1 ml of 186 μM N-methyl dibenzopyrazine methyl sulfate, 0.3 ml of 30 μM nitro blue tetrazolium (NBT), and 0.2 ml of 780 μM NADH, appropriately diluted enzyme preparation and water in a total volume of 3 ml. Reaction was started by the addition of NADH. After incubation at 30°C for 90 seconds, the reaction was stopped by the addition of 1 ml glacial acetic acid. The reaction mixture was stirred vigorously and shaken with 4 ml of n-butanol. The intensity of the chromogen in the butanol layer was measured at 560 nm against butanol blank. One unit of the enzyme activity is defined as the enzyme reaction, which gave 50% inhibition of NBT reduction in 1 minute under the assay conditions. The specific activity of the enzyme was expressed as Unit/min/mg of protein for tissues.
Assay of catalase activity
The catalase activity (CAT) was estimated by the method described by Sinha [Citation29]. The estimated sample (0.1 ml) was taken into tube and the reaction mixture (1.5 ml, vol) containing 1.0 ml of 0.01 M phosphate buffer (pH 7.0) and 0.4 ml of 2 M H2O2 was added. Dichromate–acetic acid reagent (2.0 ml) (5% potassium dichromate and glacial acetic acid were mixed in 1:3 ratio) was added to stop the reaction. Then the absorbance was read at 620 nm; CAT activity was expressed as μmol of H2O2 consumed/min/mg of protein for tissues.
Assay of glutathione peroxides activity
The glutathione peroxides activity (GPx) was measured in the tissues by the method described by Rotruck et al. [Citation30] 0.5 ml of estimated sample was taken into the tube and 0.2 ml of Tris buffer, 0.2 ml of EDTA, and 0.1 ml of sodium azide were added. 0.2 ml of GSH and 0.1 ml of H2O2 were then added to the mixture. The contents were mixed well and incubated at 37°C for 10 minutes. After 10 minutes, 0.5 ml of 10% TCA was added to arrest the reaction. The tubes were centrifuged and the supernatant was assayed for GSH by the method of Ellman [Citation25]. The activity was expressed as μmol of GSH consumed/min/mg of protein for tissues.
Assay of glutathione-S-transferase activity
Glutathione-S-transferase (GST) activity was estimated by the method described by Habig et al. [Citation31]. To 0.1 ml of the estimated sample, 1 ml of phosphate buffer, 0.1 ml of CDNB, and 0.7 ml of distilled water were added. The mixture was incubated at 37°C for 5 minutes and then the reaction was started by adding 0.1 ml of 30 mM GSH. The change in absorbance was read at 340 nm. Reaction mixture without the enzyme was used as the blank. The activity of GST was expressed as μg of CDNB conjugate formed/min/mg protein.
Assay of reduced glutathione
The plasma and tissue level of GSH were assayed by the method described by Ellman [Citation32]. To 0.5 ml of estimated sample, 2.0 ml of 5% TCA was added and then centrifuged at 1000 g for 10 minutes. To 2.0 ml of supernatant, 1.0 ml of Ellman’s reagent and 4.0 ml of 0.3 M disodium hydrogen phosphate were added. The color developed was read at 412 nm. The amount of glutathione (GSH) was expressed as mg/dl of plasma or μg/mg of protein for tissues.
Assay of ascorbic acid (vitamin C)
The plasma and tissue vitamin C level was assayed by the method described by Roe and Kuether [Citation33]. To 0.5 ml of estimated sample, 1.5 ml of 6% TCA was added and allowed to stand for 5 minutes and centrifuged. Acid washed activated charcoal (Norit) (0.3 g) was added into the supernatant, mixed well and filtered. This converts ascorbic acid to dehydroascorbic acid. 0.5 ml was taken from the filtrate and 0.5 ml of DNPH was added and this was kept in a water bath at 37°C for 3 hours. To this, 2.5 ml of 85% sulfuric acid was added drop by drop placed in ice–cold water. The contents of the tubes were mixed well and allowed to stand at room temperature for 30 minutes. After 30 minutes, the color developed was read at 540 nm. The values were expressed as mg/dl of plasma or μg/mg of protein for tissue.
Assay of α-tocopherol (vitamin E)
The level of Vitamin E in plasma and tissues were assayed by the method described by Baker et al. [Citation34]. To 0.5 ml of estimated sample, 1.5 ml of ethanol was added, mixed, and centrifuged. The supernatant was evaporated and allowed to precipitate, 3.0 ml of petroleum ether, 0.2 ml of 2, 2 dipyridyl solution, and 0.2 ml of ferric chloride solution were added, mixed well, and kept at room temperature for 5 minutes. 4.0 ml of n-butanol was added to all the tubes and mixed well. The color in the n-butanol layer was read at 520 nm. The values were expressed as mg/dl for plasma or μg/mg protein for tissue.
Statistical analysis
The values were analyzed statistically (SPSS software package 9.05) using one-way analysis of variance (ANOVA) and Duncan's multiple range test (DMRT). All the experimental results were expressed as mean ± S.D. from six rats in each group. P values <0.05 were considered as significant.
Results
Effects of galangin on plasma glucose and insulin
depicts the effect of galangin (4, 8, 16 mg/kg BW) on plasma levels of glucose and insulin in normal and diabetic rats. Diabetic rats showed significantly increased level of plasma glucose and decreased level of insulin as compared to control rats. After 45 days of oral administration of galangin or glibenclamide to experimental group of rats, plasma glucose and insulin levels were similar to control rats. 8 mg/kg BW dose showed maximum improvement on glucose levels than the other two (4 and 16 mg/kg BW) doses. So 8 mg/kg BW dose was fixed as an optimum dose and was used for further study.
Table 1. Effect of galangin on plasma glucose and insulin in STZ-diabetic rats.
Effects of galangin on TBARS, LOOH, and CD
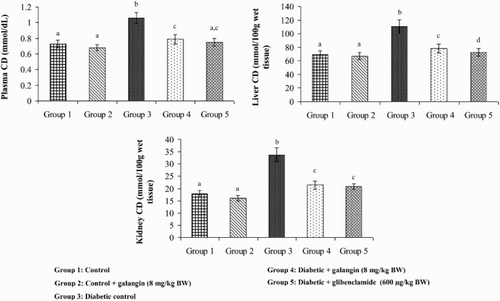
show that the levels of TBARS, LOOH, and CD in plasma and tissues were significantly higher in diabetic rats as compared to that in normal rats. After 45 days of treatment with galangin or glibenclamide, their levels were similar to that of normal control rats.
Figure 2. Effect of galangin on TBARS in the plasma and tissues of normal and STZ-induced diabetic rats. Values are given as means ± SD from six rats in each group. Group 1 is significantly not different from group 2 (a, a) (P < 0.05). Group 4 and 5 are significantly different from group 3 (b vs. c, a, d) (P < 0.05).
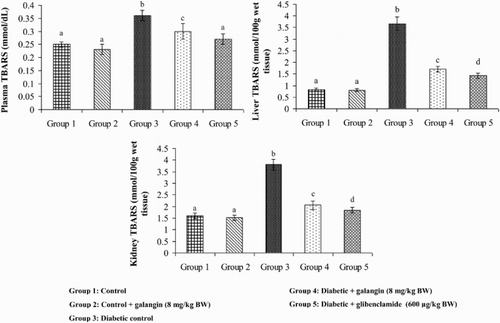
Figure 3. Effect of galangin on LOOH (LOOH) in the plasma and tissues of normal and STZ-induced diabetic rats. Values are given as means ± SD from six rats in each group. Group 1 is significantly not different from group 2 (a, a) (P < 0.05). Group 4 and 5 are significantly different from group 3 (b vs. c, ac, d) (P < 0.05).
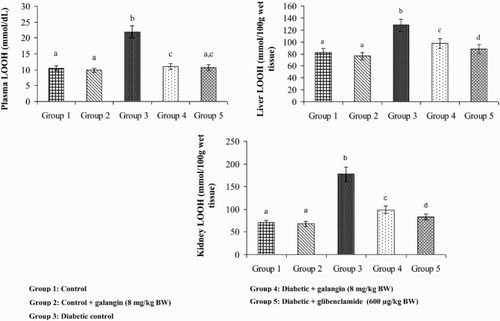
Figure 4. Effect of galangin on CD in the plasma and tissues of normal and STZ-induced diabetic rats. Values are given as means ± SD from six rats in each group. Group 1 is significantly not different from group 2 (a, a) (P < 0.05). Group 4 and 5 significantly are different from group 3 (b vs. c, ac, d) (P < 0.05).
Effects of galangin on SOD, CAT, GPx, and GST
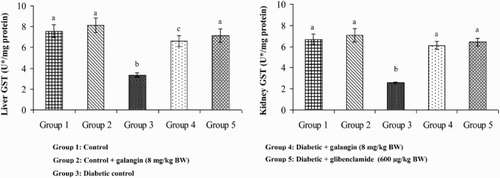
show that in diabetic rats, the action of SOD, CAT, GPx, and GST was significantly decreased as compared to that of normal control rats. After 45 days of oral administration of galangin or glibenclamide, enzymatic antioxidants status significantly improved toward normal control rats.
Figure 5. Effect of galangin on the activity of SOD in the liver and kidney of normal and STZ-induced diabetic rats. Values are given as means ± SD from six rats in each group. Group 1 is significantly not different from group 2 (a, a) (P < 0.05). Group 4 and 5 are significantly different from group 3 (b vs. c, ac) (P < 0.05). U* = Enzyme concentration required for 50% inhibition of NBT reduction/minute.
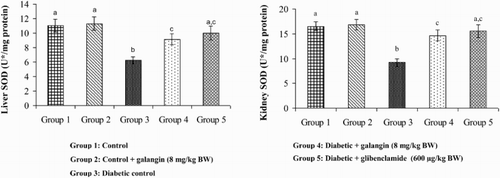
Figure 6. Effect of galangin on the activity of catalase (CAT) in the liver and kidney of normal and STZ-induced diabetic rats. Values are given as means ± SD from six rats in each group. Group 1 is significantly not different from group 2 (a, a) (P < 0.05). Group 4 and 5 are significantly different from group 3 (b vs. d, e, c) (P < 0.05). U* = µmol of hydrogen peroxide consumed/minute.
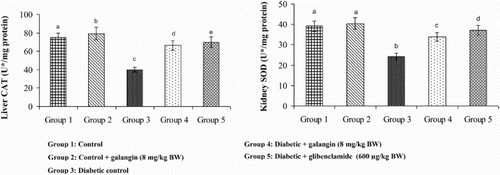
Figure 7. Effect of galangin on the activity of GPx in the liver and kidney of normal and STZ-induced diabetic rats. Values are given as means ± SD from six rats in each group. Group 1 is significantly not different from group 2 (a, a) (P < 0.05). Group 4 and 5 are significantly different from group 3 (b vs. c, a, c) (P < 0.05). U* = µmol of GSH utilized/minute.

Figure 8. Effect of galangin on the activity of GST in the liver and kidney of normal and STZ-induced diabetic rats. Values are given as means ± SD from six rats in each group. Group 1 is significantly not different from group 2 (a, a) (P < 0.05). Group 4 and 5 are significantly different from group 3 (b vs. c, a) (P < 0.05). U* = µg of CDNB conjugate formed/minute.
Effects of galangin on GSH, vitamin C, and vitamin E
show the levels of GSH, vitamin C, and vitamin E (non-enzymatic antioxidants) in the plasma and tissues of normal and diabetic rats. The levels of GSH, vitamin C, and vitamin E were significantly less in diabetic rats as compared to those of normal control rats. After 45 days of treatment with galangin or glibenclamide, the levels of GSH, vitamin C, and vitamin E were similar to that of normal rats.
Table 2. Effect of galangin on vitamin C in the plasma and tissues of normal and STZ-induced diabetic rats.
Table 3. Effect of galangin on vitamin E in the plasma and tissues of normal and STZ-induced diabetic rats.
Table 4. Effect of galangin on reduced glutathione in the plasma and tissues of normal and STZ-induced diabetic rats.
Discussion
Streptozotocin produces permanent diabetes in many animal species that resembles human diabetes pathophysiologically [Citation21]. Hence, STZ-induced diabetes rat is considered to be an animal model for developing new drugs for human diabetes. Currently available oral antidiabetic drugs have certain drawbacks and therefore there is a need to find safer and more effective drugs. Accordingly, the current study was designed to investigate the ameliorative effect of galangin on sustained hyperglycemia-mediated oxidative damage in STZ-induced diabetic rats. As expected, STZ-induced diabetic rats showed a significant increase in plasma glucose and decrease in insulin levels when compared to normal rats, which were brought back to near-normal levels by the administration of galangin or glibenclamide. The 4 mg/kg BW of galangin was not effective, because its concentration was not enough to counteract the antihyperglycemic activity on STZ-induced diabetic rats. The 16 mg/kg BW (higher concentration) of galangin might have resulted in the production of by-products that could interfere with its antihyperglycemic activity. Hence, the middle dose of galangin (8 mg/kg BW) is optimum for antihyperglycemic activity. Studies have shown that flavonoids improve glucose tolerance by stimulating insulin secretion and increasing insulin sensitivity [Citation35,Citation36]. Galangin, a flavonoid, may have insulin-like effect on peripheral tissues, by promoting glucose uptake in muscles and adipose tissue or by inhibiting hepatic gluconeogenesis. In addition, galangin potentiates insulin sensitivity [Citation37]. Previous study has reported that flavonoid induces insulin secretion by the direct activation of L-type calcium channels in pancreatic beta cells [Citation38]. The exocytosis of insulin is a calcium-dependent process, and an increase in intracellular calcium concentrations ([Ca2+]i) in pancreatic beta cells could increase insulin secretion. We hypothesize that galangin, a flavonoid, might have increased insulin secretion by increasing intracelluar calcium by direct activation of L-type calcium channels in pancreatic beta cells. The molecular mechanism of galangin in increasing the insulin level in STZ-induced diabetic rats should be studied in future.
Oxidative stress is the result of free radical production in excess that overwhelms the antioxidant defenses in the body leading to cell damage. Chronic hyperglycemia associated with diabetes enhances free radical production and decreases endogenous antioxidant defense, leading to tissue necrosis, inflammation, fibrosis, and organ damage [Citation39–41]. In our study, we observed significantly increased levels of lipid peroxidation markers, such as TBARS, LOOH, and CD in STZ-induced diabetic rats, which is an indirect evidence of increased free radical production [Citation42]. Free radicals damage cell membranes through peroxidation of unsaturated fatty acids. Thus, observed results of lipid peroxidation evidence parameters might be a reflection of increased generation of free radicals in uncontrolled glycemic stage [Citation40]. Oral administration of galangin and glibenclamide to diabetic rats has reduced the levels of lipid peroxidation markers to near normal. This denotes the antioxidant property of galangin. Sivakumar and Anuradha [Citation11] reported that galangin protects cellular antioxidants in fructose-fed rats. Thus, the antioxidant property of galangin in STZ-induced diabetic rats might be due to its direct protective action on cellular antioxidants. Glibenclamides do not have direct antioxidant action and its antioxidant property might be due to improved glycemic control by increasing insulin levels.
Antioxidants play an important role in protecting cells from the free radical damage. SOD, CAT, GPx, and GST are the enzymes involved in antioxidant defense mechanism. SOD protects the tissues against oxygen free radicals by scavenging superoxide radical (). Catalase reduces H2O2, thereby protecting the cells from highly reactive OH radicals. Reduced glutathione helps in decomposing glutathione peroxidase (GPx) and GST to H2O molecule and other organic hydroperoxides to non-toxic products. Similar results (decreased activity of SOD, CAT, GPx, and GST) were observed by Omotayo et al. [Citation43]. Decreased activity of enzymatic antioxidants might be due to its inactivation by free radicals or by enzymatic glycation [Citation44–46]. Flavonoids contribute to the partial or total alleviation of oxidative damage against diseases by scavenging free radicals [Citation47]. Our study shows that 45 days of treatment with galangin or glibenclamide significantly increased the activity of all the antioxidant enzymes (SOD, CAT, GPx, and GST) in diabetic rats. Galangin, a dietary flavonoid, may protect the cells from oxidative damage by decreasing the free radical production and enhancing the antioxidant status.
Apart from the enzymatic antioxidants, non-enzymatic antioxidants also play a role in scavenging oxygen free radicals, thereby preserving the cell function. Vitamins C and E are the antioxidants derived from diet. Vitamin C is a hydrophilic molecule that can sequester the singlet oxygen radical, alleviate the hydroxyl radical, and regenerate active Vitamin E from reduced vitamin E [Citation48]. Vitamin E, a lipophilic antioxidant, transfers its phenolic hydrogen to a peroxyl free radical of peroxidized poly-unsaturated fatty acid. This action breaks the radical chain reaction, thereby preventing the peroxidation of membrane lipids [Citation49]. In the present study, levels of vitamin C and vitamin E were decreased significantly in STZ-induced diabetic rats as documented earlier [Citation43]. The decreased vitamin C and E levels in diabetic rats might be due to increased utilization by reactive oxygen species. Oral administration of galangin and glibenclamide significantly improved the vitamin C and E levels, which could be due to decreased utilization, improved glycemic control, and decreased membrane damage as evidenced by decreased lipid peroxidation, and enhanced antioxidant status.
Reduced glutathione protects cells from reactive oxygen species by effectively scavenging free radicals directly and indirectly through enzymatic reactions. Reduced glutathione acts as a substrate for GPx and GST and it is required for the recycling of vitamin C [Citation46]. In our study, the level of GSH was decreased significantly in STZ-induced diabetic rats as reported earlier [Citation43]. Decreased level of reduced glutathione in diabetic rats might be due to the increased utilization for scavenging free radicals, and increased consumption by GPx and GST. Oral administration of galangin and glibenclamide to diabetic rats significantly improved reduced glutathione level, which could be due to the decreased utilization for free radical scavenging, and improved glycemic control.
Flavonoids possess various beneficial biological effects that include antioxidant activity [Citation47]. The dietary flavonoids scavenge free radicals by donating a hydrogen atom from their hydroxyl group [Citation50]. Previous studies have also reported that hydroxyl groups play a vital role in antiradical activity [Citation50,Citation51]. Galangin (3,5,7-trihydroxyflavone) can easily donate 3-hydroxyl hydrogen and form 3-flavonoid phenoxyl radical [Citation50]. The present study reveals that galangin enhances the antioxidant status in STZ-induced diabetic rats. This might be due to the free radical scavenging activity of their hydroxyl groups and improved glycemic control.
In conclusion, galangin significantly improves the glycemic control and antioxidant status in STZ-induced diabetic rats. Thus, we suggest that galangin can be given as an adjunct therapy to control hyperglycemia-associated oxidative stress in diabetes. However, the exact molecular mechanism of action of galangin to prevent hyperglycemia-associated oxidative stress in diabetes has to be studied in detail.
Disclosure statement
No potential conflict of interest was reported by the authors.
Notes on contributors
Amal A. Aloud is working as an Assistant Professor at Department of Food Sciences and Nutrition, College of Food and Agriculture Sciences, King Saud University, Riyadh, Saudi Arabia. Her current research focuses on Nutrition, Health, and Diseases.
Chinnadurai Veeramani is working as a postdoctoral researcher at Department of Community Health Sciences, College of Applied Medical Sciences, King Saud University, Riyadh, Saudi Arabia. His current research focuses on Natural Products and Cardiovascular Diseases.
Chandramohan Govindasamy is working as an Assistant Professor at Department of Community Health Sciences, College of Applied Medical Sciences, King Saud University, Riyadh, Saudi Arabia. His current research focuses on Natural Products and Cardiovascular Diseases.
Mohammed A. Alsaif is working as a Professor at Department of Community Health Sciences, College of Applied Medical Sciences, King Saud University, Riyadh, Saudi Arabia. His current research focuses on Nutrition, Health, and Diseases.
Ahmed S. El Newehy is working as a researcher at Department of Community Health Sciences, College of Applied Medical Sciences, King Saud University, Riyadh, Saudi Arabia. His current research focuses on Natural Products and Diabetes Mellitus.
Khalid S. Al-Numair is working as a Professor at Department of Community Health Sciences, College of Applied Medical Sciences, King Saud University, Riyadh, Saudi Arabia. His current research focuses on Nutrition, Health, and Diseases.
Additional information
Funding
References
- Wild S, Roglic G, Green A, et al. Global prevalence of diabetes: estimates for the year 2000 and projections for 2030. Diabetes Care. 2004;27:1047–1053. doi: 10.2337/diacare.27.5.1047
- Giacco F, Brownlee M. Oxidative stress and diabetic complications. Circ Res. 2010;107(9):1058–1070. doi: 10.1161/CIRCRESAHA.110.223545
- Gong CY, Lu B, Hu QW, et al. Streptozotocin induced diabetic retinopathy in rat and the expression of vascular endothelial growth factor and its receptor. Int J Ophthalmol. 2013;6(5):573–577.
- Deshpande AD, Harris-Hayes M, Schootman M. Epidemiology of diabetes and diabetes-related complications. Phys Ther. 2008;88(11):1254–1264. doi: 10.2522/ptj.20080020
- McCord JM. The evolution of free radicals and oxidative stress. Am J Med. 2000;108:652–659. doi: 10.1016/S0002-9343(00)00412-5
- Kaul N, Siveski-Iliskovic N, Hill M, et al. Probucol treatment reverses antioxidant and functional deficit in diabetic cardiomyopathy. Mol Cell Biochem. 1996;160-161:283–288. doi: 10.1007/BF00240060
- Abdelmoaty MA, Ibrahim MA, Ahmed NS, et al. Confirmatory studies on the antioxidant and antidiabetic effect of quercetin in rats. Indian J Clin Biochem. 2010;25(2):188–192. doi: 10.1007/s12291-010-0034-x
- Kim HP, Son KH, Chang HW, et al. Anti-inflammatory plant flavonoids and cellular action mechanisms. J Pharmacol Sci. 2004;96:229–245. doi: 10.1254/jphs.CRJ04003X
- Fisher NDL, Hughes M, Gerhard-Herman M, et al. Flavanol-rich cocoa induces nitric-oxide-dependent vasodilation in healthy humans. J Hypertens. 2003;21(12):2281–2286. doi: 10.1097/00004872-200312000-00016
- Heo MY, Sohn SJ, Au WW. Anti-genotoxicity of galangin as a cancer chemopreventive agent candidate. Mutat Res. 2001;488:135–150. doi: 10.1016/S1383-5742(01)00054-0
- Sivakumar AS, Anuradha CV. Effect of galangin supplementation on oxidative damage and inflammatory changes in fructose-fed rat liver. Chemico-Biolog Interact. 2011;193:141–148. doi: 10.1016/j.cbi.2011.06.003
- Kumar S, Alagawadi KR. Anti-obesity effects of galangin, a pancreatic lipase inhibitor in cafeteria diet fed female rats. Pharm Biol. 2013;51(5):607–613. doi: 10.3109/13880209.2012.757327
- Meyer JJM, Afolayan AJ, Taylor MB, et al. Antiviral activity of galangin isolated from the aerial parts of Helichrysum aureonitens. J Ethnopharmacol. 1997;56(2):165–169. doi: 10.1016/S0378-8741(97)01514-6
- Bestwick CS, Milne L. Influence of galangin on HL-60 cell proliferation and survival. Cancer Lett. 2006;243:80–89. doi: 10.1016/j.canlet.2005.11.025
- Murray TJ, Yang X, Sherr DH. Growth of a human mammary tumor cell line is blocked by galangin, a naturally occurring bioflavonoid, and is accompanied by down-regulation of cyclins D3, E, and A. Breast Cancer Res. 2006;8:R17. doi: 10.1186/bcr1391
- Li F, Awale S, Tezuka Y, et al. Study on the constituents of Mexican propolis and their cytotoxic activity against PANC-1 human pancreatic cancer cells. J Nat Prod. 2010;73:623–627. doi: 10.1021/np900772m
- Kim DA, Jeon YK, Nam MJ. Galangin induces apoptosis in gastric cancer cells via regulation of ubiquitin carboxy-terminal hydrolase isozyme L1 and glutathione S-transferase P. Food Chem Toxicol. 2012;50:684–688. doi: 10.1016/j.fct.2011.11.039
- Ha TK, Kim ME, Yoon JH, et al. Galangin induces human colon cancer cell death via the mitochondrial dysfunction and caspase-dependent pathway. Exp Biol Med. 2013;238:1047–1054. doi: 10.1177/1535370213497882
- Su L, Chen X, Wu J, et al. Galangin inhibits proliferation of hepatocellular carcinoma cells by inducing endoplasmic reticulum stress. Food Chem Toxicol. 2013;62:810–816. doi: 10.1016/j.fct.2013.10.019
- Jung YC, Kim ME, Yoon JH, et al. Anti-inflammatory effects of galangin on lipopolysaccharide-activated macrophages via ERK and NF-κB pathway regulation. Immunopharmacol Immunotoxicol. 2014;36(6):426–432. doi: 10.3109/08923973.2014.968257
- Szkudelski T. The mechanism of alloxan and streptozotocin action in B cells of the rat pancreas. Physiol Res. 2001;50(6):537–546.
- OECD 423. Adopted by the council on 17 December 2001. Organization for economic co-operation and development (OECD) guideline for the testing of chemicals, acute oral toxicity-acute toxic class method. [Internet]. Author’s manuscript available at http:/iccvam.niehs.nih.gov/SuppDocs/FedDocs/OECD/OECD_GL423.pdf.
- Trinder P. Determination of glucose in blood using glucose oxidase with an alternative oxygen acceptor. Ann Clin Biochem. 1969;6:24–27. doi: 10.1177/000456326900600108
- Bürgi W, Briner M, Franken N, et al. One step sandwich enzyme immunoassay for insulin using monoclonal antibodies. Clin Biochem. 1988;21:311–314. doi: 10.1016/S0009-9120(88)80087-0
- Niehaus WG, Samuelsson B. Formation of malonaldehyde from phospholipid arachidonate during microsomal lipid peroxidation. Eur J Biochem. 1968;6:126–130. doi: 10.1111/j.1432-1033.1968.tb00428.x
- Jiang ZY, Hunt JV, Wolff SP. Ferrous ion oxidation in the presence of xylenol orange for detection of lipid hydroperoxide in low density lipoprotein. Anal Biochem. 1992;202:384–389. doi: 10.1016/0003-2697(92)90122-N
- Suryanarayana Rao K, Recknagel RO. Early onset of lipoperoxidation in rat liver after carbon tetrachloride administration. Exp Mol Pathol. 1968;9:271–278. doi: 10.1016/0014-4800(68)90041-5
- Kakkar P, Das B, Viswanathan PN. A modified spectrophotometric assay of superoxide dismutase. Indian J Biochem Biophy. 1978;21:130–132.
- Sinha AK. Colorimetric assay of catalase. Anal Biochem. 1972;47:389–394. doi: 10.1016/0003-2697(72)90132-7
- Rotruck JT, Pope AL, Ganther HE, et al. Selenium: biochemical role as a component of glutathione peroxidase. Science. 1973;179:588–590. doi: 10.1126/science.179.4073.588
- Habig WH, Pabst MJ, Jakoby WBC. Glutathione-S-transferases: the first enzymatic step in mercapturic acid formation. J Biol Chem. 1974;249:7130–7139.
- Ellman GL. Tissue sulfhydryl groups. Arch Biochem Biophys. 1959;82:70–77. doi: 10.1016/0003-9861(59)90090-6
- Roe JH, Kuether CA. Detection of ascorbic acid in whole blood and urine through 2, 4-DNPH derivative of dehydroascorbic acid. J Biol Chem. 1943;147:399–407.
- Baker H, Frank O, DeAngelis B, et al. Plasma tocopherol in man at various times after ingesting free or acetylated tocopherol. Nutr Res. 1980;21:531–536.
- Ohno M, Shibata C, Kishikawa T, et al. The flavonoid apigenin improves glucose tolerance through inhibition of microRNA maturation in miRNA103 transgenic mice. Sci Rep. 2013;3:25–53. doi: 10.1038/srep02553
- Cordero-Herrera I, Martín MA, Bravo L, et al. Cocoa flavonoids improve insulin signalling and modulate glucose production via AKT and AMPK in HepG2 cells. Mol Nutr Food Res. 2013;57(6):974–985. doi: 10.1002/mnfr.201200500
- Sivakumar AS, Viswanathan P, Anuradha CV. Dose-dependent effect of galangin on fructose-mediated insulin resistance and oxidative events in rat kidney. Redox Rep. 2010;15(5):224–232. doi: 10.1179/135100010X12826446921545
- Mears D. Regulation of insulin secretion in islets of Langerhans by Ca(2+)channels. J Membr Biol. 2004;200:57–66. doi: 10.1007/s00232-004-0692-9
- Baynes JW, Thorpe SR. Role of oxidative stress in diabetic complications: A new perspective on an old paradigm. Diabetes. 1999;48:1–9. doi: 10.2337/diabetes.48.1.1
- Feillet-Coudray C, Rock E, Coudray C, et al. Lipid peroxidation and antioxidant status in experimental diabetes. Clin Chim Acta. 1999;284(1):31–43. doi: 10.1016/S0009-8981(99)00046-7
- Giugliano D, Ceriello A, Paolisso G. Diabetes mellitus, hypertension and cardiovascular diseases: which role for oxidative stress? Metabolism. 1995;44:363–368. doi: 10.1016/0026-0495(95)90167-1
- Kakkar R, Kalra J, Mantha SV, et al. Lipid peroxidation and activity of antioxidant enzymes in diabetic rats. Mol Cell Biochem. 1995;151:113–119. doi: 10.1007/BF01322333
- Omotayo EO, Gurtu S, Sulaiman SA, et al. Hypoglycemic and antioxidant effects of honey supplementation in streptozotocin-induced diabetic rats. Int J Vitam Nutr Res. 2010;80(1):74–82. doi: 10.1024/0300-9831/a000008
- Sözmen EY, Sözmen B, Delen Y, et al. Catalase/superoxide dismutase (SOD) and catalase/paraoxonase (PON) ratios may implicate poor glycemic control. Arch Med Res. 2001;32:283–287. doi: 10.1016/S0188-4409(01)00285-5
- Yan H, Harding JJ. Glycation-induced inactivation and loss of antigenicity of catalase and superoxide dismutase. Biochem J. 1997;328:599–605. doi: 10.1042/bj3280599
- Winterbourn CC. Concerted antioxidant activity of glutathione and superoxide dismutase. In: L Packer, J Fuchs, editor. Biothiols in health and disease. New York (NY): Marcel Dekker Inc; 1995. p. 117–134.
- Horvathova K, Novotny L, Vachalkova A. The free radical scavenging activity of four flavonoids determined by the comet assay. Neoplasma. 2003;50(4):291–295.
- Sadi G, Yılmaz Ö, Güray T. Effect of vitamin C and lipoic acid on streptozotocin-induced diabetes gene expression: mRNA and protein expressions of Cu-Zn SOD and catalase. Mol Cell Biochem. 2008;309:109–116. doi: 10.1007/s11010-007-9648-6
- Ingold KU, Webb AC, Witter D, et al. Vitamin E remains the major lipid-soluble, chain-breaking antioxidant in human plasma even in individuals suffering severe vitamin E deficiency. Arc Biochem Biophys. 1987;259:224–225. doi: 10.1016/0003-9861(87)90489-9
- Seyoum A, Asres K, El-Fiky FK. Structure-radical scavenging activity relationships of flavonoids. Phytochemistry. 2006;67(18):2058–2070. doi: 10.1016/j.phytochem.2006.07.002
- Machlin LJ, Bendich A. Free radical tissue damage: protective role of antioxidant nutrients. FASEB J. 1987;1(6):441–445.

