ABSTRACT
Objectives: This study was conducted to assess the markers of oxidative stress, myeloperoxidase (MPO), acetylcholinesterase (AChE) and xanthine oxidase (XO) activities as well as the levels of nucleotide metabolites in sickle cell anemia (SCA) patients.
Methods: Fifteen SCA treated patients and 30 health subjects (control group) were selected. The markers of oxidative stress (levels of reactive oxygen species (ROS), plasma proteins, carbonyl content, lipid peroxidation (TBARS), total thiols (T-SH), glutathione and catalase activity), MPO, AChE and XO activities as well as the levels of nucleotide metabolites were measured in SCA patients.
Results: ROS, thiobarbituric acid-reactive substances (TBARS) and T-SH levels as well as the activities of catalase and MPO were significantly increased while glutathione level was reduced in SCA patients. Furthermore, a significant (P < 0.001) increase in hypoxanthine level was demonstrated in SCA patients. However, the serum levels for xanthine (P < 0.01) and uric acid (P < 0.001) were decreased in SCA patients. A significant (P < 0.001) decrease in XO activity was detected in SCA patients.
Discussion: The altered parameters in SCA patients suggest that the generation and impairment of oxidative stress in this disease as well as antioxidant markers are contributory factors towards cellular redox homeostasis and alteration of purine metabolites.
Introduction
Sickle cell anemia (SCA) is characterized by homozygous hemoglobin S (HbS) and represents the most severe form of sickle cell disease (SCD). It is considered to be one of the commonest genetic disorders in the world [Citation1]. This disease is a consequence of a mutation in the beta globin chain, inducing the substitution of Val for Glu at position 6 and shifting the isoelectric point of the protein [Citation2]. Sickle cell disease promotes harmful pathological effects including sickling of erythrocytes, vaso-occlusion and ischemia-reperfusion injury. Increasing evidence reveals that oxidative stress may participate in enhancing the pathophysiology of secondary dysfunctions in sickle cell patients [Citation3,Citation4].
Some of the oxidative mechanisms that may disturb the redox state include excessive levels of free iron in hemoglobin that may catalyze the Fenton reaction [Citation5], recurrent ischemia-reperfusion injury which may promote the activation of xanthine-xanthine oxidase (XO) system [Citation6] and higher autoxidation of HbS leading to the generation of superoxide anion radicals and hydrogen peroxide [Citation7]. Oxidative stress results from an imbalance between pro-oxidant and antioxidant biomarkers. It can damage the cell structures such as lipids, membranes, proteins and nucleic acids leading to cell death or altered cell function [Citation8]. Oxidative stress is therefore a critical factor in endothelial dysfunction, inflammation and damage to multiple organs [Citation9]. Furthermore, chronic proinflammatory responses in sickle cell patients induced by constant recruitment of neutrophils and monocytes have been implicated in some complications associated with SCA [Citation10,Citation11].
The red blood cells (RBCs) reoxygenation phase is a major source of free radical production in SCD. Both hemoglobin A (HbA) and HbS blood have tendencies to autoxidize into methemoglobin and superoxide [Citation7,Citation12], however some studies reveal that HbS can autooxidize faster than HbA [Citation10,Citation13]. It is worth noting that the pathogenesis of SCA is associated with the polymerization of deoxygenated HbS, which alters the normal biconcave disc shape into a rigid, irregular shaped and unstable cell [Citation3], thereby causing intravascular hemolysis to release hemoglobin into the plasma [Citation4].
Considering that the pathophysiology of SCA can be viewed as a cycle driven by hemolysis, oxidative stress and inflammatory process, it is extremely relevant to evaluate the oxidative stress status in relation to the serum nucleosides metabolite levels in SCA patients. Thus, this study was conducted to assess the markers of oxidative stress [levels of reactive oxygen species (ROS), plasma proteins, carbonyl content, lipid peroxidation, total thiols, glutathione and catalase activity], myeloperoxidase (MPO), acetylcholinesterase (AChE) and XO activities as well as the levels of nucleotide metabolites in SCA patients.
Material and methods
Chemicals
The materials 2-thiobarbituric acid (TBA), dithiothreitol (DTT), 5,5′-dithio-bis-2-nitrobenzoic acid (DTNB), 2-4-dinitrophenylydrazine (DNPH), malondialdehyde (MDA), tris hydroxymethyl-aminomethane, hydrogen peroxide (H2O2) were purchased from Sigma (Saint-Louis, MO, USA). All other chemicals were of analytical grade and obtained from standard commercial suppliers.
Patients and samples
The sample consisted of 15 SCA patients (in steady state) 30 healthy subjects as a control group. The diagnosis of SCA was based on International Statistical Classification of Diseases and Related Health Problems (ICD 10) (D 57.0/57.1) [Citation14]. All patients were currently receiving medications, such as folic acid and hydroxyurea. The subjects gave written informed consent to participate in this study and the Human Ethics Committee of the Health Science Center from the Federal University of Santa Maria approved under the registration number; 512.074. Subjects with altered blood pressure, alcoholism, cigaret smoking or diagnostic of diabetes mellitus, autoimmune disease and immunodeficiency were excluded from participating in this study. SCA patients who received blood transfusion at least two months earlier were also excluded. About 4 ml of blood was obtained from each patient and used for subsequent preparation of plasma and serum. The same procedure was also carried out for the control group.
Blood serum and plasma separated
Blood was collected into vacutainer tubes without an anticoagulant system for the preparation of serum while the plasma was obtained when the blood was collected in vacutainer tubes containing EDTA and citrate. The blood samples in vacutainers were subsequently separated by centrifugation at 3000 rpm for 10 min to obtain the serum and the plasma The serum was used to determine the ROS, thiobarbituric acid-reactive substances (TBARS), carbonyl levels, total thiols, GSH and XO; plasma was used to determine MPO levels and whole blood collected with EDTA and citrate respectively was used to determine acetylcholinesterase and catalase.
Protein determination
Protein was determined by the Coomassie blue method described by Bradford [Citation15] using bovine serum albumin as standard.
Dichlorofluorescein fluorescence assay (DCF)
The 2′-7′-DCF assay was used to measure cellular peroxide production and other reactive species [Citation16]. Aliquots of 50 μL of serum were added to a medium containing Tris–HCl buffer (0.01 mM, pH 7.4) 2′-7′-dichlorofluorescein diacetate DCFH-DA (1 mM). After the addition of DCFH-DA, the medium was incubated in the dark for 1 h until the fluorescence measurement (excitation at 488 nm and emission at 525 nm, with both slit widths at 1.5 nm). The oxidized dichlorofluorescein was determined using a standard curve of oxidized dichlorofluorescein and the results were expressed as DCFH-DA Fluorescence.
Thiobarbituric acid-reactive substance (TBARS) measurement
TBARS levels were determined according to the method described by Jentzsch et al. [Citation17]. The concentration of MDA is measured as an index of lipid peroxidation by the reaction with TBA. Briefly, the reaction mixture, containing 200 μL of serum or standard (0.03 mM MDA), 1 mL of 0.2 M orthophosphoric acid and 250 μL of 0.1M TBA was heated at 95°C for 120 min. The absorbance was measured at 532 nm. TBARS serum levels were expressed as nmol MDA/mg of protein.
Protein carbonyl levels
The carbonylation of proteins was determined by the method described by Resnick; Packer [Citation18] and Levine et al. [Citation19] with slight modification. Briefly, 1 ml of serum was added to 0.5 ml of 10% trichloroacetic acid (TCA) in order to precipitate proteins, centrifuged at 1800g for 5 min and the supernatant was discarded. Five hundred microliter of 10 mmol l−1 2,4-dinitrophenylhydrazine (DNPH) in 2 mol l−1 HCl was added to this protein precipitate and incubated at room temperature for 1 h. During incubation, the reaction mixtures were vigorously mixed for 15 min, 3% of Sodium Dodecyl Sulfate (SDS), ethanol and heptane were subsequently added and incubated for about 20 minutes at 50°C in a water bath. The absorbance was read at 370 nm in the UV-VIS spectrophotometer. The results of serum carbonyl levels were subsequently calculated and expressed as nmol carbonyl/mg of protein.
Determination of total thiols (T-SHs) and reduced glutathione (GSH)
Total thiol groups were assayed spectrophotometrically by the method of Boyne and Ellman [Citation20] with minor modification. An aliquot of 200 μl of serum in a final volume of 900 μl of solution was used for the reaction. The reaction product was measured at 412 nm after the addition of 10 mM 5-5-dithio-bis (2-nitrobenzoic acid) (DTNB) (0.05 ml). A standard curve using cysteine was added to calculate the content of thiol groups in samples, and was expressed as nmol T-SH/ml of serum. The GSH was measured spectrophotometrically with Ellman's reagent [Citation21]. An aliquot of 200 μl for serum in a final volume of 900 μl of solution was used for the reaction. The reaction product was measured at 412 nm after the addition of 10 mM 5-5-dithio-bis(2-nitrobenzoic acid) (DTNB) (0.05 ml). A standard curve using cysteine was added to calculate the content of thiol groups in samples, and was expressed as nmol GSH/ml serum.
Assay of reductase glutathione (GR)
For the measurement of GR activity, we used a method previously described by Carlberg and Mannervik [Citation22], with some modifications. The method is based on the utilization the enzyme oxidized glutathione (GSSG), to convert GSSG to GSH in the presence of the cofactor NADPH. Briefly, brain supernatant (0.050 ml) was added to medium containing 0.2 M phosphate buffer (0.2 M K2HPO4 and 2 mM EDTA, pH 7.0) and NADPH (2 mM). The reaction was initiated by adding substrate GSSG (20 mM). The measurement of GR levels was measured by absorbance at 340 nm during 2 min of incubation. GR activity was determined using the molar extinction coefficient 6220 M−1 cm−1 and expressed as μmol/min/mg of protein.
Catalase activity (CAT)
The CAT activity was measured by the method described by Nelson; Kiesow [Citation23]. The reaction mixture contained 50 mM potassium phosphate buffer (pH 7), 10 mM H2O2 and 20 μl of whole blood collected with citrate. The rate of H2O2 reaction was monitored at 240 nm for 2 min at room temperature. The catalase activity was expressed in μmol/mg protein /minute.
AChE assay
The AChE assay was determined in whole blood by a modification of the spectrophotometric method of Ellman et al. [Citation24] as previously described by Rocha et al. [Citation25]. The reaction mixture (2 mL final volume) contained 100 mM K+-phosphate buffer, pH 7.5 and 1 mM 5,5 -dithio-bis-nitrobenzoic acid (DTNB). The method is based on the formation of the yellow anion, 5,5 -dithio-bis-acid nitrobenzoic, measured by absorbance at 412 nm during 2 min incubation at 25◦C. The enzyme was pre-incubated for 2 min. The reaction was initiated by adding 0.8 mM acetylthiocholine iodide (AcSCh). All samples were run in triplicate and enzyme activity was expressed in uMol de AcSCh/h/umol hemoglobin.
MPO activity in plasma
MPO was determined by the method described by Metcalf et al. [Citation26] with slight modification. MPO activity was measured in blood plasma from SCA patients and healthy individuals collected into EDTA bottle and followed by centrifugation at 1,800 × g for 10 min. The MPO activity was analyzed spectrophotometrically by a modified peroxidase-coupled assay system involving phenol, 4-aminoantipyrine (AAP) and H2O2 [Citation27]. Briefly, 390 μL of 2.5 mM AAP and 20 mM phenol were put in each tube, followed by the addition of 450 μL of 1.7 mM H2O2. In the presence of H2O2 as oxidizing agent, MPO catalyzes the oxidative coupling of phenol and AAP yielding a colored product, quinoneimine, with a maximum absorbance at 500 nM. The millimolar absorbance coefficient for the quinoneimine is represented as ƹ = 14 ± 0.1/mM/cm and the results were expressed in micromolar of quinoneimine produced at 30 min.
Xanthine oxidase activity
XO assay was performed by quantifying the rate of formation of uric acid. The reaction mixture was prepared by mixing 0.1 ml serum with (1.9 ml of 0.05 mol/L potassium phosphate buffer, pH 7.5 and 1 ml of 2% w/v hypoxanthine substrate). Time dependent increase in the absorbance at 290 nm was recorded against blank. The activity of XO is expressed as U/I in serum. One international unit of XO will metabolize one micromole of hypoxanthine per minute [Citation28].
Analysis of purine levels by high-pressure liquid chromatography (HPLC)
The hypoxanthine, xanthine and uric acid levels in sera of SCA patients and healthy individuals were analyzed by HPLC. The denaturation of proteins was performed using 0.6 mol/L perchloric acid. All samples were then centrifuged (14,000 x g for 10 min at 4°C), supernatants were neutralized with 4.0N KOH and a second centrifugation (14,000 x g for 30 min at 4°C) was done. After second centrifugation, the supernatants were collected and centrifuged again (14,000 x g for 30 min at 4°C). Twenty microliters of aliquots were analyzed in a reversed-phase HPLC (Shimadzu, Japan) using a C18 column (Ultra C18, 25 cm x 4.6 mm x 5 µm, Restek – USA). The elution was carried out by applying a linear gradient from 100% solvent A (60 mM KH2PO4 and 5 mM of tetrabutylammonium phosphate, pH 6.0) to 100% of solvent B (solvent A plus 30% methanol) over a 30 min period (flow rate at 1.4 mL/min) [Citation29]. The amounts of purines were measured by absorption at 254 nm. The retention time of standards was used as parameter for identification and quantification. Purines concentrations were expressed as nmol of compound per mL of serum.
Statistical analysis
A priori analysis was used to determine the necessary sample size N based on [Citation30] Mayr et al. (2007) report. Statistical analysis variables were expressed as mean ± standard error of mean (SEM). The data obtained were analyzed statistically by the Student’s t test for independent samples. Differences were considered significant when probability was P < 0.05.
Results
General characteristics of the patients
The samples comprise of 30 healthy patients with an average male age of 29 (range: 19–37 years old) and average female age of 23 (range: 18–35 years old), as the control group. The HbSS group (SCA) was composed of five male and ten female patients with a mean male age of 33 (range: 31–38 years old) and mean female age of 26 (range: 18–51 years old). These patients were administered 5 mg/kg/day and 35 mg/kg/day doses of folic acid and hydroxyurea respectively.
Oxidative stress status: ROS, TBARS and carbonyl
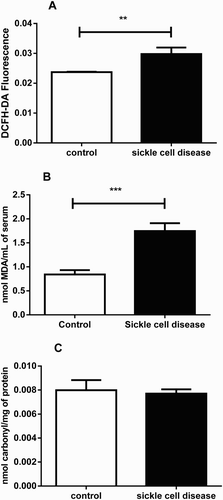
The result of ROS, TBARS and carbonyl levels are shown in a–c. ROS level was significantly (P < 0.01) increased in serum of SCA patients (0.029 DCFH-DA Fluorescence; SEM = 0.00; n = 15) by 29.4% in comparison to the control group (0.023 DCFH-DA Fluorescence; SEM = 0.00; n = 30). In addition, we investigated the concentrations of TBARS, as an index of lipid peroxidation. The results for TBARS revealed that SCA patients had significantly (P < 0.001) higher (about 2 folds) MDA levels (1.74 nmol MDA/mL of serum; SEM = 0.16; n = 15) when compared to control group (0.84 nmol MDA/mL of serum; SEM = 0.09; n = 30). However, the result of the serum protein carbonyl content showed that there was no significant (P > 0.05) alteration between SCA patients (0.007 nmol carbonyl/mg of protein; SEM = 0.00; n = 15; and healthy subjects (0.007 nmol carbonyl/mg of protein; SEM = 0.00).
Figure 1. ROS (A), TBARS (B) and carbonyl levels (C) in serum of SCA patients and controls. Bars represent mean ± S.E.M. (‘**’) indicates a significant (P < 0.01) difference between the SCA patients (n = 15) and control (n = 30). (‘***’) indicates a significant (P < 0.001) difference between the SCA patients (n = 15) and control (n = 30). Student's t test for independent samples was used for all the analyses.
T-SH and GSH levels
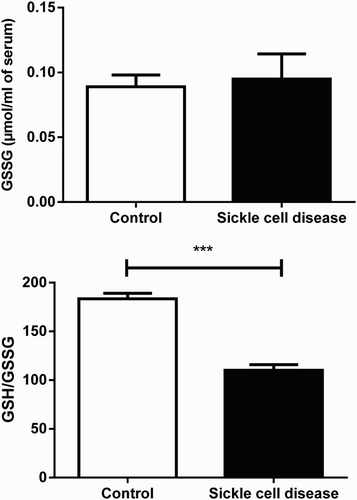
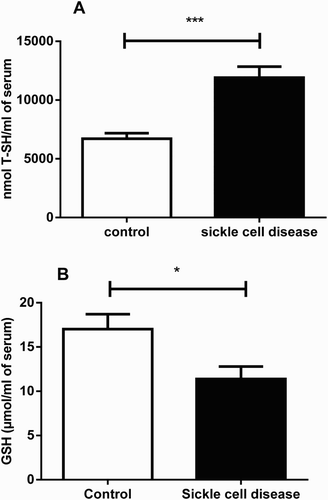
T-SH and GSH levels in serum are shown in . There was a significantly (P < 0.001) higher T-SH levels in SCA patients (11.905 nmol T-SH/ml of serum; SEM = 943.8; n = 15; 77.5%) when compared to the control group (6.706 nmol T-SH/ml of serum; SEM = 469.4; n = 15). Conversely, GSH level was significantly (P < 0.05) reduced by 33% in SCA patients (11.40 µmol/ml of serum; SEM = 1.39; n = 15) in comparison to healthy subjects (17.02 µmol/ml of serum; SEM = 1.68; n = 30).
Figure 2. T-SH and GSH levels in serum of SCA patients and control group. Bars represent mean ± S.E.M. (‘*’) indicates a significant (P < 0.05) difference between the SCA patients (n = 15) and control (n = 30). (‘***’) indicates a significant (P < 0.001) difference between the SCA patients (n = 15) and control (n = 30). Student's t test for independent samples was used for all the analyses.
Reductase glutathione (GR)
The results obtained for GR are shown in . No statistical difference was observed between SCA patients (0.09 µmol/ml of serum; SEM = 0.01; P > 0.05; n = 15) and control group (0.08 µmol/ml of serum; SEM = 0.00; n = 30).
Catalase activity in serum
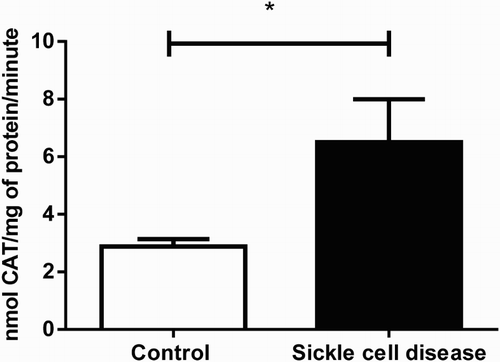
The result of CAT activity is presented in . We observed a significant (P < 0.05) increase in serum CAT activity (2.3 folds higher) of SCA patients (6.50 nmol CAT/mg of protein/minute; SEM = 1.49; n = 15) when compared to the healthy subjects (2.87 nmol CAT/mg of protein/minute; SEM = 0.25; n = 15).
Myeloperoxidase activity
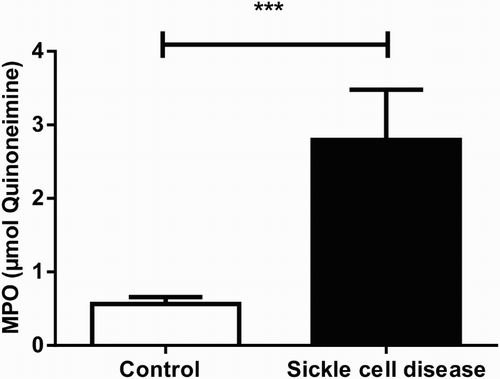
The result of MPO activity is shown in . There was a significant (P < 0.001) elevation in MPO activity (about 4.9 folds) in SCA patients (2.79 µmol Quinoneimine; SEM = 0.27; n = 15) in comparison to the control group (0.56 µmol Quinoneimine; SEM = 0.09; n = 30).
Acetylcholinesterase activity (AChE)
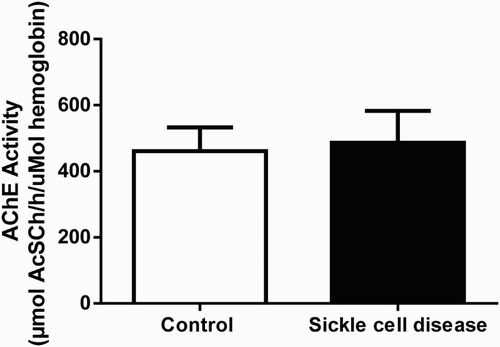
The result of AChE activity revealed that there was no significant (P > 0.05) difference in AChE activity between SCA patients and control group ().
Figure 6. Acetyl cholinesterase activity in total blood of SCA patients and control group. Bars represent mean ± S.E.M. No statistical difference was found between SCA patients (n = 15) and control group (n = 30), (P > 0.05). Student's t test for independent samples was used for statistical analyze.
Analysis of purine levels
Serum purine (hypoxanthine, xanthine and uric acid) levels were measured by HPLC and were shown in . The result revealed that there was a significant (P < 0.001) increase in hypoxanthine level in SCA patients (25.2 nmol/ml; SEM = 1.5, n = 15) when compared to healthy subjects (9.5 nmol/ml; SEM = 0.5; n = 30). However, the serum levels for xanthine (19.5 nmol/ml; SEM = 1.8, n = 15; P < 0.01) and uric acid (10.3 nmol/ml; SEM = 1.9, n = 15; P < 0.001) in SCA patients were decreased by 29.8% and 62.3% respectively when compared to xanthine (27.8 nmol/ml; SEM = 1.9, n = 30) and uric acid (27.5 nmol/ml; SEM = 3.5, n = 30) levels in the control group.
Table 1. Nucleotide metabolites measurement in serum of SCA patients and control group.
Xanthine oxidase activity
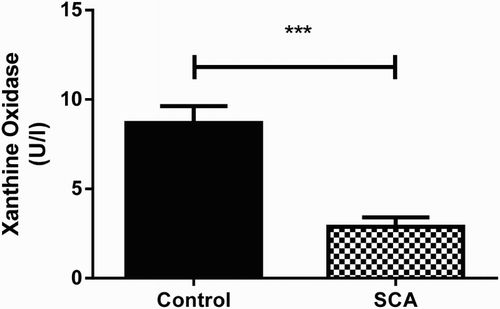
The activity of Serum XO in SCA patients and normal individuals is shown in . A significant (P < 0.001) decrease in XO activity was noticed in SCA patients (2.8 U/I; SEM = 0.5, n = 15) when compared to the control group (8.6 U/I; SEM = 0.9, n = 30).
Discussion
The intracellular polymerization of HbS during deoxygenation is the primary pathogenetic event in SCD [Citation31]. Polymerization can transform a normal RBC into a dense, inflexible blood cell and cause harmful pathophysical effects, including sickling, vaso-occlusion and ischemia-reperfusion injury [Citation32,Citation33]. These complications have cyclic nature which involve the generation of excessive ROS and promotion of oxidative stress [Citation34]. The abnormal RBC shape renders them to be prone to hemolysis, leading to the release of cell-free hemoglobin and heme in blood circulation [Citation35] . The excess levels of cell-free hemoglobin and heme with their catalytic action on ROS generation may contribute to the high oxidative burden in SCD patients [Citation36,Citation37]. In the present study, we evaluated the parameters for assessing oxidative stress (ROS, total thiols and reduced glutathione levels) in SCA patients. The observed increase in ROS production in SCA patients may be attributed to the enhanced hypoxia in both the mitochondria and in tissues, as well as during reperfusion phase [Citation38]. This is in agreement with earlier study by Hierso et al. [Citation36] where higher ROS content was found in HbS (SS) patient group when compared to HbA (AA) group. Besides that, the susceptibility of HbS to oxidation-related mechanisms is most likely a contributing factor to the pathophysiology of the disease [Citation38,Citation39]. These processes result in the conversion of hemoglobin (Hb) to metHb and the generation of ROS, including superoxide ions (O2 . ); which dismutate to H2O2 resulting in greatly enhanced Hb denaturation and partitioning of the released heme in the membrane bilayer [Citation40].
Furthermore, we noticed an elevated total thiol and reduced GSH levels in SCA patients when compared to the control group in our study. ROS does not only function as oxidizing molecules but are also able to modulate the activity of transcription factors, membrane channels, metabolic enzymes and thus integrate into signaling pathways [Citation41] possibly through oxidation of protein thiols [Citation42]. Previous studies have described impaired antioxidative mechanisms in sickle RBCs [Citation43,Citation44] and oxidative membrane damage reflected in the presence of oxidized protein thiols [Citation45]. Rank et al. [Citation45] corroborated our results by explaining that increased thiol oxidation of most of the proteins of the membrane, may have facilitated the increased oxygen radical generation in the sickle cell membranes [Citation46]. In addition, reduced glutathione reacts with ROS and contribute to cellular redox homeostasis. In particular, GSH is considered as the major thiol-disulfide redox buffer of cells [Citation47]. The variations of GSH in oxidation states can significantly modify the redox environment of RBSs. In this study, the results obtained for GSH/GSSG ratio showed to be decreased in SCA patients when compared to control. Our results corroborate with Somjee et al. [Citation48] and Reid et al. [Citation49]. The tripeptide glutathione plays a central role in the defense against ROS, and in sickle cell disease, both total glutathione levels and GSH/GSSH ratio are decreased. In this case, the reduction of GSH levels observed in SCA patients could have resulted from the depletion of the redox homeostasis [Citation50,Citation51]. Also, previous study demonstrated that GSH level in sickle RBCs may be approximately 50% lower than hemoglobin A RBCs [Citation52]. GSH can modify protein thiol during ROS attack and hence may serve as a protective mechanism for cells [Citation53]. It has been estimated that proteins can scavenge the majority (50–75%) of reactive species generated in cells [Citation54] and much of this function may be attributed to the thiol groups present on them. The serum levels of protein thiol in the body indicate antioxidant status [Citation55], therefore the observed elevation in total thiol level in this study, could be an attempt of the body to modify the redox background in SCA patients.
Oxidative damage can be induced in heme proteins [Citation56]. This is accompanied by the formation of protein carbonyl groups that has been widely used as a marker of protein oxidation [Citation57,Citation58]. Our findings revealed that there was no alteration on carbonyl protein content in SCA patients. This may however be linked to the possible inhibition of protein carbonyl formation through the action of GSH [Citation56]. This may have led to the decreased GSH level observed in SCA patients. Stable oxidative modifications, such as protein carbonyls may contribute immensely towards some of the positive clinical findings in SCA patients. Also, ROS generated in these patients can attack erythrocytes’ membrane directly, causing alteration in lipid structure that may eventually result into hemolysis [Citation59]. Lipid peroxidation may thus play a vital role in the pathophysiology of SCA [Citation60]. In our study, the serum levels of TBARS levels was significantly elevated in SCA patients. This is in agreement with previous studies where index of lipid peroxidation was reported to be increased in SCA patients [Citation61–63]. RBCs are particularly susceptible to peroxidative damage because they contain hemoglobin, which has one of the powerful catalysts (Fe2+) for initiation of peroxidative reaction [Citation64]. Accumulation of MDA may disturb the phospholipids organization in the human erythrocyte membrane bilayer and contribute towards pathophysiology of SCA due to the formation of irreversible sickle cells [Citation65].
Silva et al. [Citation66] reported that increased pro-oxidant generation in SCD may result in an antioxidant deficiency. The catalase is an endogenous antioxidant enzyme present in all aerobic cells and facilitates the removal of toxic hydrogen peroxide by catalyzing its decomposition to molecular oxygen and water, without the production of free radicals [Citation67]. It is therefore useful as a defense agent against oxidative stress [Citation67]. However, there are some discrepancies between studies on catalase levels in this disease, with some studies observing increased activity [Citation68] and others reporting decreased catalase activity [Citation69,Citation70]. Our results showed an increase in catalase activity in SCA patients. An increase in this enzyme activity potentially constitute a defense mechanism in response to increased oxidative stress [Citation71], or might be a consequence of increased reticulocyte content in blood samples from patients with SCD. Additionally, acetylcholinesterase is found in RBCs membrane and vascular tissue where the physiological role is not fully understood [Citation72,Citation73]. It is assumed that erythrocyte acetylcholinesterase plays a role in controlling permeability and transport across non-neural membranes [Citation74,Citation75]. In this study, the acetylcholinesterase activity was not altered in SCA patients. The potentiated endothelium dependent response to acetylcholine, together with the normal nitro-vasodilator response, may suggest increased production and/or decreased degradation of NO in SCD patients.
Ischemia and reperfusion injury with resultant activation of inflammatory cells have also been implicated as important contributors to the pathophysiology and disease mechanism of vascular occlusion during SCD [Citation76]. Some ROS-forming enzymes that are normally present intracellular can also be found in the circulation. Higher circulating activities of XO and MPO could potentially result in increased ROS production, although this depends on other factors such as availability of the substrate (xanthine for XO and H2O2 for MPO) [Citation77]. In this study, we investigated MPO and XO activities in SCA patients. Our results revealed that both enzymes were altered in SCA patients in comparison to control group; MPO activity was higher while XO was lower in SCA patients. Corroborating our results, Zhang et al. [Citation77] reported that SCD patients have higher plasma MPO than controls. Polymorphonuclear neutrophils are well recognized for playing important roles in inflammation in SCD [Citation78]. Activated leukocytes release MPO, which subsequently enter the vessel wall, increase inflammation and generate oxidants [Citation78]. Therefore, the observed increase in MPO activity in SCA patients in our study, may aggravate ROS production in SCA patients. Furthermore, it has been reported that HbSS patients are more prone to hypoxia-reoxygenation injury [Citation6,Citation37]. Generation of ROS may also result from the activation of XO which is activated during repeated cycles of hypoxia/re-oxygenation or ischemia/reperfusion [Citation79,Citation80]. In our study, we observed a decrease in XO activity in SCA patients. XO catalyzes the generation of superoxide radical from hypoxanthine [Citation6] and may cause a slight reduction of XO in HbSS subjects leading to slight reduction of H2O2. In addition, the observed decrease in serum XO activity in SCA patients was confirmed by the measurement of serum purine levels using HPLC. The results suggest that hypoxanthine level was elevated while xanthine and uric acid levels were significantly decreased in the extracellular medium when compared with the control group.
In conclusion, the results indicate the presence of an oxidative and compensatory status in SCA patients, which can be observed by their high levels of ROS, lipid peroxidation, total thiols and catalase activity; and decreased XO activity. The altered parameters in SCA patients made it clear that the generation and impairment of oxidative stress in this disease as well as antioxidant markers are contributory factors towards cellular redox homeostasis and alteration of purine metabolites.
Disclaimer statements
Contributors: L.G.C, J.S.O and F.H.A carried out most of the experiments. P.H.D and L.P.M. carried out additional and confirmative experiments. S.A.A., L.G.C. and C.M.A. revised results, discussed them and revised the preliminary draft of the manuscript. L.G.C and D.B.R.L conceived the experimental work and wrote the preliminary draft of the manuscript. All the authors approved the final version of the manuscript.
Acknowledgements
The authors sincerely thank the SCA patients, the Serviço de Hemato-Oncologia do Hospital Universitário de Santa Maria and Projeto Pilão – Presença Negra no Campo, Projeto ‘Educação e Saúde na Doença Falciforme’ do Centro de Ciências da Saúde – Departamento de Saúde da Comunidade – UFSM for supplying some materials used for the experiment. This study was supported by the Conselho Nacional de Desenvolvimento Científico e Tecnológico (CNPq), Fundação de Amparo à Pesquisa do Rio Grande do Sul (FAPERGS) and Fundação Coordenação de Aperfeiçoamento de Pessoal de Nível Superior (CAPES), Brazil.
Disclosure statement
No potential conflict of interest was reported by the authors.
Notes on contributors
Livia Gelain Castilhos obtained PhD in Pharmaceutical Sciences (Federal University of Santa Maria, Brazil).
Juliana Sorraila de Oliveira obtained Master’s degree in Toxicological Biochemistry (Federal University of Santa Maria, Brazil).
Stephen Adeniyi Adefegha obtained PhD in Applied Biochemistry (Federal University of Technology, Nigeria).
Luana Pereira Magni obtained Master’s degree in Toxicological Biochemistry (Federal University of Santa Maria, Brazil).
Pedro Henrique Doleski obtained Master’s degree in Toxicological Biochemistry (Federal University of Santa Maria, Brazil).
Fatima Husein Abdalla obtained PhD in Toxicological Biochemistry (Federal University of Santa Maria, Brazil).
Cínthia Melazzo de Andrade obtained PhD in Toxicological Biochemistry (Federal University of Santa Maria, Brazil).
Daniela Bitencourt Rosa Leal obtained PhD in Toxicological Biochemistry (Federal University of Santa Maria, Brazil).
ORCID
Juliana Sorraila de Oliveira http://orcid.org/0000-0002-0552-8993
Luana Pereira Magni http://orcid.org/0000-0003-0754-5444
Daniela Bitencourt Rosa Leal http://orcid.org/0000-0003-2618-9801
References
- Frenette PS, Atweh GF. Sickle cell disease: old discoveries, new concepts, and future promise. J Clin Invest. 2007;117:850–858. doi: 10.1172/JCI30920
- Piccin A. Do we need to test blood donors for sickle cell anaemia? Blood Transfus. 2010;8:137–138.
- Stuart MJ, Nagel RL. Sickle-cell disease. The Lancet 2004;364:1343–1360. Available from: http://www.sciencedirect.com/science/article/pii/S0140673604171924. doi: 10.1016/S0140-6736(04)17192-4
- Belcher JD, Beckman JD, Balla G, et al. Heme degradation and vascular injury. Antioxid Redox Signal. 2010;12:233–248. Available from: http://www.pubmedcentral.nih.gov/articlerender.fcgi?artid = 2821146&tool = pmcentrez&rendertype = abstract. doi: 10.1089/ars.2009.2822
- Chirico EN, Pialoux V. Role of oxidative stress in the pathogenesis of sickle cell disease. IUBMB Life. 2012;64:72–80. doi: 10.1002/iub.584
- Osarogiagbon UR, Choong S, Belcher JD, et al. Reperfusion injury pathophysiology in sickle transgenic mice. Blood. 2000;96:314–320.
- Aslan M, Thornley-Brown D, Freeman B. Reactive species in sickle cell disease. Ann N Y Acad Sci. 2000;899:375–391. doi: 10.1111/j.1749-6632.2000.tb06201.x
- Magalhães SMM. Oxidative status in sickle cell anemia. Rev Bras Hematol Hemoter. 2011;33:177–178. Available from: http://www.rbhh.org/?doi = 10.5581/1516-8484.20110049. doi: 10.5581/1516-8484.20110049
- Hebbel RP, Osarogiagbon R, Kaul D. The endothelial biology of sickle cell disease: inflammation and a chronic vasculopathy. Microcirculation 2009;11:129–151. Available from: http://www.tandfonline.com/doi/abs/10.1080/10739680490278402. doi: 10.1080/mic.11.2.129.151
- Hebbel RP, Morgan WT, Eaton JW, et al. Accelerated autoxidation and heme loss due to instability of sickle hemoglobin. Proc Natl Acad Sci U S A. 1988;85:237–241. Available from: http://www.pubmedcentral.nih.gov/articlerender.fcgi?artid = 279519&tool = pmcentrez&rendertype = abstract. doi: 10.1073/pnas.85.1.237
- Ramos CL, Pou S, Britigan BE, et al. Spin trapping evidence for myeloperoxidase-dependent hydroxyl radical formation by human neutrophils and monocytes. J Biol Chem [Internet]. 1992;267:8307–8312. Available from: http://www.ncbi.nlm.nih.gov/pubmed/1314821.
- Conran N, Franco-Penteado CF, Costa FF. Newer aspects of the pathophysiology of sickle cell disease vaso-occlusion. Hemoglobin. 2009;33:1–16. doi: 10.1080/03630260802625709
- Wood KC, Hsu LL, Gladwin MT. Sickle cell disease vasculopathy: a state of nitric oxide resistance. Free Radic Biol Med. 2008;44:1506–1528. doi: 10.1016/j.freeradbiomed.2008.01.008
- World Health Organization. Constitution of the world health organization [Internet]. Basic Doc. Forthy-fifth Ed. 2006. Available from: http://www.who.int/en.
- Bradford MM. A rapid and sensitive method for the quantitation of microgram quantities of protein utilizing the principle of protein-dye binding. Anal Biochem. 1976;72:248–254. doi: 10.1016/0003-2697(76)90527-3
- Myhre O, Andersen JM, Aarnes H, et al. Evaluation of the probes 2′,7′-dichlorofluorescin diacetate, luminol, and lucigenin as indicators of reactive species formation. Biochem Pharmacol. 2003;10:1575–1582. doi: 10.1016/S0006-2952(03)00083-2
- Jentzsch aM, Bachmann H, Furst P, et al. Improved analysis of malondialdehyde in human body fluids. Free Radic Biol Med. 1996;20:251–256. doi: 10.1016/0891-5849(95)02043-8
- Resnick AZ, Packer K. Oxidative damage to proteins: spectrophotometric method for carbonyl assay. Methods Enzym. 1994;233:357–363. doi: 10.1016/S0076-6879(94)33041-7
- Levine RL, Williams JA, Stadtman EP, et al. Determination of carbonyl groups in oxidized proteins. Methods Enzym. 1994;233:346–357. doi: 10.1016/S0076-6879(94)33040-9
- Boyne AF, Ellman GL. A methodology for analysis of tissue sulfhydryl components. Anal Biochem. 1972;46:639–653. doi: 10.1016/0003-2697(72)90335-1
- Ellman GL. Tissue sulfhydryl groups. Arch Biochem Biophys. 1959;82:70–77. Available from: http://www.sciencedirect.com/science/article/pii/0003986159900906. doi: 10.1016/0003-9861(59)90090-6
- Carlberg I, Mannervik B. Glutathione reductase. Methods Enzymol. 1985;113:484–490. doi: 10.1016/S0076-6879(85)13062-4
- Nelson DP, Kiesow LA. Enthalpy of decomposition of hydrogen peroxide by catalase at 25°C (with molar extinction coefficients of H2O2 solutions in the UV). Anal Biochem. 1972;49:474–478. doi: 10.1016/0003-2697(72)90451-4
- Ellman GL, Courtney KD, Andres V, et al. A new and rapid colorimetric determination of acetylcholinesterase activity. Biochem Pharmacol. 1961;7:88–95. doi: 10.1016/0006-2952(61)90145-9
- Rocha JBT, Emanuelli T, Pereira ME. Effects of early undernutrition on kinetic parameters of brain acetylcholinesterase from adult rats. Acta Neurobiol Exp (Wars). 1993;53:431–437.
- Metcalf J, Gallin JI, Nauseef WM, et al. Root, laboratory manual of neutrophil function. New York: Raven Press; 1986.
- Kayyali US, Moore TB, Randall JC, et al. Neurotoxic esterase (NTE) assay: optimized conditions based on detergent-induced shifts in the phenol/4-aminoantipyrine chromophore spectrum. J Anal Toxicol. 1991;15:86–89. doi: 10.1093/jat/15.2.86
- Sh N. The correlation between xanthine oxidase, lactate dehydrogenase and nitric oxide levels in sera of patients with. Eur J Pharma Med Res. 2016;3:66–71.
- Voelter W, Zech K, Arnold P, et al. Determination of selected pyrimidines, purines and their metabolites in serum and urine by reversed-phase ion-pair chromatography. J Chromatogr A. 1980;199:345–354. Available from: http://linkinghub.elsevier.com/retrieve/pii/S002196730191386X. doi: 10.1016/S0021-9673(01)91386-X
- Mayr S, Buchner A, Erdfelder E, et al. A short tutorial of GPower. Tutor Quant Methods Psychol. 2007;3:51–59. Available from: http://www.gpower.hhu.de/fileadmin/redaktion/Fakultaeten/Mathematisch-Naturwissenschaftliche_Fakultaet/Psychologie/AAP/gpower/GPowerShortTutorial.pdf. doi: 10.20982/tqmp.03.2.p051
- Bunn HF, Noguchi CT, Hofrichter J, et al. Molecular and cellular pathogenesis of hemoglobin SC disease. Proc Natl Acad Sci U S A. 1982;79:7527–7531. doi: 10.1073/pnas.79.23.7527
- Uzunova VV, Pan W, Galkin O, et al. Free heme and the polymerization of sickle cell hemoglobin. Biophys J. 2010;99:1976–1985. doi: 10.1016/j.bpj.2010.07.024
- Klings ES, Farber HW. Role of free radicals in the pathogenesis of acute chest syndrome in sickle cell disease. Respir Res. 2001;2:280–285. Available from: http://www.pubmedcentral.nih.gov/articlerender.fcgi?artid = 59517&tool = pmcentrez&rendertype = abstract. doi: 10.1186/rr70
- Reiter CD, Wang X, Tanus-Santos JE, et al. Cell-free hemoglobin limits nitric oxide bioavailability in sickle-cell disease. Nat Med. 2002;8:1383–1389. doi: 10.1038/nm1202-799
- Gladwin MT, Kanias T, Kim-Shapiro DB. Hemolysis and cell-free hemoglobin drive an intrinsic mechanism for human disease. J Clin Invest. 2012;122:1205–1208. doi: 10.1172/JCI62972
- Hierso R, Waltz X, Mora P, et al. Effects of oxidative stress on red blood cell rheology in sickle cell patients. Br J Haematol. 2014;166:601–606. doi: 10.1111/bjh.12912
- Szocs, K. Endothelial dysfunction and reactive oxygen species production in ischemia/reperfusion and nitrate tolerance. Gen Physiol Biophys. 2004;23:265–295.
- Asakura T, Onishi T, Friedman S, et al. Abnormal precipitation of oxyhemoglobin S by mechanical shaking. Proc Natl Acad Sci U S A. 1974;71:1594–1598. Available from: http://www.pubmedcentral.nih.gov/articlerender.fcgi?artid = 388282&tool = pmcentrez&rendertype = abstract. doi: 10.1073/pnas.71.5.1594
- Hebbel RP, Ney PA, Foker W. Autoxidation, dehydration, and adhesivity may be related abnormalities of sickle erythrocytes. Am J Physiol. 1989;256:C579–C583.
- Marva E, Hebbel RP. Denaturing interaction between sickle hemoglobin and phosphatidylserine liposomes. Blood [Internet]. 1994;83:242–249. Available from: http://www.bloodjournal.org/content/83/1/242.abstract.
- Leonard SS, Harris GK, Shi X. Metal-induced oxidative stress and signal transduction. Free Radic Biol Med. 2004;37:1921–1942. doi: 10.1016/j.freeradbiomed.2004.09.010
- Omura T. Heme-thiolate proteins. Biochem Biophys Res Commun. 2005;338:404–409. doi: 10.1016/j.bbrc.2005.08.267
- Zerez CR, Lachant NA, Lee SJ, et al. Decreased erythrocyte nicotinamide adenine dinucleotide redox potential and abnormal pyridine nucleotide content in sickle cell disease. Blood [Internet]. 1988;71:512–515. Available from: http://www.ncbi.nlm.nih.gov/pubmed/3337912.
- Lachant NA, Davidson WD, Tanaka KR. Impaired pentose phosphate shunt function in sickle cell disease: a potential mechanism for increased Heinz body formation and membrane lipid peroxidation. Am J Hematol. 1983;15:1–13. Available from: http://www.ncbi.nlm.nih.gov/pubmed/6881134. doi: 10.1002/ajh.2830150102
- Rank BH, Carlsson J, Hebbel RP. Abnormal redox status of membrane-protein thiols in sickle erythrocytes. J Clin Invest. 1985;75:1531–1537. doi: 10.1172/JCI111857
- Hebbel RP, Eaton JW, Balasingam M, et al. Spontaneous oxygen radical generation by sickle erythrocytes. J Clin Invest. 1982;70:1253–1259. doi: 10.1172/JCI110724
- Fewell SW, Travers KJ, Jonathan S, et al. The action of molecular chaperones in the early secretory pathway. Annu Rev Genet. 2001;35:149–191. doi: 10.1146/annurev.genet.35.102401.090313
- Somjee SS, Warrier RP, Thomson JL, et al. Advanced glycation end-products in sickle cell anaemia. Br J Haematol. 2005;128:112–118. doi: 10.1111/j.1365-2141.2004.05274.x
- Reid M, Badaloo A, Forrester T, et al. In vivo rates of erythrocyte glutathione synthesis in adults with sickle cell disease. Am J Physiol Endocrinol Metab. 2006;291:E73–9. Available from: http://www.ncbi.nlm.nih.gov/pubmed/16434557. doi: 10.1152/ajpendo.00287.2005
- Griffith OW. Biologic and pharmacologic regulation of mammalian glutathione synthesis. Free Radic Biol Med. 1999;27:922–935. doi: 10.1016/S0891-5849(99)00176-8
- Wu G, Fang Y-Z, Yang S, et al. Glutathione metabolism and its implications for health. J Nutr. 2004;134:489–492. Available from: http://jn.nutrition.org/content/134/3/489.abstract.
- Tatum VL, Chow CK. Antioxidant status and susceptibility of sickle erythrocytes to oxidative and osmotic stress. Free Radic Res. 1996;25:133–139. doi: 10.3109/10715769609149918
- Lu Q, Jourd’heuil FL, Jourd’heuil D. Redox control of G1/S cell cycle regulators during nitric oxide-mediated cell cycle arrest. J Cell Physiol. 2007;212:827–839. doi: 10.1002/jcp.21079
- Davies MJ, Fu S, Wang H, et al. Stable markers of oxidant damage to proteins and their application in the study of human disease. Free Radic Biol Med. 1999;27:1151–1163. doi: 10.1016/S0891-5849(99)00206-3
- Himmelfarb J, McMonagle E, McMenamin E. Plasma protein thiol oxidation and carbonyl formation in chronic renal failure. Kidney Int. 2000;58:2571–2578. doi: 10.1046/j.1523-1755.2000.00443.x
- Lu N, Chen W, Peng YY. Effects of glutathione, Trolox and desferrioxamine on hemoglobin-induced protein oxidative damage: anti-oxidant or pro-oxidant? Eur J Pharmacol. 2011;659:95–101. doi: 10.1016/j.ejphar.2011.03.009
- Dalle-Donne I, Rossi R, Giustarini D, et al. Protein carbonyl groups as biomarkers of oxidative stress. Clin Chim Acta. 2003;329:23–38. doi: 10.1016/S0009-8981(03)00003-2
- Levine RL, Wehr N, Williams JA, et al. Determination of carbonyl groups in oxidized proteins. Methods Mol Biol. 2000;99:15–24.
- Carrell RW, Winterbourn CC, Rachmilewitz EA. Activated oxygen and hemolysis. Br J Haematol. 1975;30:259–264. doi: 10.1111/j.1365-2141.1975.tb00540.x
- Hundekar P, Suryakar A, Karnik A, et al. Antioxidant status and lipid peroxidation in sickle cell anaemia antioxidant status and lipid peroxidation in sickle cell anaemia. Biomed Res. 2010:21(4):461–464.
- Titus J, Chari S, Gupta M, et al. Pro-oxidant and anti-oxidant status in patients of sickle cell anaemia. Indian J Clin Biochem. 2004;19:168–172. doi: 10.1007/BF02894279
- Das SK, Nair RC. Superoxide dismutase, glutathione peroxidase, catalase and lipid peroxidation of normal and sickled erythrocytes. Br J Haematol. 1980;44:87–92. doi: 10.1111/j.1365-2141.1980.tb01186.x
- Al-Naama LM, Hassan MK, Mehdi JK. Association of erythrocytes antioxidant enzymes and their cofactors with markers of oxidative stress in patients with sickle cell anemia. Qatar Med J. 2015;2015:14), Available from: http://www.pubmedcentral.nih.gov/articlerender.fcgi?artid = 4719435&tool = pmcentrez&rendertype = abstract. doi: 10.5339/qmj.2015.14
- Chiu D, Lubin B Shohet SB. Peroxidative reactions in red cell biology. In: Pryor W, editor. Free radicals in biology. New York: Academic Press; 1982. p. 115–160.
- Jain SK. The accumulation of malonyldialdehyde, a product of fatty acid peroxidation, can disturb aminophospholipid organization in the membrane bilayer of human erythrocytes. J Biol Chem. 1984;259:3391–3394.
- Silva DGH, Belini Junior E, De Almeida EA, et al. Oxidative stress in sickle cell disease: An overview of erythrocyte redox metabolism and current antioxidant therapeutic strategies. Free Radic Biol Med. 2013;65:1101–1109. doi: 10.1016/j.freeradbiomed.2013.08.181
- Qujeq D, Rezvani T. Catalase (antioxidant enzyme) activity in streptozotocin-induced diabetic rats. Int J Diabetes Metab. 2007;15:22–24.
- Stanley P, Balcerzak MD, Wallace NJ. Erythrocyte catalase activity in thalassaemia. Eur J Haematol. 2009;3(4):245–256.
- Barbosa MC, de Jesus dos Santos TE, dos Santos TN, et al. The effect of a selective inhibitor of phosphodiesterase-9 on oxidative stress, inflammation and cytotoxicity in neutrophils from patients with sickle cell anaemia. Basic Clin Pharmacol Toxicol. 2015: 118(4):271–278. doi: 10.1111/bcpt.12487
- Daak AA, Ghebremeskel K, Mariniello K, et al. Docosahexaenoic and eicosapentaenoic acid supplementation does not exacerbate oxidative stress or intravascular haemolysis in homozygous sickle cell patients. Prostaglandins Leukot Essent Fat Acids. 2013;89:305–311. doi: 10.1016/j.plefa.2013.09.006
- Gizi A, Papassotiriou I, Apostolakou F, et al. Assessment of oxidative stress in patients with sickle cell disease: the glutathione system and the oxidant-antioxidant status. Blood Cells Mol Dis. 2011;46:220–225. Available from: http://www.ncbi.nlm.nih.gov/pubmed/21334230. doi: 10.1016/j.bcmd.2011.01.002
- Massoulié J, Pezzementi L, Bon S, et al. Molecular and cellular biology of cholinesterases. Prog Neurobiol. 1993;41:31–91. doi: 10.1016/0301-0082(93)90040-Y
- Wiedner CDF. Effects of amphiphiles on structure and activity of human erythrocyte membrane acetylcholinesterase. Eur J Biochem. 1979;102:59–64. doi: 10.1111/j.1432-1033.1979.tb06262.x
- Layer PG and Willbold E. Novel functions of cholinesterases in development. Prog Histochem Cytochem. 1995;29:1–94.
- George ST, Balasubramanian AS. The identity of the serotonin-sensitive aryl acylamidase with acetylcholinesterase from human erythrocytes, sheep basal ganglia and electric eel. Eur J Biochem. 1980;111:511–524. doi: 10.1111/j.1432-1033.1980.tb04967.x
- Frijhoff J, Winyard PG, Zarkovic N, et al. Clinical relevance of biomarkers of oxidative stress. Antioxid Redox Signal. 2015;23:1144–1170. Available from: http://www.pubmedcentral.nih.gov/articlerender.fcgi?artid = 4657513&tool = pmcentrez&rendertype = abstract. doi: 10.1089/ars.2015.6317
- Zhang H, Xu H, Weihrauch D, et al. Inhibition of myeloperoxidase decreases vascular oxidative stress and increases vasodilatation in sickle cell disease mice. J Lipid Res. 2013;54:3009–3015. Available from: http://www.ncbi.nlm.nih.gov/pubmed/23956444. doi: 10.1194/jlr.M038281
- Aslan M, Freeman BA. Redox-dependent impairment of vascular function in sickle cell disease. Free Radic Biol Med. 2007;43:1469–1483. doi: 10.1016/j.freeradbiomed.2007.08.014
- Xu W, Chi L, Row BW, et al. Increased oxidative stress is associated with chronic intermittent hypoxia-mediated brain cortical neuronal cell apoptosis in a mouse model of sleep apnea. Neuroscience. 2004;126:313–323. doi: 10.1016/j.neuroscience.2004.03.055
- Yuan G, Adhikary G, McCormick A, et al. Role of oxidative stress in intermittent hypoxia-induced immediate early gene activation in rat PC12 cells. J Physiol. 2004;557:773–783. doi: 10.1113/jphysiol.2003.058503

