
ABSTRACT
Oxidative stress, physical inactivity and high-fat (FAT) diets are associated with hepatic disorders such as metabolic syndrome (MS). The therapeutic effects of physical training (PT) were evaluated in rats with MS induced by FAT diet for 13 weeks, on oxidative stress and insulin signaling in the liver, during the last 6 weeks. FAT-sedentary (SED) rats increased body mass, retroperitoneal fat, mean arterial pressure (MAP) and heart rate (HR), and total cholesterol, serum alanine aminotransferase, glucose and insulin. Livers of FAT-SED rats increased superoxide dismutase activity, thiobarbituric acid-reactive substances, protein carbonyl and oxidized glutathione (GSSG); and decreased catalase activity, reduced glutathione/GSSG ratio, and the mRNA expression of insulin receptor substrate 1 (IRS-1) and serine/threonine kinase 2. FAT-PT rats improved in fitness and reduced their body mass, retroperitoneal fat, and glucose, insulin, total cholesterol, MAP and HR; and their livers increased superoxide dismutase and catalase activities, the reduced glutathione/GSSG ratio and the expression of peroxisome proliferator-activated receptor gamma and insulin receptor compared to FAT-SED rats. These findings indicated adaptive responses to PT by restoring the oxidative balance and insulin signaling in the liver and certain biometric and biochemical parameters as well as MAP in MS rats.
Introduction
It is generally agreed that an individual’s genetic background and lifestyle factors contribute to the pathogenesis of metabolic disorders such as obesity, hyperglycemia, hyperlipidemia and hypertension, or the joint occurrence of these disorders, characterized as metabolic syndrome (MS) [Citation1,Citation2]. Both poor nutrition and physical inactivity are major factors in determining the manifestation of MS, but the exact causes remain unclear. Resistance to insulin in insulin-sensitive tissues such as adipose tissue, liver and muscle has been identified as a central disorder of MS [Citation3,Citation4]. The molecular mechanisms that lead to the onset of insulin resistance are diverse and incompletely understood. However, it is known that resistance to insulin is related to situations of overproduction of reactive oxygen species (ROS), due to mitochondrial dysfunction, overproduction of oxidants, the accumulation of fat, dyslipidemia, lipid peroxidation, hyperglycemia and hyperactivity of the renin–angiotensin system, nicotinamide adenine dinucleotide phosphate oxidase, nitric oxide and increased proinflammatory substances [Citation5]. Nutritional stress, such as caused by a high-fat (FAT) diet, promotes oxidative stress through the increase of lipid peroxidation products and of protein carbonylation, and decreased concentrations of reduced glutathione (GSH) and antioxidant substances [Citation6].
The liver plays a pivotal role in maintaining glycemia through the control of gluconeogenesis and the release of glucose into the blood in situations of metabolic alterations that occur during physical training (PT) and consumption of a FAT diet [Citation6]. In situations of increased metabolism, such as high-intensity PT [Citation7,Citation8] and metabolic diseases [Citation9], the liver is subject to oxidative stress with increased lipid peroxidation and protein carbonylation, and decreased antioxidant defenses [Citation10]. PT represents a transitory physical stress that alters the metabolism and homeostasis [Citation11]. However, different levels of PT intensity (high, moderate or low) induce different adaptations in the body. In contrast to high-intensity PT, moderate-to-low-intensity training leads to increased antioxidant defenses and has a preventive and therapeutic role in major diseases associated with oxidative stress [Citation3,Citation12–17].
Studies on the effect of PT as a treatment and not as prevention of metabolic diseases are few [Citation1,Citation18], and are increasingly important because sedentary individuals have lower adherence to regular practice of PT [Citation19] and therefore have a greater chance of developing obesity and other risk factors for MS. Accordingly, our aim in the present study was to determine the benefit of low-to-moderate-intensity PT, during 6 weeks after MS was established; and the association of these PT levels with cardiovascular parameters, oxidative stress and insulin signaling in the liver.
Methods
Animals
The study used male Fischer rats, newly weaned at 4 weeks of age (rats, 40–60 g) from the Animal Science Center (CCA/UFOP) of the Federal University of Ouro Preto (UFOP, Brazil). The animals were kept in individual cages under controlled temperature (25 ± 1°C) and a 12 h–12 h light–dark cycle. Throughout the experiment, the animals had free access to water and diets. All procedures were performed in accordance with the Guidelines for Ethical Care of Experimental Animals and are approved by the Institutional Ethics Committee of the Federal University of Ouro Preto, Minas Gerais, Brazil (protocol 31/2011).
Experimental protocol
Rats, after weaning, were randomly subjected to two different diets, AIN-93M control (CT) diet or FAT diet (), for 13 weeks; and in the last 6 weeks of the diets, the animals were either subjected to low- or moderate-intensity PT by swimming, or were kept sedentary (SED). In order to confirm that the FAT diet could induce characteristic disorders of MS and that PT could be used as a treatment for MS, in week 7 of the diets, the mean arterial pressure (MAP) and heart rate (HR) were evaluated indirectly and the body weight was taken. The experimental groups used were: (1) CT-SED: rats were subjected to CT diet during a period of 13 weeks and kept SED for the last 6 weeks of the diet; (2) CT-PT: rats were subjected to CT during a period of 13 weeks and subjected to low- or moderate-intensity PT (swimming) for the last 6 weeks of the diet; (3) FAT-SED: rats were subjected to a FAT diet during a period of 13 weeks and kept SED for the last 6 weeks of the diet; and (4) FAT-PT: rats were subjected to a FAT diet during a period of 13 weeks and subjected to low- or moderate-intensity PT (swimming) for the last 6 weeks of the diet.
Table 1. Composition and energy content of diets.
Arterial pressure measurements
MAP (mmHg) and HR (beats/min) were assessed in awake rats in all groups in weeks 7 and 13 of the diets, by digital tail plethysmography (Panlab, LE5001).
PT protocol
The rats were subjected to swimming for 1 h/day, 5 days/week for 6 weeks, starting in week 7 after implementation of the diets. Swimming was performed by groups of four rats in a 38 × 60 × 50-cm tank. Water temperature was maintained at approximately 30°C, controlled by a thermostat. In session 1, the rats were subjected to 20 min, in session 2 to 40 min and beginning with session 3 the animals swam, without a workload, for 60 min. From sessions 6–8, the animals performed the PT with a load of 1% ± 0.05 g of the body mass. In sessions 9 and 10 a load of 1.5% ± 0.05 g was added; and in sessions 11–13, the load was 2% ± 0.05 g body mass. From session 14 on, a load of 2.5% ± 0.05 g body mass was added. The load consisted of a screw-nut or washer fixed on the tail of each animal. SED rats were placed in the swimming apparatus with shallow water for 60 min, 5 days/week for 6 weeks to mimic the water stress associated with the experimental protocol. The animals were decapitated 48 h after they completed the swimming protocol, in the fasted state.
Plasma analysis
At the end of the experiment, after euthanasia by instant decapitation of animals fasted overnight, blood samples (2–3 ml) were collected and treated with the anticoagulant Glistab® containing EDTA and potassium fluoride. Then, these samples were centrifuged (8,000g, 4°C, 6 min) to separate the plasma for determination of fasting glucose, or the serum for determination of the total cholesterol, albumin and transaminase alanine aminotransferase (ALT) and aspartate aminotransferase (AST) concentrations. The plasma and serum were aliquoted (−80°C) to conduct the biochemical analyses. The analyses were performed using individual commercial kits (Labtest, Lagoa Santa, MG, Brazil) according to the instructions provided by the manufacturer.
Analysis of oxidative damage in the liver
In another groups of animals, the activities of superoxide dismutase (SOD) and catalase (CAT), and the concentrations of thiobarbituric acid-reactive substances (TBARS), protein carbonyl, total glutathione (GSHt) and oxidized glutathione (GSSG) were analyzed in the liver at the end of week 13 of the experimental protocol. The left ventricle was perfused with 0.9% saline and the livers were collected, frozen in liquid nitrogen and stored at −80°C for subsequent biochemical analysis of SOD, CAT, TBARS, GSHt and GSSG.
Superoxide dismutase activity
Samples of liver (100 mg) were homogenized in phosphate buffer (pH 7.4) and centrifuged at 12 000g for 10 min at 4°C. The SOD activity was determined with an ELISA reader at 570 nm, based on the ability of this enzyme to eliminate the superoxide anion (O2−) and to convert it into hydrogen peroxide (H2O2) and thus reduce the rate of auto-oxidation of pyrogallol [Citation20]. The results were expressed as activity per milligram of protein.
Catalase activity
To assess the activity of CAT enzyme, 100 mg of each liver sample was homogenized in phosphate buffer (pH 7.4) and centrifuged at 10 000g for 10 min at 4°C. The supernatant was collected and used as the biological sample. CAT activity was measured by the rate of decrease of hydrogen peroxide (H2O2) at 240 nm. The total protein content in the samples of organ homogenates was determined using the Bradford method [Citation16,Citation21,Citation22]. The results were expressed as activity per milligram of protein.
Thiobarbituric acid-reactive substances and carbonyl protein
As an index of lipid peroxidation, we used the formation of TBARS during an acid-heating reaction [Citation16,Citation23]. Liver samples (100 mg) were homogenized in KPE (potassium phosphate–EDTA) buffer (pH 7.4) and centrifuged (10 000g, 10 min, at 4°C). The supernatant was then collected and used as the biological sample. Briefly, the samples from homogenates were mixed with 1 ml of 10% trichloroacetic acid and 1 ml of 0.67% thiobarbituric acid and then heated in a boiling water bath for 30 min. TBARS were determined from the absorbance at 532 nm. The content of carbonyl protein was determined according to the method of Levine et al. [Citation24]. The absorbance of the supernatant was determined at 370 nm. Both series of data are expressed in nmol/mg of protein.
Reduced and oxidized glutathione
Glutathione is present in cells mainly in its reduced form (GSH, nmol/ml), comprising around 90%, and the remainder appears in the form of GSSG (nmol/ml). This assay was adapted from a Sigma CS0260 kit based on the studies by Akerboom and Sies [Citation25], and used a kinetic method to measure the GSHt (GSH+GSSG) in biological samples by reducing the 5,5′-dithio-bis-(2-nitrobenzoic acid) to 5-thio-2-nitrobenzoic acid (TNB), which was measured kinetically in a microplate reader at 412 nm (Biotek ELx808 St. Winooski, USA). For derivatization, 4-vinylpyridine (Sigma-Aldrich, St. Louis, USA) was added to the biological samples and a GSSG assay was performed using the same assay kit. The data for the GSH content were obtained by subtracting the GSSG content from the GSHt content [Citation26].
mRNA expression of the insulin signaling pathway in the liver
The real-time reverse transcription polymerase chain reaction (qRT-PCR) was performed on livers from the different groups of rats. For quantitative analysis of mRNA expression, the liver was rapidly removed, placed in liquid nitrogen and stored at −80°C until processed. The total RNA from liver was isolated with TRI reagent® (Sigma-Aldrich) according to the manufacturer’s protocol. All RNA isolated was quantified by spectrophotometry, and the optical density was estimated from the 260/280 nm absorbance ratio. A reverse transcriptase reaction was performed using a SuperScript™ III (Invitrogen Life Technologies) for the first-strand cDNA synthesis. A real-time PCR was carried out following the generation of first-strand cDNA. A PCR for each sample was carried out in triplicate for all cDNAs and for the 18s ribosomal control. Insulin receptor (IR) and substrate IR 1 (IRS-1), glucose transporter type 4 (GLUT4), serine/threonine kinase 2 (AKT-2), peroxisome proliferator-activated receptor gamma (PPARγ) and the endogenous 18s ribosomal cDNA were amplified using specific primers () and SYBR® Green PCR Master Mix (Applied Biosystems, Rockford, USA). The analyses were performed by a relative method of quantifying gene expression (comparative Cq, ΔCq), which allows one to quantify differences among samples in the level of expression of a specific target. The expression levels were normalized for the amount of the reference gene (18S rRNA) on each plate. The results were obtained with the formula that considers the amount of the target gene normalized to the calibrator gene, given by (2–ΔCq).
Table 2. Rat Genome Database (RGD) accession numbers and primer sequences of genes selected for qRT-PCR.
Histological analyses
For histopathological analysis, fragments of approximately 1.0 × 1.0 × 0.2 cm of liver were fixed in 10% formalin. After 72 h of fixation, the fragments were dehydrated, cleared and embedded in paraffin. Paraffin blocks were cut into 4 μm-thick sections and stained with hematoxylin and eosin for assessment of architectural damage and inflammation (optical microscopy). Using optical microscopy the presence or absence of micro- and macrovesicular non-alcoholic fatty liver disease, necrosis, inflammation and fibrosis areas was observed in the liver tissue. Representative photomicrographs were obtained with a Leica BM5000 microscope coupled to a Leica DFC 300 FX camera in RGB mode, using a 40× magnification objective.
Statistical analysis
The results are expressed as means ± SEM. The data were analyzed for Kolmogorov–Smirnov normality and followed the standard normal distribution; they were subsequently assessed by two-way ANOVA, followed by the Bonferroni post-test. Statistical analyses were performed with the software GraphPad Prism (version 6.0, San Diego, USA). The criterion for statistical significance was set at P< 0.05.
Results
Evaluation of BP, HR, body and liver masses
In week 7 of the diets, the FAT group had higher values of MAP (134 ± 2.4 mmHg, n = 8), HR (454 ± 8.5 beats/min, n = 8) and body mass (276 ± 4.6 g, n = 8) compared to the CT group (119 ± 6.2 mmHg, 367 ± 12.5 beats/min, 193 ± 6.1 g, n = 8; respectively). These data were used as characteristics of MS disorders induced by the FAT diet, and based on these results the animals were submitted to PT as the treatment or kept SED for another 6 weeks.
The indirect evaluation, by tail plethysmography, performed at week 13 of the diets revealed that the FAT-SED animals showed high levels of MAP and HR compared to CT-SED animals. Furthermore, the FAT-SED animals showed increases in body mass and in the mass of retroperitoneal fat deposits compared to the CT-SED group. The FAT-PT group had a similar body mass to CT-SED animals. The FAT-PT group had decreased retroperitoneal fat deposits compared to FAT-SED animals. However, no difference was observed in liver mass among all experimental groups. The blood lactate concentration in the FAT-SED animals was higher than in CT-SED animals. However, in the FAT-PT rats the lactate concentration was lower than in FAT-SED rats, and was similar to that in CT-SED rats ().
Table 3. Biometric, biochemical and cardiovascular parameters of rats fed a control diet (CT) or a high-fat diet (FAT), and submitted to physical training (PT) or kept sedentary (SED).
Plasma analysis
The biochemical analyses performed in week 13 of the diets showed that FAT-SED rats had increases in the concentrations of fasting glucose, insulin and total cholesterol compared to the CT-SED group. The FAT-PT rats showed an increase in ALT concentration compared to the CT-SED rats, and a similar concentration to the FAT-SED rats. However, the concentrations of insulin, total cholesterol and glucose in the FAT-PT rats were similar to those in the CT-SED and FAT-SED rats ().
Evaluation of oxidative stress in the liver
The FAT-SED rats showed an increase in oxidative stress in the liver, as indicated by the increased concentration of TBARS (1.28 ± 0.07 nmol/mg of protein, n = 7) and carbonyl protein (6.13 ± 1.35 nmol/mg of protein, n = 5). In addition, although an increase was observed in SOD activity (2.60 ± 0.2 U/mg of protein, n = 6), there was a reduction in CAT activity (0.77 ± 0.10 U/mg of protein, n = 10) compared to CT-SED animals (TBARS = 0.789 ± 0.02 nmol/mg of protein, n = 6; carbonyl protein = 3.24 ± 0.31 nmol/mg of protein, n = 6; SOD = 1.40 ± 0.04 U/mg of protein, n = 5 and CAT = 2.20 ± 0.33 U/mg of protein, n = 9). The FAT-SED rats showed an increase in GSSG concentration (19.83 ± 3.78 nmol/ml, n = 7) and a reduction in the GSH/GSSG ratio (3.43 ± 0.85, n = 5) compared to the CT-SED group (GSSG = 8.50 ± 1.58 nmol/ml, n = 8; GSH/GSSG = 9.81 ± 1.09, n = 5) ( and ). However, PT was efficient in reducing oxidative stress, as shown by the reduction in the concentrations of TBARS (1.04 ± 0.06 nmol/mg of protein, n = 5) and carbonyl protein (2.50 ± 0.33 nmol/mg of protein, n = 6) and the increase in CAT activity (1.60 ± 0.13 U/mg of protein, n = 13) in FAT-PT rats compared to CT-SED animals. However, the SOD activity in the FAT-PT group was higher (2.50 ± 0.34 U/mg of protein, n = 6) compared to CT-SED (1.40 ± 0.04 U/mg of protein, n = 5) and it was similar to FAT-SED rats (2.60 ± 0.23 U/mg of protein, n = 6) (). In addition, in FAT-PT rats, the GSSG was reduced (9.40 ± 2.73 nmol/ml, n = 12) compared to FAT-SED rats (19.83 ± 3.78 nmol/ml, n = 7), and it was similar to CT-SED rats (8.50 ± 1.58 nmol/ml, n = 8). The GSH concentration was similar in all groups ().
Figure 1. (A) Activity of enzyme superoxide dismutase (SOD, U/mg protein; n = 5–6), (B) activity of the enzyme catalase (CAT, U/mg protein, n = 9–13), (C) reduced glutathione (GSH, nmol/ml, n = 5–11), (D) oxidized glutathione (GSSG, nmol/ml, n = 7–12) and (E) GSH/GSSG ratio (n = 5–9) in liver of rats fed a high-fat diet (30% fat, FAT) or a control diet (AIN-93, CT) for 13 weeks and submitted to physical training (PT), or maintained sedentary (SED) during the last 6 weeks of the diet. *P < 0.05 compared to CT-SED group. #P < 0.05 compared to FAT-SED group (two-way ANOVA followed by Bonferroni post-test).
Figure 2. (A) Concentrations of malondialdehyde (MDA, U/mg of protein; n = 5–10) by concentrations of thiobarbituric acid-reactive substances (TBARS) method and (B) carbonyl proteins (nmol/mg of protein, n = 6) in the liver of rats fed a high-fat diet (30% fat, FAT) or a control diet (AIN-93, CT) for 13 weeks and submitted to physical training (PT) or maintained sedentary (SED) during the last 6 weeks of the diet. *P < 0.05 compared to CT-SED group. #P < 0.05 compared to FAT-SED group (two-way ANOVA followed by Bonferroni post-test).
mRNA expression of the insulin signaling pathway in the liver
The mRNA expressions of AKT-2 (0.001 ± 3.348e-004 UA, n = 4) and IRS-1 (0.001 ± 2.359e-004 UA, n = 4) in FAT-SED rats were reduced compared to the CT-SED group (0.005 ± 0.001 UA, n = 4 and 0.003 ± 0.001 UA, n = 3, respectively) (); however, the expressions were similar in FAT-PT (0.003 ± 0.0003 UA, n = 4 and 0.002 ± 0.0002 UA, n = 4, respectively) and CT-SED animals. The mRNA expressions of PPARγ (0.0002 ± 0.000043 UA, n = 4) and IR (0.002 ± 0.0003 UA, n = 4) in the FAT-PT rats were increased compared to FAT-SED rats (3.9333e-005 ± 0.00002 UA, n = 3 and 0.001 ± 0.0003 UA, n = 4; respectively). There were no differences in the mRNA expression of GLUT-4 among all groups ().
Figure 3. Evaluation of gene expression (U.A.) of insulin signaling pathway mediators (n = 3–4) and peroxisome proliferator-activated receptor gamma (PPARγ, n = 4) in the liver of rats fed a high-fat diet (30% fat, FAT) or a control diet (AIN-93, CT) for 13 weeks and submitted to physical training (PT) or maintained sedentary (SED) during the last 6 weeks of the diet. (A) Insulin receptor (IR), (B) Insulin receptor substrate 1 (IRS-1), (C) Insulin receptor substrate 2 (IRS-2) (D) serine/threonine kinase 2 (AKT-2), (E) glucose transporter type 4 (GLUT4), (F) peroxisome proliferator-activated receptor gamma (PPARγ). *P < 0.05 compared to CT-SED group. #P < 0.05 compared to FAT-SED group (two-way ANOVA followed by Bonferroni post-test).
Histological analyses
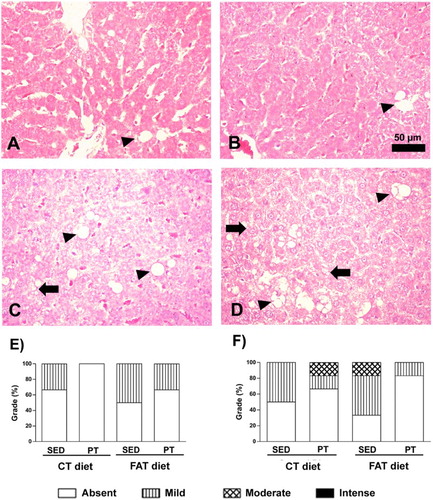
The hepatic histology revealed that the FAT-SED rats showed macrovesicular steatosis with 50% of the hepatocytes with a mild grade; while the FAT-PT rats showed a lower percentage, with 33% mild hepatocytes. With respect to microvesicular steatosis, the FAT-SED animals showed 50% of the hepatocytes with a mild grade and 16.6% of the hepatocytes with a moderate grade; while the FAT-PT rats showed only 16% of the hepatocytes with a mild grade (). The number of inflammatory cells did not differ among the experimental groups.
Figure 4. Photomicrographs of liver stained with hematoxylin and eosin (HE). Arrow indicates microvesicular steatosis, and arrowhead indicates macrovesicular steatosis. (A) Rat fed with a control (CT) diet and maintained sedentary (SED). (B) Rat submitted to a control (CT) diet and physical training (PT). (C) Rat submitted to a high-fat (FAT) diet and maintained sedentary (SED). (D) Rat submitted to a high-fat (FAT) diet and physical training (PT). Magnification 440×. Bar = 50 μ. Qualitative evaluation of macrovesicular steatosis (E) and microvesicular steatosis (F) in liver tissue, using a grade from absent to mild, moderate or intense.
Discussion
This study demonstrated the effectiveness of PT in inducing beneficial adaptive responses in rats with MS induced by a FAT diet. The adaptive responses induced by PT in MS rats included improvement of the oxidative balance and of the insulin signaling pathway in the liver, restoring biometric and biochemical parameters and blood pressure.
Epidemiological studies show that the consumption of FAT diets (≥30% of energy from fat) is correlated with high rates of overweight, central obesity and MS [Citation27,Citation28]. In a previous study [Citation29] we showed that the FAT diet led to increases in blood pressure and HR, in mesenteric, retroperitoneal and epididymal fat deposits, fasting glucose, ALT, AST and total cholesterol, and induced hepatic steatosis and renal inflammatory infiltrates. The data from the present study are consistent with our prior study and with other studies [Citation27,Citation28] and show that the rats submitted to the FAT diet for 13 weeks and kept SED, also showed lower physical fitness due to high blood concentrations of lactate [Citation13,Citation30] and total cholesterol, glucose, insulin and ALT; and increases in the body mass and retroperitoneal fat. Additionally, the FAT-SED rats showed micro- and macro-steatosis, reduction of CAT activity, increased concentrations of TBARS, GSSG, protein carbonyl and the GSH/GSSG ratio, and reduced gene expression of IRS-1 and AKT-2 in the liver, in addition to increases in MAP and HR.
Several studies [Citation31,Citation32] showed that low-to-moderate PT intensity is effective in inducing benefits by preventing the establishment of MS. In these studies [Citation31,Citation32] PT began with the start of the diet for development of MS. Few studies [Citation1,Citation18] have evaluated PT as a treatment of already established MS. These studies show that PT induces a reduction in systolic blood pressure, together with increased sensitivity to insulin and in the gene expression of GLUT4 in white adipose tissue and gastrocnemius muscle [Citation1], and reduces retroperitoneal and epididymal fat [Citation18,Citation33]. In our present study, PT should be considered a treatment because it started in the last 6 weeks of the diets, and therefore with an already established MS disorder, as shown through the increased MAP, HR and body mass of the rats.
Different lines of evidence suggest that regular PT induces beneficial adaptations in diseases associated with oxidative stress, including high blood pressure, type II diabetes and Alzheimer’s disease [Citation3,Citation16,Citation17]. In previous studies we found that rats with renovascular hypertension (2K1C) submitted to swimming training showed reversal of altered cardiovascular parameters, reduced collagen deposition in the myocardium and the kidneys, reduced TBARS concentration in the left ventricle, and increased CAT activity in the left ventricle and kidney [Citation16]. In the present study, PT improved the physical fitness of rats with MS, as shown by the decrease in the blood concentration of lactate and in the HR. Reductions in these parameters have been recognized as markers of physical fitness [Citation13,Citation30,Citation34].
The liver plays an important role in the adaptive response to oxidative stress induced by PT. A balance between ROS and their detoxification by antioxidant enzymes is essential to prevent oxidative damage. Low to moderate PT intensity has been considered an effective non-pharmacological treatment to upregulate the expression and activity of antioxidant enzymes in various tissues and metabolic disorders [Citation35], besides improving insulin sensitivity and hepatic steatosis [Citation36]. This adaptation to exercise training in the redox balance within the liver is most likely because aerobic exercise induces a transient production of ROS in the liver [Citation6] and consequently also induces a resistance oxidative stress response, protecting the liver from certain toxic effects of increased ROS generation [Citation37,Citation38]. Additionally, hepatic CAT and glutathione peroxidase, responsible for a considerable H2O2 scavenging capacity, are also altered in the liver in situations of metabolic alterations such as diabetes, MS [Citation39] and PT [Citation38]. Additionally, the present data showed that the SOD activity was increased in SED and PT rats submitted to the FAT diet, suggesting considerable formation of H2O2 in the liver of these animals. However, in FAT-SED rats, this increase in SOD activity was not accompanied by an increase in CAT activity. In fact, the CAT activity was reduced, as the GSH/ GSSG ratio and the GSSG were increased in these rats, leading to oxidative damage as evidenced by lipid peroxidation, as shown by the high concentrations of TBARS and protein carboxylation. However, PT in rats with MS was effective in preventing oxidative damage. These FAT-PT rats also showed increases in the SOD and CAT activities and the GSH/GSSG ratio, and reductions in the concentrations of TBARS and protein carboxylation. Our data accord with the results of Botezelli et al. [Citation37] and Lima et al. [Citation6], who found that Wistar rats submitted to swimming training for 6–8 weeks showed decreased lipid peroxidation, which they attributed partly to an improved antioxidant system due to increase of SOD activity. Navarro et al. [Citation40] also reported that chronic moderate exercise increases mitochondrial manganese-superoxide dismutase activity and decreases oxidation products (TBARS and protein carbonylation) in the liver of exercised rats. Sun et al. [Citation41] showed in rats submitted to 4 weeks of resistance training that the GSH concentrations in liver mitochondria increased, suggesting increased antioxidant activity. These previous findings, together with our present findings, suggest a clear adjustment of the liver, acting as an important antioxidant system after swimming training. The design of the present study does not allow us to determine whether the activities of SOD, CAT and glutathione were of cytosolic or of mitochondrial origin, because we evaluated only the total activity of these compounds.
Interdependence between oxidative stress and insulin resistance can arise from a sequence of mutually reinforcing pathophysiological mechanisms. The continued generation of ROS can decrease insulin action through the activation of serine–threonine kinase cascades which, in turn, phosphorylate various targets, including the IR, IRS1 and IRS2, with a consequent reduction in tyrosine phosphorylation of insulin [Citation5]. In addition, PPARγ is strongly expressed in tissues rich in mitochondria, and appears to be involved in regulating lipid metabolism, in modulating CAT and manganese-superoxide dismutase antioxidant enzymes [Citation42], and in increasing insulin sensitivity in the liver and other tissues [Citation43]. Data from the present study are in agreement with the studies cited above [Citation42] and showed that animals with MS (FAT-SED) increased retroperitoneal fat, ALT, macro- and micro-steatosis in the liver, increased oxidative stress concomitant with an impaired insulin signaling pathway, as shown by the reduced mRNA expression of IRS1 and AKT-2. On the other hand, the animals with MS that were subject to PT (FAT-PT) showed increased expression of PPARγ and IR, IRS-1 and AKT-2, to similar levels as those in CT-SED rats, and probably restoring glucose uptake. Although some studies [Citation44,Citation45] have reported GLUT4 expression in the liver, GLUT2 expression is more strongly related to the liver [Citation46] and may explain the present data, which did not indicate differences in GLUT4 expression among the groups.
In summary, the present study showed that PT was effective in improving physical fitness and acting as a treatment by normalizing fasting glucose, insulin and total cholesterol concentrations, MAP and HR in the animals with MS. In these animals, swimming induced positive adaptations in the liver of rats submitted to the FAT diet, characterized by inducing increasing activity of CAT, SOD, the GSH/GSSG ratio, lowering the concentrations of TBARS and carbonylated proteins, reversing the RNA expressions of PPARγ and the components of the intracellular signaling insulin pathway (IR, IRS-1 and AKT-2), and probably restoring glucose uptake in the liver.
Ethics approval
The protocol was approved by the Animal Ethics Committee of the Federal University of Ouro Preto, Protocol No. 2011/31.
Acknowledgements
The authors are grateful for support from the Center of Animal Science (CCA–UFOP), Laboratory of Biochemistry and Molecular Biology, and Laboratory of Experimental Physiology.
Disclosure statement
No potential conflict of interest was reported by the authors.
ORCID
Aline Cruz Zacarias http://orcid.org/0000-0002-2574-1775
Andréia Carvalho Alzamora http://orcid.org/0000-0001-5543-2140
Additional information
Funding
References
- Caponi PW, Lehnen AM, Pinto GH, et al. Aerobic exercise training induces metabolic benefits in rats with metabolic syndrome independent of dietary changes. Clinics. 2013;68(7):1010–1017. doi: 10.6061/clinics/2013(07)20
- Salonen MK, Wasenius N, Kajantie E, et al. Physical activity, body composition and metabolic syndrome in young adults. PLoS ONE. 2015;10(5):e0126737. doi: 10.1371/journal.pone.0126737
- Lazarevic G, Antic S, Cvetkovic T, et al. A physical activity programme and its effects on insulin resistance and oxidative defense in obese male patients with type 2 diabetes mellitus. Diabetes Metab. 2006;32(6):583–590. doi: 10.1016/S1262-3636(07)70312-9
- Hwang YC, Hayashi T, Fujimoto WY, et al. Visceral abdominal fat accumulation predicts the conversion of metabolically healthy obese subjects to an unhealthy phenotype. Int J Obes (Lond). 2015;39(9):1365–1370. doi: 10.1038/ijo.2015.75
- Evans JL, Maddux BA, Goldfine ID. The molecular basis for oxidative stress-induced insulin resistance. Antioxid Redox Signal. 2005;7(7-8):1040–1052. doi: 10.1089/ars.2005.7.1040
- Lima FD, Stamm DN, Della-Pace ID, et al. Swimming training induces liver mitochondrial adaptations to oxidative stress in rats submitted to repeated exhaustive swimming bouts. PLoS ONE. 2013;8(2):e55668. doi: 10.1371/journal.pone.0055668
- Korivi M, Hou CW, Huang CY, et al. Ginsenoside-Rg1 protects the liver against exhaustive exercise-induced oxidative stress in rats. Evid Based Complement Alternat Med. 2012;2012:932165. doi: 10.1155/2012/932165
- Liu J, Yeo HC, Overvik-Douki E, et al. Chronically and acutely exercised rats: biomarkers of oxidative stress and endogenous antioxidants. J Appl Physiol (1985). 2000;89(1):21–28.
- Brandt C, Pedersen BK. The role of exercise-induced myokines in muscle homeostasis and the defense against chronic diseases. J Biomed Biotechnol. 2010;2010:520258. doi: 10.1155/2010/520258
- Liu Y, Liu SX, Cai Y, et al. Effects of combined aerobic and resistance training on the glycolipid metabolism and inflammation levels in type 2 diabetes mellitus. J Phys Ther Sci. 2015;27(7):2365–2371. doi: 10.1589/jpts.27.2365
- Mastorakos G, Pavlatou M. Exercise as a stress model and the interplay between the hypothalamus-pituitary-adrenal and the hypothalamus-pituitary-thyroid axes. Horm Metab Res. 2005;37(9):577–584. doi: 10.1055/s-2005-870426
- Kiraly MA, Kiraly SJ. The effect of exercise on hippocampal integrity: review of recent research. Int J Psychiatry Med. 2005;35(1):75–89. doi: 10.2190/HX7L-4B40-PQNY-2A4P
- Soares ER, Lima WG, Machado RP, et al. Cardiac and renal effects induced by different exercise workloads in renovascular hypertensive rats. Braz J Med Biol Res. 2011;44(6):573–582. doi: 10.1590/S0100-879X2011007500049
- de Farias JM, Bom KF, Tromm CB, et al. Effect of physical training on the adipose tissue of diet-induced obesity mice: interaction between reactive oxygen species and lipolysis. Horm Metab Res. 2013;45(3):190–196.
- Vuković R, Blažetić S, Oršolić I, et al. Impact of ovariectomy, high fat diet, and lifestyle modifications on oxidative/antioxidative status in the rat liver. Croat Med J. 2014;55(3):218–227. doi: 10.3325/cmj.2014.55.218
- Maia RC, Sousa LE, Santos RA, et al. Time-course effects of aerobic exercise training on cardiovascular and renal parameters in 2K1C renovascular hypertensive rats. Braz J Med Biol Res. 2015;48(11):1010–1022. doi: 10.1590/1414-431X20154499
- Sousa LE, Magalhães WG, Bezerra FS, et al. Exercise training restores oxidative stress and nitric oxide synthases in the rostral ventrolateral medulla of renovascular hypertensive rats. Free Radic Res. 2015;49(11):1335–1343. doi: 10.3109/10715762.2015.1069291
- Machado MV, Vieira AB, Nascimento AR, et al. Physical exercise restores microvascular function in obese rats with metabolic syndrome. Metab Syndr Relat Disord. 2014;12(9):484–492. doi: 10.1089/met.2014.0040
- Dalle Grave R, Calugi S, Centis E, et al. Cognitive-behavioral strategies to increase the adherence to exercise in the management of obesity. J Obes. 2011;2011:348293. doi: 10.1155/2011/348293
- Dieterich S, Bieligk U, Beulich K, et al. Gene expression of antioxidative enzymes in the human heart: increased expression of catalase in the end-stage failing heart. Circulation. 2000;101(1):33–39. doi: 10.1161/01.CIR.101.1.33
- Aebi H. Catalase in vitro. Methods Enzymol. 1984;105:121–126. doi: 10.1016/S0076-6879(84)05016-3
- Bradford MM. A rapid and sensitive method for the quantitation of microgram quantities of protein utilizing the principle of protein-dye binding. Anal Biochem. 1976;72:248–254. doi: 10.1016/0003-2697(76)90527-3
- Draper HH, Squires EJ, Mahmoodi H, et al. A comparative evaluation of thiobarbituric acid methods for the determination of malondialdehyde in biological materials. Free Radic Biol Med. 1993;15(4):353–363. doi: 10.1016/0891-5849(93)90035-S
- Levine RL, Garland D, Oliver CN, et al. Determination of carbonyl content in oxidatively modified proteins. Methods Enzymol. 1990;186:464–478. doi: 10.1016/0076-6879(90)86141-H
- Akerboom TP, Sies H. Assay of glutathione, glutathione disulfide, and glutathione mixed disulfides in biological samples. Methods Enzymol. 1981;77:373–382. doi: 10.1016/S0076-6879(81)77050-2
- Bandeira AC, da Silva RC, Rossoni JV, et al. Lycopene pretreatment improves hepatotoxicity induced by acetaminophen in C57BL/6 mice. Bioorg Med Chem. 2017;25(3):1057–1065. doi: 10.1016/j.bmc.2016.12.018
- George V, Tremblay A, Després JP, et al. Effect of dietary fat content on total and regional adiposity in men and women. Int J Obes. 1990;14(12):1085–1094.
- Tucker LA, Kano MJ. Dietary fat and body fat: a multivariate study of 205 adult females. Am J Clin Nutr. 1992;56(4):616–622.
- de Castro UG, dos Santos RA, Silva ME, et al. Age-dependent effect of high-fructose and high-fat diets on lipid metabolism and lipid accumulation in liver and kidney of rats. Lipids Health Dis. 2013;12:136. doi: 10.1186/1476-511X-12-136
- Voltarelli FA, Gobatto CA, de Mello MA. Determination of anaerobic threshold in rats using the lactate minimum test. Braz J Med Biol Res. 2002;35(11):1389–1394. doi: 10.1590/S0100-879X2002001100018
- Morvan E, Lima NE, Machi JF, et al. Metabolic, hemodynamic and structural adjustments to low intensity exercise training in a metabolic syndrome model. Cardiovasc Diabetol. 2013;12:89. doi: 10.1186/1475-2840-12-89
- Mostarda C, Moraes-Silva IC, Salemi VM, et al. Exercise training prevents diastolic dysfunction induced by metabolic syndrome in rats. Clinics (São Paulo). 2012;67(7):815–820. doi: 10.6061/clinics/2012(07)18
- Marcinko K, Sikkema SR, Samaan MC, et al. High intensity interval training improves liver and adipose tissue insulin sensitivity. Mol Metab. 2015;4(12):903–915. doi: 10.1016/j.molmet.2015.09.006
- Rodrigues MC, Campagnole-Santos MJ, Machado RP, et al. Evidence for a role of AT2 receptors at the CVLM in the cardiovascular changes induced by low-intensity physical activity in renovascular hypertensive rats. Peptides. 2007;28(7):1375–1382. doi: 10.1016/j.peptides.2007.06.001
- Golbidi S, Badran M, Laher I. Antioxidant and anti-inflammatory effects of exercise in diabetic patients. Exp Diabetes Res. 2012;2012:941868. doi: 10.1155/2012/941868
- Johnson NA, George J. Fitness versus fatness: moving beyond weight loss in nonalcoholic fatty liver disease. Hepatology. 2010;52(1):370–380. doi: 10.1002/hep.23711
- Botezelli JD, Cambri LT, Ghezzi AC, et al. Different exercise protocols improve metabolic syndrome markers, tissue triglycerides content and antioxidant status in rats. Diabetol Metab Syndr. 2011;3:35. doi: 10.1186/1758-5996-3-35
- Wilson DO, Johnson P. Exercise modulates antioxidant enzyme gene expression in rat myocardium and liver. J Appl Physiol (1985). 2000;88(5):1791–1796.
- Sanders RA, Rauscher FM, Watkins JB. Effects of quercetin on antioxidant defense in streptozotocin-induced diabetic rats. J Biochem Mol Toxicol. 2001;15(3):143–149. doi: 10.1002/jbt.11
- Navarro A, Gomez C, López-Cepero JM, et al. Beneficial effects of moderate exercise on mice aging: survival, behavior, oxidative stress, and mitochondrial electron transfer. Am J Physiol Regul Integr Comp Physiol. 2004;286(3):R505–R511. doi: 10.1152/ajpregu.00208.2003
- Sun L, Shen W, Liu Z, et al. Endurance exercise causes mitochondrial and oxidative stress in rat liver: effects of a combination of mitochondrial targeting nutrients. Life Sci. 2010;86(1-2):39–44. doi: 10.1016/j.lfs.2009.11.003
- Okuno Y, Matsuda M, Miyata Y, et al. Human catalase gene is regulated by peroxisome proliferator activated receptor-gamma through a response element distinct from that of mouse. Endocr J. 2010;57(4):303–309. doi: 10.1507/endocrj.K09E-113
- Luquet S, Gaudel C, Holst D, et al. Roles of PPAR delta in lipid absorption and metabolism: a new target for the treatment of type 2 diabetes. Biochim Biophys Acta. 2005;1740(2):313–317. doi: 10.1016/j.bbadis.2004.11.011
- Jin J, Wang GL, Iakova P, et al. Epigenetic changes play critical role in age-associated dysfunctions of the liver. Aging Cell. 2010;9(5):895–910. doi: 10.1111/j.1474-9726.2010.00617.x
- Karim S, Buzzard GT, Umulis DM. Efficient calculation of steady state probability distribution for stochastic biochemical reaction network. BMC Genomics. 2012;13(Suppl 6):S10.
- Tsuda M, Kitasawa E, Ida H, et al. A newly recognized missense mutation in the GLUT2 gene in a patient with Fanconi-Bickel syndrome. Eur J Pediatr. 2000;159(11):867. doi: 10.1007/s004310000600
- Reeves PG, Nielsen FH, Fahey GC. AIN-93 purified diets for laboratory rodents: final report of the American Institute of Nutrition ad hoc writing committee on the reformulation of the AIN-76A rodent diet. J Nutr. 1993;123(11):1939–1951.