
ABSTRACT
Nicotinamide adenine dinucleotide (NAD+/NADH) along with its phosphorylated form (NADP+/NADPH) are two molecules ubiquitously present in all organisms, and they play key roles as cofactors in fundamental catabolic and anabolic processes, respectively. The oxidation of NADPH to NADP+ initiates a cascade of reactions, where a network of molecules is implicated. The molecules of this cascade form a network with eminent translational potential in redox metabolism. A special point of interest is that spectrophotometric assays have been developed both for NADH/NADPH and the molecules directly regulated by them. Therefore, crucial molecules of the NADPH-dependent redox network can be measured, and the results can be used to assess the bioenergetic and/or oxidative stress status. The main aim of this review is to collectively present the NADPH-related molecules, namely NADPH, NADH, NAD+ kinase, NADPH oxidase, peroxiredoxin, thioredoxin, thioredoxin reductase, and nitric oxide synthase, that can be measured in blood and tissues with the use of a spectrophotometer, which is probably the most simple, inexpensive and widely used tool in biochemistry. We are providing the researchers with reliable and valid spectrophotometric assays for the measurement of the most important biomarkers of the NADPH network in blood and other tissues, thus allowing the opportunity to follow the redox changes in response to a stimulus.
Introduction
Nicotinamide adenine dinucleotide (NAD+/NADH) along with its phosphorylated form (NADP+/NADPH) are two molecules ubiquitously present in all organisms, and they play key roles as cofactors in fundamental catabolic and anabolic processes, respectively [Citation1]. In particular, they are involved in cellular metabolism, numerous signalling pathways and regulatory processes [Citation2–4]. The most well-documented NAD+/NADP+ functions are detoxification (via the reduction of cytochrome P450), reductive biosynthesis (mainly of fatty acids and amino acids), cellular signalling (via covalent modification of target molecules or through Ca2+-related pathways), host immune defence (as a substrate for the NADPH oxidases of macrophages), gene expression and DNA repair [Citation1,Citation5–7]. Both forms are equally important for cell survival [Citation8], and therefore, organisms strictly maintain the intra- and extra-cellular NAD+/NADP+ pools as well as firmly control their subcellular distribution [Citation5]. Interestingly, the activity and topology of NAD+ kinase, the enzyme responsible for the phosphorylation of NAD+ and NADH, are also strictly controlled by organisms [Citation4]. The expanded roles of NAD+ and NADP+ along with the findings that higher NAD+ levels are necessary for lifespan extension [Citation9] have led to the idea of using NAD+-boosters (typically, NAD+ precursor molecules) as therapeutic agents for improving cellular bioenergetics during pathological conditions, such as cancer and diabetes. Nevertheless, a recent study of our group challenged this notion since nicotinamide riboside (NR), a NAD+ precursor, decreased exercise performance in rats [Citation10].
Many NAD+ and NADP+ functions have an important impact on redox biology. Particularly, the reduced form of NADP+ (i.e. NADPH) plays a vital role in the functions of three antioxidant enzymes, namely peroxiredoxins, glutathione peroxidases (GPxs), and catalase. More specifically, NADPH provides the necessary equivalents for the reduction of peroxiredoxins and GPxs through the thioredoxin/thioredoxin reductase (TrxR) and glutathione/glutathione reductase (GR) systems, respectively [Citation11], while concomitantly it also protects catalase from hydrogen peroxide-induced inactivation [Citation12]. Considering that the three aforementioned enzymes are responsible for the intracellular fate of hydrogen peroxide (H2O2) and that this particular reactive oxygen species is currently regarded as the dominant signalling molecule [Citation13], it can be reasonably supposed that NADPH levels regulate redox signalling.
The oxidation of NADH to form NAD+ initializes a cascade of reactions, where a network of molecules is implicated as described in . Two of the most studied routes leading to NAD+ synthesis are depicted here. The first biosynthetic pathway involves two steps, the first being the phosphorylation of nicotinamide (Nam) to nicotinamide mononucleotide (NMN) catalysed by the enzyme nicotinamide phosphoribosyl transferase (NamPRT) and the second is the NMN adenylylation to NAD+ by the enzyme NMN adenylyl transferase (NMNAT), which uses ATP as the adenyl donor. The second biosynthetic route of NAD+ starts from the precursor of vitamin B3, NR, followed by its phosphorylation to NMN by the ATP-dependent NR kinase and adenylylation of the formed NMN to NAD+ by NMNAT [Citation14]. NAD+ is sequentially phosphorylated by NAD+ kinase and converted to NADP+, while NAD+ and NADP+ can both be reduced generating NADH and NADPH, respectively. NADPH oxidation is the reaction that substantiates the central role of this molecule in fundamental redox and metabolic pathways. describes three major redox pathways initiated by the reduction of three enzymes, namely nitric oxide synthase (NOS), TrxR and GR, with the concomitant oxidation of NADPH. NADPH is the necessary electron donor to NOS, which generates nitric oxide (NO•). NADPH oxidation provides the electrons for the formation of the active reduced form of TrxR from the inactive oxidized form of TrxR. Thus, it can reduce (activate) peroxiredoxin in order to neutralize peroxides and promote the sulfiredoxin-induced reduction of peroxiredoxin from its inactive over-oxidized state. Regarding the reduced form of GR, NADPH oxidation also assists its transformation to the reduced state providing cells with a high reductive potential. Indeed, GR induces the reduction of glutathione disulphide (GSSG) back to glutathione (GSH), which in turn activates GPx, an important antioxidant enzyme [Citation15].
Figure 1. The NADPH-related redox network. The black boxes indicate the biomarker protocols presented in this paper, and the grey boxes indicate the biomarker protocols presented in Veskoukis et al. [Citation15]. NADH: nicotinamide adenine dinucleotide reduced, NAD+: nicotinamide adenine dinucleotide oxidized, NADPH: nicotinamide adenine dinucleotide phosphate reduced, NADP+: nicotinamide adenine dinucleotide phosphate oxidized, NR: nicotinamide riboside, NR kinase: nicotinamide riboside kinase, NMN: nicotinamide mononucleotide, NamPRT: nicotinamide phosphoribosyl transferase, Nam: nicotinamide, NMNAT: nicotinamide mononucleotide adenylyl transferase, GRred: reduced form of glutathione reductase, GRox: oxidized form of glutathione reductase, GPxred: reduced form of glutathione peroxidase, GPxox: oxidized form of glutathione peroxidase, GST: glutathione transferase, CAT: catalase, SOD: superoxide dismutase, GSH: reduced glutathione, GSSG: glutathione disulphide, Prxred: reduced form of peroxiredoxin, Prxox: oxidized form of peroxiredoxin, Prxoverx: over-oxidized form of peroxiredoxin, Trxred: reduced form of thioredoxin, Trxox: oxidized form of thioredoxin, TrxRred: reduced form of thioredoxin reductase, TrxRox: oxidized form of thioredoxin reductase, Srx: sulfiredoxin, NO•: nitric oxide, NOS: nitric oxide synthase.
![Figure 1. The NADPH-related redox network. The black boxes indicate the biomarker protocols presented in this paper, and the grey boxes indicate the biomarker protocols presented in Veskoukis et al. [Citation15]. NADH: nicotinamide adenine dinucleotide reduced, NAD+: nicotinamide adenine dinucleotide oxidized, NADPH: nicotinamide adenine dinucleotide phosphate reduced, NADP+: nicotinamide adenine dinucleotide phosphate oxidized, NR: nicotinamide riboside, NR kinase: nicotinamide riboside kinase, NMN: nicotinamide mononucleotide, NamPRT: nicotinamide phosphoribosyl transferase, Nam: nicotinamide, NMNAT: nicotinamide mononucleotide adenylyl transferase, GRred: reduced form of glutathione reductase, GRox: oxidized form of glutathione reductase, GPxred: reduced form of glutathione peroxidase, GPxox: oxidized form of glutathione peroxidase, GST: glutathione transferase, CAT: catalase, SOD: superoxide dismutase, GSH: reduced glutathione, GSSG: glutathione disulphide, Prxred: reduced form of peroxiredoxin, Prxox: oxidized form of peroxiredoxin, Prxoverx: over-oxidized form of peroxiredoxin, Trxred: reduced form of thioredoxin, Trxox: oxidized form of thioredoxin, TrxRred: reduced form of thioredoxin reductase, TrxRox: oxidized form of thioredoxin reductase, Srx: sulfiredoxin, NO•: nitric oxide, NOS: nitric oxide synthase.](/cms/asset/bcdda317-c2b9-4fa6-9f31-439b8a21c29b/yrer_a_1392695_f0001_ob.jpg)
In light of the above, it became intriguing to measure the cellular levels of NADH and NADPH. However, this proved a rather challenging task, and diverse approaches have been applied [Citation16]. A special point of interest is that spectrophotometric assays have been developed for other molecules directly related to NADH and NADPH, such as NAD+ kinase, NADPH oxidase, peroxiredoxins, sulfiredoxins, thioredoxins, TrxR, and NOS. Hence, nowadays, crucial molecules of the NADPH-dependent redox network can be measured, and the results can be used to assess the bioenergetic and/or oxidative stress status [Citation17]. The biomarkers presented here are the most representative of the NADPH-related redox network, and according to the reference papers, the protocols for their measurement can be applied in blood and tissues in a reliable and valid manner. The use of these biomarkers can also provide important insights regarding the bidirectional relationship between blood and tissues, as has been previously demonstrated [Citation18,Citation19]. The main aim of the present review is to collectively present these NADPH-related molecules that can be assessed spectrophotometrically in blood and tissues (). In addition, this article was meant to provide, combined with a previous article [Citation15], the opportunity for researchers to assess the entire NADPH-dependent redox network via a spectrophotometer and follow the functional changes in this network in response to a redox stimulus.
Table 1. The selected NADPH-related redox biomarkers and the proposed protocols.
NADH- and NADPH-related redox biomarker protocols
Measurement of the NAD(P)H concentration in biological samples: a historical overview
NAD and NADP, or diphosphopyridine nucleotide (DPN) and triphosphopyridine nucleotide (TPN), respectively, according to their historical appellation, possess two crucial and unusual properties that make them highly useful for analytical purposes. First, they serve as natural oxidizing and reducing agents since in the presence of an auxiliary enzyme acting as a catalyst, they selectively oxidize or reduce a wide range of substrates [Citation28]. Thus, they can act as mediators during the quantification of any compound of biological interest. Second, their reduced forms can be discriminated or isolated from the oxidized forms exploiting their physical or chemical properties. Indeed, it has been shown that the reduced forms can be destroyed by the addition of acid [Citation29]. Conversely, the pioneering work of Kaplan et al. [Citation30] revealed that the oxidized forms of pyridine nucleotides are destroyed by alkali. It has also been demonstrated that high temperature has the same effects [Citation31]. In this sense, apart from serving as auxiliary compounds, their concentrations can also be determined in biological samples, such as blood or tissues [Citation32].
Approximately 80 years ago, Negelein and Hass [Citation33], as members in the laboratory of Otto Heinrich Warburg, were the first to apply a spectrophotometric method to determine glucose-6-phosphate dehydrogenase (G6-PD) activity on the basis of the increase in the absorption of NADPH. Fluorimetry, a more precise but more cumbersome method for the measurement of intermediary metabolites using pyridine nucleotides, was first introduced by Greengard in 1956 [Citation34]. Since then, numerous follow-up studies have measured the levels of a vast number of biological molecules with the aid of pyridine nucleotides.
Lowry et al. [Citation35] were the first to measure DPN+ (NAD+), TPN+ (NADP+), DPNH (NADH), and TPNH (NADPH) concentrations in tissues. Specifically, they applied a fluorimetric method to measure pyridine nucleotide concentrations in the brain and liver using G6-PD and alcohol dehydrogenase (ADH) as auxiliary enzymes. Lowry along with Passonneau presented a paper of the utmost importance regarding the measurement of nucleotide pyridines, thus providing a guide for the temperature and pH conditions that affect the oxidized and reduced forms [Citation36]. This work presented valuable biological information with regard to NAD(P) quantification both in blood and tissue samples. The aforementioned pioneering researchers applied this knowledge and managed to use pyridine nucleotides for the fluorimetric measurement of glycogen in the brain and liver, setting the foundation for the implementation of these molecules in a wide range of biochemical analyses [Citation37].
During the next decades, leading scientists such as Howse and Duffy managed to measure pyridine nucleotides in the brain by slightly modifying Lowry’s techniques [Citation38–40]. Furthermore, research groups in the field of redox bioenergetics including John Williamson and colleagues also used fluorimetry to measure NADH in liver cell lines [Citation41,Citation42], whereas LaNoue et al. measured NADH concentrations in heart mitochondria [Citation43] and the retina [Citation44].
In light of the above, most of the research groups have applied fluorimetric assays for NAD(P)H measurements. Spectrophotometry is not as sensitive as fluorimetry or other state of the art analytical tools. As a result, it is difficult to reliably measure molecules present in very low concentrations. Another frequent drawback of spectrophotometry is the absorption of more than one compounds at a given wavelength (noise), reducing the validity of the measurement. Nevertheless, spectrophotometry is undoubtedly an inexpensive and fast analytical method. Furthermore, it does not suffer from invalidity or unreliability in relatively high biomarker concentrations when the noise does not affect the measurement. According to the reference papers, this is the case regarding the biomarkers presented in this study since spectrophotometry is exceedingly useful for the quantification of pyridine nucleotide concentrations in biological samples (blood, cells and tissues). The molar extinction coefficient for NADH or NADPH at 340 nm is 6.22 l/mmol/cm, which, according to the Beer–Lambert law, means that a solution of 0.1 mM would have an optical density equal to 0.622 through a 1-cm light path. Thus, with ordinary spectrophotometers, accurate measurements can be made with NAD(P)H concentrations ranging from 0.01 to 0.2 mM, which are usually found in the subcellular environment [Citation31].
The reduced form of nicotinamide adenine dinucleotide phosphate (NADPH)
Biochemical background
NADPH is the major subcellular provider of reducing equivalents and thus a fundamental mediator of numerous biological processes including metabolism, antioxidant defence, immune function and physiology [Citation10,Citation28]. NADP+ is the oxidized form of NADPH, but NADP is predominantly found in its reduced form (i.e. NADPH) [Citation4]. The pentose phosphate pathway recycles the cellular amounts of NADPH, which is mainly implicated in anabolic pathways, such as lipid biosynthesis [Citation1], but also in the regulation of free radical generation and defence against oxidative stress. Specifically, NADPH regenerates the most important antioxidant mechanisms, namely GSH, thioredoxin and peroxiredoxins, and the most effective detoxifying enzymes, such as cytochrome P450 and catalase (the latter is also an antioxidant enzyme) [Citation3].
Selected assay for the measurement of the NADPH concentration
The measurement of the NADPH concentration is based on the protocol of Wagner and Scott [Citation20].
Principle of the assay
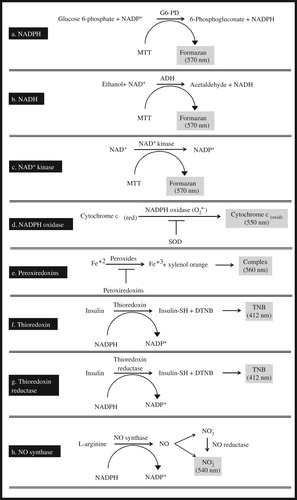
The total NADP (NADP+ and NADPH) is extracted in the tissue lysate, and then, most of the NADP+ is destroyed by heating the extracts at 60°C. Thus, the extracts contain largely the reduced form of NADP, i.e. NADPH, as well as traces of NADP+, which remains stable as NADPH is oxidized back to NADP+ via ex vivo oxidation (recycling assay). The principle of the assay is based on the conversion of glucose 6-phosphate (G6-P) to 6-phosphogluconate, a reaction catalysed by G6-PD with the concomitant reduction of the remaining amount of NADP+ to NADPH ((a)).
Figure 2. Schematic illustration of the reaction schemes for the biomarker assays.
Experimental procedure
For the extraction of NADP+ and NADPH, 200 μl of the tissue homogenate (see note 5) is added to 1800 μl of extraction buffer (containing 20 mM nicotinamide, 20 mM NaHCO3 and 100 mM Na2CO3). The samples are immediately frozen, quickly thawed in a water bath (22°C), and centrifuged (16,000g, 30 seconds, 4°C). Finally, the supernatant (the tissue extract) is collected and kept on ice in the dark.
For the NADPH concentration assay, 100 μl of the tissue extract (see note 5) is incubated in the dark (60°C for 30 minutes) in the water bath. Heating destroys the oxidized form of NADP (i.e. NADP+), while having no effect on the reduced form (i.e. NADPH). After heating, the samples are put on ice, and the steps of the total NADP assay are followed as described above, starting with the addition of the NADP cycling buffer.
Then, the tissue extract (see note 5) is added to 800 μl of ice-cold freshly made NADP cycling buffer (containing 100 mM Tris–HCl at a pH of 8, 0.5 mM thiazolyl blue tetrazolium bromide (MTT), 2 mM phenazine ethosulfate, 5 mM ethylenediaminetetraacetic acid tetrasodium salt (Na4EDTA) and 1.3 μU/ml G6-PD). The mixture is incubated in the dark (37°C for 5 minutes), and following temperature equilibration, 100 μl of 10 mM G6-P is added, with the change in absorbance monitored at 570 nm for 2 minutes. The product of MTT reduction (formazan) exhibits a maximum absorbance at 570 nm.
Important note: The tissue extract and the cycling buffer must not remain mixed for over 15 minutes, and the extracts cannot remain on ice for more than 1 hour because of significant degradation of the total NADP concentration.
Calculations
The NADPH concentration is calculated through the Beer–Lambert law using the millimolar extinction coefficient of formazan (13 l/mmol/cm), which means that a solution of 0.1 mM would have an optical density equal to 0.13 in a 1-cm light path.
The reduced form of nicotinamide adenine dinucleotide (NADH)
Biochemical background
NAD is a coenzyme present in every living cell, and it exists in two forms, the oxidized form (i.e. NAD+) and the reduced form (i.e. NADH). However, it is largely present in its oxidized form under physiological conditions. NAD+ is an oxidizing agent, as it accepts electrons from other molecules and is reduced, whereas NADH is a reducing agent, as it donates electrons and becomes oxidized [Citation3]. Thus, NAD is involved in redox homeostasis, energy metabolism and other cellular processes, the most notable of them is the posttranslational modification of proteins that are substrates of enzymes that remove chemical groups [Citation4]. NAD+ is synthesized either de novo from the amino acid tryptophan or by recycling components, such as nicotinamide. The 2-phosphorylation of NAD+ converts it to NADP+.
Selected assay for the measurement of the NADH concentration
The measurement of the NADH concentration is based on the protocol of Wagner and Scott [Citation20].
Principle of the assay
The total NAD (NAD+ and NADH) is extracted by the tissue lysate, and then, most of the NAD+ is destroyed by heating the extracts at 60°C. Thus, the extracts contain largely the reduced form of NAD, i.e. NADH, as well as traces of NAD+, which remains stable as NADH is oxidized back to NAD+ via ex vivo oxidation (recycling assay). The principle of the assay is based on the conversion of ethanol to acetaldehyde, a reaction catalysed by ADH with the concomitant reduction of the remaining amount of NAD+ to NADH ((b)).
Experimental procedure
For the extraction of NAD+ and NADH, 200 μl of the tissue homogenate (see note 5) is added to 1800 μl of extraction buffer (containing 20 mM nicotinamide, 20 mM NaHCO3 and 100 mM Na2CO3). The samples are immediately frozen, quickly thawed in a water bath (22°C), and centrifuged (16,000 g, 30 seconds, 4°C). Then, the supernatant (the tissue extract) is collected and kept on ice in the dark.
For the NADH concentration assay, 100 μl of the tissue extract (see note 5) is incubated in the dark (at 60°C for 30 minutes) in a water bath. Heating destroys the oxidized form of NAD (i.e. NAD+), while having no effect on the reduced form (i.e. NADH). After heating, the samples are put on ice, and the steps of the total NAD assay are followed as described above, starting with the addition of the NAD cycling buffer.
Then, the tissue extract (see note 5) is added to 800 μl of ice-cold freshly made NAD cycling buffer (containing 100 mM Tris–HCl at a pH of 8, 0.5 mM MTT, 0.2 mg of ADH and 1% bovine serum albumin), the samples are incubated in the dark (37°C for 5 minutes), and then 100 μl of 6 M ethanol is added. The samples are centrifuged (16,000 g, 30 seconds, 4°C) to remove any insoluble materials, and the absorbance change is monitored at 570 nm for 2 minutes. The product of MTT reduction (formazan) exhibits a maximum absorbance at 570 nm.
Important note: The tissue extract and cycling buffer must not remain mixed for over 15 minutes, and the extracts cannot remain on ice for more than 1 hour because of the significant degradation of the total NAD concentration.
Calculations
The NADH concentration is calculated through the Beer–Lambert law using the millimolar extinction coefficient of formazan (13 l/mmol/cm), which means that a solution of 0.1 mM would have an optical density equal to 0.13 in a 1-cm light path.
NAD+ kinase
Biochemical background
NAD+ kinase catalyses the production of NADP+ via the phosphorylation of NAD+. This is the only known reaction to generate NADP+, and thus, NAD+ kinase is a key enzyme for the regulation of cellular concentrations of NAD+ and NADP+ and, accordingly, for cell survival [Citation22]. Specifically, NAD+ kinase is essential for fundamental biological processes, such as metabolism and redox homeostasis. NADP+ is reduced to NADPH via the pentose phosphate pathway, and it is involved both in anabolic (e.g. fatty acid and nucleotide biosynthesis) and catabolic (e.g. glycolysis and citric acid cycle) pathways. NADPH provides reducing power in the cellular environment regulating cell redox homeostasis. The NAD+ kinase activity is regulated by the redox state of the cell since it can modulate cell and tissue response to oxidative stress by controlling NADP+ and NADPH production [Citation8,Citation22].
Selected assay for the measurement of the NAD+ kinase activity
The measurement of the NAD+ kinase activity is based on the protocol of Outten and Culotta [Citation21] as modified by Pollak et al. [Citation22].
Principle of the assay
The assay is based on the production of NADP+ by NAD+ kinase present in the sample. NADP+ is then determined via the phenazine methosulphate-induced reduction of MTT forming formazan ((c)).
Experimental procedure
The tissue lysate (see note 5) is added to a reaction mixture containing 50 mM Tris–HCl at a pH of 7.8, 10 mM MgCl2, 5 mM NAD+, and 10 mM ATP in a final volume of 100 μl following incubation for 5 minutes at 30°C. The amount of NADP+ produced is then determined using a cycling assay by transferring the mixture into 900 μl of 50 mM Tris–HCl at a pH of 8.0, 5 mM MgCl2, 5 mM G6-P, 2 units of NADP+-specific yeast G6-PD, 0.5 mM MTT and 1.5 mM phenazine methosulfate. The absorbance change is monitored at 570 nm for 5 minutes. The product of MTT reduction (formazan) exhibits a maximum absorbance at 570 nm.
Calculations
The amount of NADP+ produced by the reaction is quantified by comparison to known concentrations of NADP+ standards. The NAD+ kinase activity is calculated by subtracting the amount of NADP+ produced by the reaction from the amount of NADP+ produced without the addition of the tissue lysate. One unit of NAD+ kinase is defined as the amount of enzyme producing 1 μmol of NADP+ in 1 minute at 30°C.
NADPH oxidase
Biochemical background
NADPH oxidase is an enzyme complex that donates an electron from NADPH to molecular oxygen (O2) to produce a superoxide anion (O2•−). NADPH oxidase present in phagocytes initiates an oxidative burst by generating O2•−. This is an inflammatory-mediating mechanism leading to the elimination of invading microorganisms, bacteria and fungi [Citation45]. The superoxide anion can be transformed to H2O2, which can further give birth to other RONS with the ability to control metabolic pathways [Citation46,Citation47]. The phagocyte NADPH oxidase complex was the first system identified that generates ROS not as a by-product but as a part of its function [Citation48]. The discovery of other members of the NADPH oxidase family enlightened the implication of these enzymes in a wide spectrum of physiological and biological processes (e.g. cellular signalling and gene expression) as well as several pathological conditions and diseases (e.g. aging and cardiovascular disease) [Citation47,Citation49].
Selected assay for the measurement of the NADPH oxidase activity
The measurement of the NADPH oxidase activity is based on the protocol of Someya et al. [Citation23] as modified by Hua et al. [Citation24].
Principle of the assay
The O2•− generated by NADPH oxidase oxidizes cytochrome c. In the presence of superoxide dismutase (SOD), O2•− is converted to H2O2, and thus, cytochrome c oxidation is inhibited ((d)).
Experimental procedure
The assay mixture contains the homogenized tissue extract (see note 5), 60 mM cytochrome c, 1 mM CaCl2, 1 mM MgCl2 and 1.6 mM 4b-phorbol 12-myristate 13-acetate (PMA) with (for the samples) or without (for the blank) 20 mg/ml SOD in a total volume of 400 μl of phosphate buffered saline (PBS, pH = 7.4). After incubation (37°C for 5 minutes), the samples are centrifuged (800 g, 5 minutes, RT), and the absorbance is monitored at 550 nm. The oxidized form of cytochrome c exhibits a maximum absorbance at 550 nm.
Calculations
The activity of NADPH oxidase is calculated through the Beer–Lambert law using the millimolar extinction coefficient of oxidized cytochrome c (21 l/mmol/cm), which means that a solution of 0.1 mM would have an optical density equal to 0.21 in a 1-cm light path.
Peroxiredoxins
Biochemical background
Peroxiredoxins are a family of cysteine-dependent peroxidases that react with H2O2, aliphatic and aromatic hydroperoxide substrates, and peroxynitrite [Citation50]. They comprise up to 1% or more of cellular proteins in animals, and it has been suggested that are responsible for the reduction of more than 99% of cytosolic peroxides as well as 90% of mitochondria peroxides in humans [Citation51]. Furthermore, peroxiredoxins mediate signal transduction in mammalian cells [Citation52]. Regarding its peroxidase reaction mechanism, the 2-Cys subgroup of peroxiredoxins is oxidized by H2O2 molecule and hinders the formation of a disulphide that is normally generated by the chemical bond between a sulphonic group and a cysteine group. Then, it can react with another H2O2 and become over-oxidized to cysteine sulfinic acid. Such over-oxidation leads to the inactivation of the peroxidase activity, and finally, peroxiredoxin is reduced back by an ATP-dependent reaction catalysed by a sulfiredoxin or a thioredoxin [Citation53].
Selected assay for the measurement of the peroxiredoxin activity
The measurement of the peroxiredoxin activity is based on the protocol of Nelson and Parsonage [Citation25].
Principle of the assay
This assay directly monitors decreasing peroxide concentrations in the presence of Fe(II) and xylenol orange [ocresolsulfonphthalein-3,3-bis(methyliminodiacetic acid sodium salt)]. Under acidic conditions, peroxides oxidize Fe(II) to Fe(III), which forms a complex with xylenol orange. The production of this complex generates a blue-purple colour, with a maximum absorbance at 560 nm ((e)).
Experimental procedure
In plastic tubes, the tissue homogenate (see note 5) is added to 100 μM dithiothreitol (DTT) and 100 μM peroxide (final concentrations in the reaction mixture). The blank contains DTT and peroxide but not the tissue homogenate. The samples are incubated in the dark at RT, and the reaction is terminated by the addition of 50 μl of the mixture to 950 μl of FOX working reagent. To make FOX working reagent, mix 1 volume of FOX reagent A (containing 25 mM ammonium ferrous sulphate diluted in 2.5 M sulphuric acid; the iron salt must be dissolved directly in acid because ferrous ions are prone to autoxidation at physiological pH) with 100 volumes of FOX reagent B (containing 100 mM sorbitol and 125 μM xylenol orange). The samples are mixed and incubated at RT for 30 minutes, and the absorbance is monitored at 560 nm. The complex formed by Fe(III) and xylenol orange exhibits a maximum absorbance at 560 nm.
Important note: Hydrogen peroxide, which is used in some assays, is not recommended as a substrate since multiple enzymes (e.g. catalase and GPx) use this substrate. In contrast, t-butyl hydroperoxide, cumene hydroperoxide (dissolved in dimethyl sulfoxide) and linoleic acid hydroperoxide (dissolved in methanol) are much more efficiently reduced by peroxiredoxins than by other peroxidases.
Calculations
The peroxiredoxin activity is calculated via the standard curve of the peroxide of interest at known concentrations. Standards should include controls containing no peroxide. For the standard curve, 5 μM peroxiredoxin, 100 μM DTT and peroxide concentrations from 10 to 200 μM are required. The samples are incubated in the dark at RT, and the reaction is terminated by adding 50 μl of the mixture to 950 μl of FOX working reagent. The samples are mixed and incubated at RT for 30 minutes, and the absorbance is monitored at 560 nm.
Thioredoxin
Biochemical background
Thioredoxin is a small redox enzyme present in all organisms. It is implicated in numerous important biological processes, including redox signalling and redox homeostasis. A mutation that leads to the loss of function of either of the two human thioredoxin genes is lethal for the developing embryo [Citation54]. Thioredoxin is a thiol-disulphide oxidoreductase and acts as an antioxidant catalysing the reduction of disulphides by cysteine thiol-disulphide exchange, with the rates for proteins being orders of magnitude faster than those for GSH [Citation54,Citation55]. Reduced thioredoxin has a dithiol group [Trx-(SH)2] and is a powerful protein disulphide reductase, whereas oxidized thioredoxin has a disulphide group (Trx-S2). Thus, it plays a key role in keeping the cell environment in a reduced state [Citation56]. Thioredoxin is kept in the reduced state by the TrxR in a NADPH-dependent reaction [Citation57]. Thioredoxins act as electron donors to peroxidases and ribonucleotide reductase [Citation54]. The decisive role of thioredoxin in reducing oxidative stress is shown by the fact that transgenic mice that over-express thioredoxin are more resistant to inflammation and live 35% longer [Citation58]. Thioredoxin has a metabolic role by also reactivating oxidized G6-PD in mammalian cells subjected to oxidative stress [Citation59].
Selected assay for the measurement of the thioredoxin activity
The measurement of the thioredoxin activity is based on the protocol of Kumar and Holmgren [Citation26].
Principle of the assay
In the presence of tissue thioredoxin, NADPH is oxidized and insulin is concomitantly reduced by the formation of -SH compounds (thiol compounds) on its molecule. The thiol compounds are conjugated with 5,5′-dithiobis(2-nitrobenzoic acid) (DTNB) forming 2-nitro-5-thiobenzoic acid (TNB), which exhibits a maximum absorbance at 412 nm ((f)).
Experimental procedure
In plastic tubes, 260 mM 4-(2-hydroxyethyl)-1-piperazineethanesulfonic acid (HEPES) at a pH of 7.6, 10 mM EDTA, 2 mM NADPH, 1 mM insulin, 100 nM purified calf thymus TrxR and the tissue homogenate (see note 5) for the samples or buffer for the blank are added into a final volume of 100 μl. After incubation (37°C, for 20 minutes), the reaction is stopped by the addition of 500 μl of 6 M guanidine–HCl, 200 mM Tris–HCl at a pH of 8.0, and 1 mM DTNB, and the absorbance is monitored at 412 nm. TNB exhibits a maximum absorbance at 412 nm.
Calculations
The thioredoxin activity is calculated through the Beer–Lambert law using the molar extinction coefficient of TNB (13.6 l/mmol/cm), which means that a solution of 0.1 mM would have an optical density equal to 1.36 in a 1-cm light path.
Thioredoxin reductase
Biochemical background
TrxR is the only enzyme known to catalyse the reduction of thioredoxin using NADPH, and hence, its contribution to the maintenance of cell and tissue redox homeostasis is of the utmost importance [Citation57]. It is a homodimer flavoprotein, and each monomer contains a flavin adenine dinucleotide prosthetic group, an NADPH binding domain and a site containing a redox-active disulphide bond [Citation60]. TrxR, apart from operating as a potent NADPH-related reduction system, also acts as a hydrogen donor for ribonucleotide reductase, an essential enzyme in DNA synthesis [Citation61]. Thioredoxin, TrxR and NADPH are collectively called ‘the thioredoxin system’. The thioredoxin system exists in every living organism and is a mechanism of defence against oxidative damage due to oxygen metabolism and the propagation of redox signalling from H2O2 and NO• [Citation62,Citation63].
Selected assay for the measurement of the TrxR activity
The measurement of the TrxR activity is based on the protocol of Kumar and Holmgren [Citation26].
Principle of the assay
In the presence of tissue TrxR, NADPH is oxidized, and insulin is concomitantly reduced by the formation of thiol compounds on its molecule. The thiol compounds are conjugated with DTNB forming TNB, which has a maximum absorbance at 412 nm ((g)).
Experimental procedure
In plastic tubes, 260 mM HEPES at a pH of 7.6, 10 mM EDTA, 2 mM NADPH, 1 mM insulin, 100 μM E. coli thioredoxin and the tissue homogenate (see note 5) for the samples or buffer for the blank are added into a final volume of 100 μl. After incubation (37°C, for 20 minutes), the reaction is stopped by the addition of 500 μl of 6 M guanidine–HCl, 200 mM Tris–HCl at a pH of 8.0, and 1 mM DTNB, and the absorbance is monitored at 412 nm. TNB exhibits a maximum absorbance at 412 nm.
Calculations
The activity of TrxR is calculated through the Beer–Lambert law using the molar extinction coefficient of TNB (13.6 l/mmol/cm), which means that a solution of 0.1 mM would have an optical density equal to 1.36 in a 1-cm light path.
Nitric oxide synthase
Biochemical background
NOSs are a family of enzymes that catalyse the production of nitric oxide (NO•) and citrulline from l-arginine and O2 with NADPH as an electron donor. Nitric oxide is considered to be an important signalling molecule regulating vascular tone, insulin secretion, cardiac function, neural development and angiogenesis [Citation64]. Mammalian systems contain three isoforms of the enzyme, namely the neuronal isoform implicated in neurotransmission, the inducible isoform that is involved in immune response and the endothelial isoform that is the primary signal generator in the control of vascular tone [Citation65].
Selected assay for the measurement of the NOS activity
The measurement of the total NOS activity is based on the protocol of Abdelkawy and Salem [Citation27].
Principle of the assay
In this recycling assay, NADPH is regenerated by G6-PD, which converts NADP+ to NADPH allowing NOS to produce nitric oxide derived nitrate () and nitrite (
).
is reduced back to
via nitrate reductase, and the quantity of the produced
expresses the activity of the NOS ((h)).
Experimental procedure
Into the tissue homogenate (see note 5), 1000 μl of absolute alcohol is added, and the samples are centrifuged (3000 g, 20 minutes, 4°C) to precipitate unwanted proteins. Then, in 500 μl of the supernatant, 1000 μl of reaction buffer (consisting of 50 mM HEPES and 0.5 mM EDTA adjusted to a pH of 7.2), 50 μl of solution 1 (consisting of 0.2 mM NAD+, 0.17 mM G6-P and 0.36 mM l-arginine) and 50 μl of 40 mU/ml G6-PD are added. The solution is mixed well, incubated (6 hours, 37°C) and then chilled on ice for 5 minutes. Into 500 μl of the previous mixture, 500 μl of 50 mU/ml nitrate reductase is added, and the samples are mixed well. Then, 250 μl of sulphanilamide in 5% HCl (2% w/v) and 250 μl of N(1-naphthyl)ethylene diamine dihydrochloride (NEDD) in H2O (0.1% w/v) are added, mixed well, and incubated (30 minutes, 37°C). The absorbance is monitored at 540 nm, as nitrite compounds exhibit a maximum absorbance at 540 nm.
Calculations
The activity of NOS is calculated via the standard curve of sodium nitrite (NaNO2) solutions with known concentrations.
General notes applicable to all assays
1. Tissue of reference
The experimental procedures of all assays refer to the tissue tested in each reference paper. However, they can be applied to different tissues and blood after being properly modified. Regarding blood, we exclusively refer to erythrocytes. Should the described protocols be applied in the measurement of the biomarkers of the NADPH network in subcellular compartments, such as the mitochondria or nucleus, it is certain that the methods, sample preparation and precautions will be different. Therefore, this manuscript presents assays of the NADPH-related biomarkers in tissue homogenate and erythrocyte lysate as a whole and not in subcellular compartments.
2. Tissue homogenization protocol
In preparation for analysis, tissue samples are initially ground using a mortar and pestle under liquid nitrogen (−196°C). A portion of the tissue powder is then homogenized with 10 mM PBS (containing 138 mM NaCl, 2.7 mM KCl and 1 mM EDTA, pH = 7.4) (1 mg of tissue powder/2 ml of PBS) and a cocktail of protein inhibitors [1 μM aprotinin, 100 μM leupeptin and 1 mM phenylmethylsulfonyl fluoride (PMSF)]. The homogenate is vigorously mixed, and a brief sonication treatment on ice is applied. The homogenate is then centrifuged (12,000g, 4°C, 30 minutes), and the supernatant is collected and stored at −80°C until further analysis [Citation18].
3. Erythrocyte lysis protocol
In an EDTA tube, 500 ml of whole blood is added, the samples are centrifuged (1370g, 10 minutes, 4°C) and the supernatant (plasma, platelets and white blood cells) is discarded. An equal volume of saline is added to the packed erythrocytes, and the samples are centrifuged (1370g, 10 minutes, 4°C) in order to discard the trapped white blood cells. Then, the saline from the supernatant is removed, an equal volume of dH2O is added to the packed erythrocytes, the samples are centrifuged (4000g, 15 minutes, 4°C) and the supernatant, which is the haemolysate (i.e. erythrocyte lysate), is collected [Citation18,Citation66]. The haemolysate can now be stored at −80°C until further analysis.
4. Calculation of the tissue protein concentration and erythrocyte haemoglobin concentration
The activities of the enzymes and the concentrations of the molecules in blood are expressed in terms of the haemoglobin concentration, whereas in other tissues, they are expressed in terms of the total protein concentration. The total protein concentration of tissue samples is measured using the Bradford method via a standard curve of solutions with known bovine serum albumin concentrations. The haemoglobin concentration of the erythrocytes is measured using a commercially available kit.
5. Amounts of blood or tissue samples
We do not provide the exact volume of the blood or tissue sample in any of the assays, since, even when it is indicated in the reference paper, the treatment of the samples is mostly unknown. Thus, pilot experiments are needed in order to optimize the proposed protocols according to the specimen and the homogenization procedure.
6. Storage of biological samples
In order to minimize ex vivo oxidation and/or other biotransformations, a strategy universally applied after sample collection is the immediate freezing of biological samples with liquid nitrogen. This strategy secures the best possible conditions for reliable further analysis. According to the instructions in the original assays presented in each biomarker protocol, all biomarkers are sufficiently stable and can be reliably measured in stored samples.
7. Solution preparation
Solutions, including NADPH and NADH extraction buffers, Tris–HCl, MgCl2, CaCl2, PBS (pH = 7.4), DTT, peroxide and tissue homogenization buffer with protease inhibitors can be stored at 4°C for 1 month. The remaining solutions should be made fresh the day of the experiment.
Concluding remarks
NADH and NADPH along with their oxidized counterparts (i.e. NAD+ and NADP+) are molecules involved in fundamental redox and metabolic processes. NADPH oxidation is the initial step for a cascade of reactions with the utmost biological importance. The molecules of this cascade form a network with eminent translational potential in redox metabolism. Therefore, in the present review, we provided the researchers with reliable and valid spectrophotometric assays for the measurement of the most important biomarkers of this network in blood and other tissues given that a spectrophotometer is probably the simplest, most inexpensive and most widely used tool in biochemistry.
Disclosure statement
No potential conflict of interest was reported by the authors.
ORCID
Nikos V. Margaritelis http://orcid.org/0000-0001-5119-427X
Vassilis Paschalis http://orcid.org/0000-0002-9469-0457
References
- Agledal L, Niere M, Ziegler M. The phosphate makes a difference: cellular functions of NADP. Redox Rep. 2010;15(1):2–10. doi: 10.1179/174329210X12650506623122
- Berger F, Ramírez-Hernández MH, Ziegler M. The new life of a centenarian: signalling functions of NAD(P). Trends Biochem Sci. 2004;29(3):111–118. doi: 10.1016/j.tibs.2004.01.007
- Cantó C, Menzies KJ, Auwerx J. NAD(+) metabolism and the control of energy homeostasis: a balancing act between mitochondria and the nucleus. Cell Metab. 2015;22(1):31–53. doi: 10.1016/j.cmet.2015.05.023
- Pollak N, Dölle C, Ziegler M. The power to reduce: pyridine nucleotides – small molecules with a multitude of functions. Biochem J. 2007a;402(2):205–218. doi: 10.1042/BJ20061638
- Nikiforov A, Kulikova V, Ziegler M. The human NAD metabolome: functions, metabolism and compartmentalization. Crit Rev Biochem Mol Biol. 2015;50(4):284–297. doi: 10.3109/10409238.2015.1028612
- Lin SJ, Guarente L. Nicotinamide adenine dinucleotide, a metabolic regulator of transcription, longevity and disease. Curr Opin Cell Biol. 2003;15(2):241–246. doi: 10.1016/S0955-0674(03)00006-1
- Liou GG, Tanny JC, Kruger RG, et al. Assembly of the SIR complex and its regulation by O-acetyl-ADP-ribose, a product of NAD-dependent histone deacetylation. Cell. 2005;121(4):515–527. doi: 10.1016/j.cell.2005.03.035
- Grose JH, Joss L, Velick SF, et al. Evidence that feedback inhibition of NAD kinase controls responses to oxidative stress. Proc Natl Acad Sci USA. 2006;103(20):7601–7606. doi: 10.1073/pnas.0602494103
- Anderson RM, Bitterman KJ, Wood JG, et al. Nicotinamide and PNC1 govern lifespan extension by calorie restriction in Saccharomyces cerevisiae. Nature. 2003;423(6936):181–185. doi: 10.1038/nature01578
- Kourtzidis IA, Stoupas AT, Gioris IS, et al. The NAD(+) precursor nicotinamide riboside decreases exercise performance in rats. J Int Soc Sports Nutr. 2016;2(13):32. doi: 10.1186/s12970-016-0143-x
- Aon MA, Stanley BA, Sivakumaran V, et al. Glutathione/thioredoxin systems modulate mitochondrial H2O2 emission: an experimental-computational study. J Gen Physiol. 2012;139(6):479–491. doi: 10.1085/jgp.201210772
- Kirkman HN, Rolfo M, Ferraris AM, et al. Mechanisms of protection of catalase by NADPH. Kinetics and stoichiometry. J Biol Chem. 1999;274(20):13908–13914. doi: 10.1074/jbc.274.20.13908
- Winterbourn CC. The biological chemistry of hydrogen peroxide. Methods Enzymol. 2013;528:3–25. doi: 10.1016/B978-0-12-405881-1.00001-X
- Bieganowski P, Brenner C. Discoveries of nicotinamide riboside as a nutrient and conserved NRK genes establish a Preiss–Handler independent route to NAD+ in fungi and humans. Cell. 2004;117:495–502. doi: 10.1016/S0092-8674(04)00416-7
- Veskoukis AS, Kyparos A, Paschalis V, et al. Spectrophotometric assays for measuring redox biomarkers in blood. Biomarkers. 2016a;21(3):208–217. doi: 10.3109/1354750X.2015.1126648
- Viña J, Saez GT, Gambini J, et al. Role of NAD(+)/NADH redox ratio in cell metabolism: a tribute to Helmut Sies and Theodor Bücher and Hans A. Krebs. Arch Biochem Biophys. 2016;595:176–180. doi: 10.1016/j.abb.2015.11.027
- Margaritelis NV, Cobley JN, Paschalis V, et al. Going retro: oxidative stress biomarkers in modern redox biology. Free Radic Biol Med. 2016;98:2–12. doi: 10.1016/j.freeradbiomed.2016.02.005
- Veskoukis AS, Nikolaidis MG, Kyparos A, et al. Blood reflects tissue oxidative stress depending on biomarker and tissue studied. Free Radic Biol Med. 2009;47(10):1371–1374. doi: 10.1016/j.freeradbiomed.2009.07.014
- Margaritelis NV, Veskoukis AS, Paschalis V, et al. Blood reflects tissue oxidative stress: a systematic review. Biomarkers. 2015;20(2):97–108. doi: 10.3109/1354750X.2014.1002807
- Wagner TC, Scott MD. Single extraction method for the spectrophotometric quantification of oxidized and reduced pyridine nucleotides in erythrocytes. Anal Biochem. 1994;222(2):417–426. doi: 10.1006/abio.1994.1511
- Outten CE, Culotta VC. A novel NADH kinase is the mitochondrial source of NADPH in Saccharomyces cerevisiae. EMBO J. 2003;22(9):2015–2024. doi: 10.1093/emboj/cdg211
- Pollak N, Niere M, Ziegler M. NAD kinase levels control the NADPH concentration in human cells. J Biol Chem. 2007b;282(46):33562–33571. doi: 10.1074/jbc.M704442200
- Someya A, Nishijima K, Nunoi H, et al. Study on the superoxide-producing enzyme of eosinophils and neutrophils-comparison of the NADPH oxidase components. Arch Biochem Biophys. 1997;345:207–213. doi: 10.1006/abbi.1997.0252
- Hua J, Hasebe T, Someya A, et al. Evaluation of the expression of NADPH oxidase components during maturation of HL-60 cells to neutrophil lineage. J Leukoc Biol. 2000;68(2):216–224.
- Nelson KJ, Parsonage D. Measurement of peroxiredoxin activity. Curr Protoc Toxicol. Chapter 7:Unit7. 2011;10:1–33.
- Kumar S, Holmgren A. Induction of thioredoxin, thioredoxin reductase and glutaredoxin activity in mouse skin by TPA, a calcium ionophore and other tumor promoters. Carcinogenesis. 1999;20(9):1761–1767. doi: 10.1093/carcin/20.9.1761
- Abdelkawy KS, Salem KA. Simple method for measuring endothelial nitric oxide synthase activity in clinical researches. J App Pharm Sci. 2015;5(Suppl. 3):084–090.
- Ying W. NAD+/NADH and NADP+/NADPH in cellular functions and cell death: regulation and biological consequences. Antioxid Redox Signal. 2008;10(2):179–206. doi: 10.1089/ars.2007.1672
- Warburg O, Christian W, Griese A. Hydrogen-transferring coenzyme, its composition and mode of action. Biochem Z. 1935;282:157.
- Kaplan NO, Colowick SP, Barnes CC. Effect of alkali on diphosphopyridine nucleotide. J Biol Chem. 1951;191:461–472.
- Passonneau JV, Lowry OH. Enzymatic analysis. A practical guide. Totowa, NJ: Humana Press; 1993.
- Burch HB, Bradley ME, Lowry OH. The measurement of triphosphopyridine nucleotide and the role of hemoglobin in producing erroneous triphosphopyridine nucleotide values. J Biol Chem. 1967;242:4546–4554.
- Negelein E, Haas E. Uber die Wirkungweise des Zwischenferments. Biochem Z. 1935;282:206–220.
- Greengard P. Determination of intermediary metabolites by enzymic fluorimetry. Nature (London). 1956;178:632–643. doi: 10.1038/178632a0
- Lowry OH, Roberts NR, Kapphahn JI. The fluorometric measurement of pyridine nucleotides. J Biol Chem. 1957;224:1047–1064.
- Lowry OH, Passonneau JV, Rock MK. The stability of pyridine nucleotides. J Biol Chem. 1961;236:2756–2759.
- Passonneau JV, Gatfield PD, Schulz DW, et al. An enzymic method for measurement of glycogen. Anal Biochem. 1967;19:315–326. doi: 10.1016/0003-2697(67)90167-4
- Howse DC, Duffy TE. Control of the redox state of the pyridine nucleotides in the rat cerebral cortex. Effect of electroshock-induced seizures. J Neurochem. 1975;24(5):935–940. doi: 10.1111/j.1471-4159.1975.tb03658.x
- Duffy TE, Howse DC, Plum F. Cerebral energy metabolism during experimental status epilepticus. J Neurochem. 1975;24(5):925–934. doi: 10.1111/j.1471-4159.1975.tb03657.x
- Hindfelt B, Plum F, Duffy TE. Effect of acute ammonia intoxication on cerebral metabolism in rats with portacaval shunts. J Clin Invest. 1977;59(3):386–396. doi: 10.1172/JCI108651
- Williamson JR, Corkey BE. Assays of intermediates of the citric acid cycle and related compounds by fluorometric enzyme methods. Methods Enzymol. 1969;13:454–513.
- Tischler ME, Hecht P, Williamson JR. Effect of ammonia on mitochondrial and cytosolic NADH and NADPH systems in isolated rat liver cells. FEBS Lett. 1977;76(1):99–104. doi: 10.1016/0014-5793(77)80129-4
- LaNoue KF, Watts JA, Koch CD. Adenine nucleotide transport during cardiac ischemia. Am J Physiol. 1981;241(5):H663–H671.
- Ola MS, Berkich DA, Xu Y, et al. Analysis of glucose metabolism in diabetic rat retinas. Am J Physiol Endocrinol Metab. 2006;290(6):E1057–E1067. doi: 10.1152/ajpendo.00323.2005
- Panday A, Sahoo MK, Osorio D, et al. NADPH oxidases: an overview from structure to innate immunity-associated pathologies. Cell Mol Immunol. 2015;12(1):5–23. doi: 10.1038/cmi.2014.89
- Andersson U, Leighton B, Young ME, et al. Inactivation of aconitase and oxoglutarate dehydrogenase in skeletal muscle in vitro by superoxide anions and/or nitric oxide. Biochem Biophys Res Commun. 1998;249(2):512–516. doi: 10.1006/bbrc.1998.9171
- Hwang NR, Yim SH, Kim YM, et al. Oxidative modifications of glyceraldehyde-3-phosphate dehydrogenase play a key role in its multiple cellular functions. Biochem J. 2009;423(2):253–264. doi: 10.1042/BJ20090854
- Bedard K, Krause KH. The NOX family of ROS-generating NADPH oxidases: physiology and pathophysiology. Physiol Rev. 2007;87(1):245–313. doi: 10.1152/physrev.00044.2005
- Quinn MT, Ammons MC, Deleo FR. The expanding role of NADPH oxidases in health and disease: no longer just agents of death and destruction. Clin Sci (Lond). 2006;111(1):1–20. doi: 10.1042/CS20060059
- Hall A, Nelson KJ, Poole LB, et al. Structure-based insights into the catalytic power and conformational dexterity of peroxiredoxins. Antioxid Redox Signal. 2010;402:194–209.
- Winterbourn CC. Reconciling the chemistry and biology of reactive oxygen species. Nat Chem Biol. 2008;4:278–286. doi: 10.1038/nchembio.85
- Rhee S, Chae H, Kim K. Peroxiredoxins: a historical overview and speculative preview of novel mechanisms and emerging concepts in cell signalling. Free Radic Biol Med. 2005;38(12):1543–1552. doi: 10.1016/j.freeradbiomed.2005.02.026
- Rhee SG, Woo HA, Kil IS, et al. Peroxiredoxin functions as a peroxidase and a regulator and sensor of local peroxides. J Biol Chem. 2012;287(7):4403–4410. doi: 10.1074/jbc.R111.283432
- Arnér ES, Holmgren A. Physiological functions of thioredoxin and thioredoxin reductase. Eur J Biochem. 2000;267(20):6102–6109. doi: 10.1046/j.1432-1327.2000.01701.x
- Holmgren A. Thioredoxin and glutaredoxin systems. J Biol Chem. 1989;264(24):13963–13966.
- Nordberg J, Arnér ES. Reactive oxygen species, antioxidants, and the mammalian thioredoxin system. Free Radic Biol Med. 2001;31(11):1287–1312. doi: 10.1016/S0891-5849(01)00724-9
- Mustacich D, Powis G. Thioredoxin reductase. Biochem J. 2000;346(Pt 1):1–8. doi: 10.1042/bj3460001
- Yoshida T, Nakamura H, Masutani H, et al. The involvement of thioredoxin and thioredoxin binding protein-2 on cellular proliferation and aging process. Ann N Y Acad Sci. 2005;1055:1–12. doi: 10.1196/annals.1323.002
- Fernando MR, Nanri H, Yoshitake S, et al. Thioredoxin regenerates proteins inactivated by oxidative stress in endothelial cells. Eur J Biochem. 1992;209(3):917–922. doi: 10.1111/j.1432-1033.1992.tb17363.x
- Hirt RP, Müller S, Embley TM, et al. The diversity and evolution of thioredoxin reductase: new perspectives. Trends Parasitol. 2002;18(7):302–308. doi: 10.1016/S1471-4922(02)02293-6
- Holmgren A, Björnstedt M. Methods in enzymology. Methods Enzymol. 1995;252:199–208. doi: 10.1016/0076-6879(95)52023-6
- Meyer Y, Buchanan BB, Vignols F, et al. Thioredoxins and glutaredoxins: unifying elements in redox biology. Annu Rev Gen. 2009;43(2009):335–367. doi: 10.1146/annurev-genet-102108-134201
- Lillig CH, Holmgren A. Thioredoxin and related molecules – from biology to health and disease. Antioxid Redox Signal. 2007;9(1):25–47. doi: 10.1089/ars.2007.9.25
- Knowles R, Moncada S. Nitric oxide synthases in mammals. The Biochem J. 1994;298:249–258. doi: 10.1042/bj2980249
- Moncada S, Higgs E. Nitric oxide and the vascular endothelium. Handb Exp Pharmacol. 2006;176:213–254. doi: 10.1007/3-540-32967-6_7
- Veskoukis AS, Goutianos G, Paschalis P, et al. The rat closely mimics oxidative stress and inflammation in humans after exercise but not after exercise combined with vitamin C administration. Eur J Appl Physiol. 2016b;116(4):791–804. doi: 10.1007/s00421-016-3336-8