
ABSTRACT
Objectives: As plasma and salivary total antioxidant capacity (TAC) is mainly contributed by uric acid (UA), the present study measures non-urate TAC (Nu-TAC). The aim of the study was to correlate plasma native TAC, Nu-TAC and UA with their salivary analogues, and compare the UA contribution in both body fluids using two different methods.
Methods: The study involved 55 middle-aged and older subjects (66.7 ± 4.5 years). TAC was determined simultaneously with two methods (ferric reducing ability of plasma – FRAP, 2.2-diphenyl-1-picryl-hydrazyl – DPPH and countertypes for saliva – FRAS and DPPHS test), with and without UA (native TAC and Nu-TAC, respectively). Plasma UA and salivary UA (SUA) were assessed.
Results: Subjects with increased FRAP, DPPH and UA had higher FRAS, DPPHS and SUA, respectively (P < 0.05). Plasma Nu-TAC indices did not correlate with salivary Nu-TAC. The contribution of UA to the plasma and salivary DPPH tests was similar: 75.7 ± 10.3% and 75.2 ± 14.0%, respectively. However, the contribution of UA to FRAS was higher than that for FRAP (71.6 ± 13.9% vs. 64.0 ± 8.1%; P < 0.001).
Discussion: Our findings suggest that saliva is a good predictor for native plasma TAC but not for Nu-TAC. UA level is comparably dominant in saliva and in plasma according to DPPH, but lower in plasma according to FRAP.
Introduction
The homeostasis between prooxidants and antioxidants in living organisms is maintained by the constant activities of biological processes. There are various ways to assess the antioxidant potential of a body: some rely on assessing concentration or activity of particular antioxidants in body fluids or in cells/tissues, others involve Total Antioxidant Capacity (TAC) assessment. Different methods for TAC evaluation are available, but each is encumbered with certain technical limitations resulting in the assessment of only a restricted group of antioxidants [Citation1,Citation2]. TAC level also depends on the choice of test material, with differences in antioxidant content being present between body fluids; although TAC is usually assessed in blood serum or plasma, it also may be determined in saliva [Citation3], urine [Citation4] or in tear fluid [Citation5].
Human saliva is a mixture of gingival crevicular fluids with a composition similar to that of plasma/serum, which serves as the first line of defense against oxidative stress [Citation3,Citation6]. Saliva includes a large number of organic and inorganic compounds which influence health status. Its availability and non-invasive collection allow the diagnosis of numerous pathological conditions or diseases in the oral cavity and some systemic disorders [Citation7]. Uric acid (UA) is the most abundant antioxidant, non-enzymatic molecule of plasma origin in saliva, and its concentration in saliva is similar to that in serum [Citation3]. UA is a major contributor to both plasma TAC (60–80%) [Citation4,Citation8,Citation9] and salivary TAC (approximately 70%) [Citation10]. It is believed that non-urate (Nu)/ UA-independent TAC may provide more reliable information about antioxidant status than native TAC, which is strongly influenced by UA level; therefore, to negate the influence of UA, methods for Nu-TAC based on the uricase reaction have been proposed [Citation11].
The DPPH (2.2-diphenyl-1-picryl-hydrazyl) method is a promising approach that is being increasingly used in clinical studies for assessing TAC [Citation12]. This method measures the total activity of circulating low molecular weight antioxidants as the ability of acetonitrile-deproteinized plasma to decompose DPPH radicals. As the DPPH test has exhibited good compliance with the ferric reducing ability of serum test [Citation12], a modification of ferric reducing ability of plasma (FRAP) method [Citation8], the present study uses these two established methods to assess TAC simultaneously in plasma (DPPH and FRAP test) and in saliva (DPPHS – DPPH in saliva and FRAS test – ferric reducing ability of saliva). In addition, the same battery of tests is applied after eliminating the influence of UA from plasma (Nu-FRAP and Nu-DPPH) and saliva specimens (Nu-FRAS and Nu-DPPHS). The novelty of this study is its simultaneous assessment of native and Nu-TAC in plasma and saliva collected from the same group of subjects.
The aim of this study was to identify any relationships between the levels of native TAC, Nu-TAC and UA in plasma with their analogues in saliva in older subjects, and to compare the contribution of UA in both body fluids using two different assay methods. The confirmation of such a relationship might allow the replacement of existing plasma TAC measurement methods with non-invasive salivary native or non-urate TAC measurement; this would be particularly valuable when TAC indices/UA need to be repeatedly monitored at frequent intervals, for example, while assessing the effectiveness of pharmacotherapy in metabolic syndrome, or cardiovascular disorders related to hyperuricemia or gout. An additional aim of the study was to evaluate the effects of the applied pharmacotherapy on plasma and salivary TAC, Nu-TAC and UA values.
Materials and methods
Although 83 patients were initially included in the study, due to the failure by some patients to provide required volume of saliva/plasma in the sample or the presence of precipitates in the sample, complete data concerning different antioxidant parameters was only received from 55 subjects. The subjects were aged 56.0–77.0 years. They were selected from a group of patients of the Department of Geriatrics of the Medical University of Lodz (Poland) who voluntarily participated in the healthy lifestyle workshops organized under the governmental program for the Social Activity of the Elderly (2014–2020).
Some patients suffered from hypercholesterolemia (n = 31), arterial hypertension (n = 28), osteoarthritis (n = 24), osteoporosis (n = 14), duodenal and gastric conditions (n = 11), diabetes mellitus (n = 11) or heart failure (n = 7). All diagnosed diseases were in a stable phase and were pharmacologically controlled: the most common treatment choices were angiotensin-converting enzyme inhibitors (n = 17), statins (n = 16), levothyroxine (n = 16), diuretics (n = 13), aspirin (n = 10), beta-blockers (n = 10), calcium channel blockers (n = 7), proton pump inhibitors (n = 5) and the oral antidiabetic drugs metformin (n = 6) and sulfonylureas (n = 5). Only 12 individuals did not apply any drug treatment.
None of the subjects was diagnosed with tobacco addiction, active inflammatory processes (plasma C-reactive protein – CRP < 3 mg/L), renal dysfunction, disability or dementia. None followed any special diet. The study was approved by the local ethics committee (RNN/73/15/KE) and informed consent was obtained from each subject.
Study protocol and measurements
The examinations took place in the Department of Geriatrics and the laboratory measurements were performed in the Department of Clinical Physiology, in the Central Scientific Laboratory and in the University Hospital and Educational Centre, all at the Medical University of Lodz. The subjects reported to the centre between 8.00 and 10.00 a.m. after overnight fasting and rest for at least 12 hours before blood and saliva collection. The time window between cleaning teeth and unstimulated saliva sample collection was never shorter than 1.5 hours. A comprehensive assessment, including drug use, smoking and dietary habits, was performed with each subject [Citation13]. Height and weight were measured and the body mass index (BMI) was calculated.
Plasma TAC and Nu-TAC
Blood samples (±9 mL) were drawn from the antecubital vein and collected into Vacuette tubes. Thereafter the samples were incubated for 30 minutes at 37°C and then centrifuged (10 minutes, 4°C, 2 880 g). The resultant plasma samples were stored at –80°C, for not longer than 3 months [Citation12,Citation14,Citation15]. Plasma TAC measurements were performed using two spectrophotometric methods: FRAP [Citation8] with some modifications [Citation12], and the DPPH test [Citation12,Citation14]. The details of both methods are described elsewhere [Citation12,Citation16]. Both tests were executed with native plasma samples (containing UA) and pretreated with uricase and catalase (with decomposed UA), as described elsewhere [Citation15]. Plasma was incubated with 1.25 U/mL uricase and 25 U/mL catalase for 10 minutes at 37°C: 100 μL plasma for the FRAP test, and 200 μL plasma for the DPPH test. Catalase was added for rapid decomposition of H2O2, generated during uricase-catalyzed oxidation of UA by O2, to avoid the risk of suppression of plasma antioxidant activity.
Salivary TAC and Nu-TAC
The saliva samples (±5 mL) were centrifuged to separate all debris (10 minutes, 4°C, 1 125g) [Citation17]. The supernatant was stored at –80°C maximum for 30 days. Salivary TAC also was measured spectrophotometrically using the same equipment and methods as for plasma TAC: 120 μL of saliva were added to 900 μL of FRAS reagent, but deionized H2O2 was not used, and analysis was performed with an Ultrospec III spectrophotometer with Spectro-Kinetics software (LKB Biochrom Pharmacia, Cambridge, England). Nu-FRAS was analyzed as Nu-FRAP (120 μL of Nu-saliva were added to FRAS reagent).
For DPPHS test, as for DPPH [Citation12], 200 μL of saliva were required for the deproteinization process, but 25 μL of deproteinized saliva were added to 975 μL of DPPH reagent mixture for the individual assay. For the Nu-DPPHS analysis, 200 μL of saliva after deproteinization were incubated with 1.25 U/mL of uricase and 25 U/mL of catalase to eliminate UA. The procedure continued as in the DPPHS test.
To enhance data reliability, all results were calculated as a mean from three separate experiments. Additionally native and Nu-TAC assessment was performed within the same time frame.
Plasma and salivary UA
Plasma UA level was determined using a commercially-available diagnostic kit (BioMaxima S.A., Lublin, Poland). Salivary UA (SUA) was analyzed using the MaxDiscovery™ Uric Acid Assay Kit (Bio Scientific, Austin, U.S.A.); in this test, hydrogen peroxide, liberated by the action of uricase, reacts with a chromogenic dye using peroxidase to form a visibly colored (red) dye product. The absorbance was measured at 520 nm and the result was proportional to SUA concentration [Citation18].
UA/SUA contribution
The change in TAC after excluding UA or SUA was a measure of UA/SUA contribution (%) of plasma and salivary TAC.
Statistical analysis
The results were verified for normality of distribution and equality of variance. Variables that did not meet the assumption of normality were analyzed with non-parametric statistics. The Pearson product moment and Spearman correlations were used to determine the relationships between numerical variables. A One-Way Analysis of Variance (ANOVA) with the post hoc Bonferroni correction and the Kruskal–Wallis test were used to assess the impact of the applied pharmacotherapy on antioxidant parameters. The non-parametric paired sign test was used to compare the corresponding plasma and salivary values. Agreement between the corresponding plasma and salivary values was also examined using the Bland and Altman approach [Citation19]. The results for continuous variables were presented as mean ± SD. The level for statistical significance was set at P < 0.05. Statgraphics Centurion version XVII was used for statistical analysis.
Results
The study group consisted of 55 subjects, mean age 66.7 ± 4.5 years: 47 females and 8 males (66.4 ± 4.4 vs. 68.1 ± 5.0 years). The mean value of BMI was 29.1 ± 5.3 kg/m2. Over 1/3 of the group were diagnosed with obesity, and a further 0.38 of the group were overweight according to BMI values. Age was not related to TAC, but older subjects had higher SUA concentration (P = 0.03). The plasma antioxidant indices FRAP (P = 0.02) and DPPH (P = 0.04), as well as UA (P < 0.01), were higher in men.
presents plasma and salivary antioxidant indices. The salivary forms FRAS, Nu-TAC, Δ FRAS and SUA were higher than their plasma analogues. DPPHS and Δ DPPHS values were comparable with their plasma analogues. DPPHS was higher than DPPH by 1.98 (% reduction) or 8.5% of the relative value and Δ DPPHS was lower than Δ DPPH by 0.465%, or 0.61% of the relative value. The limits of agreement were –24.5 to 20.6% reduction for DPPHS and –26.4 to 27.3% for Δ DPPH. These limits of agreement were hence rather wide for both the comparable plasma and salivary values.
Table 1. Fasting plasma and salivary antioxidant concentration indices.
UA and SUA contribution
The contribution of SUA to salivary TAC was greater than UA to plasma TAC, but only when using the FRAP test (ΔTAC was significantly higher in saliva than in plasma: 71.6 ± 13.9% vs. 64.0 ± 8.1%; P < 0.001). When the DPPH test was used, SUA and UA contributions to salivary and plasma TAC were at a comparable level (75.2 ± 14.0% and 75.7 ± 10.3%, respectively) ().
Drug treatment vs. antioxidant indices
An analysis of the prospective impact of pharmacotherapy on plasma and salivary TAC was performed in sex- and age-matched subgroups. The results were predominantly negative and only a few, rather weak, differences in the levels of antioxidant indices were found: higher FRAP, UA and lower Nu-DPPH in patients receiving diuretics and lower DPPHS among those treated with statins (P < 0.05). No difference in antioxidant parameters was found between the patients receiving pharmacotherapy (n = 43) and those without (n = 12) (P > 0.05) ().
Table 2. Fasting salivary and plasma antioxidant concentration indices in group with (n = 43) and without pharmacotherapy (n = 12).
Plasma TAC vs. salivary TAC
A study of the cross-correlations between plasma antioxidant indices and their salivary countertypes revealed several, mostly relatively strong dependences. Patients with higher FRAP had significantly higher FRAS (P = 0.01), DPPHS (P = 0.02) and SUA (P = 0.003). Positive correlations were found also between DPPH and FRAS (P = 0.02), DPPHS (P = 0.02) and SUA (P = 0.0004). The subjects with higher plasma UA were characterized by higher SUA (P = 0.0007) and also higher FRAS (P = 0.02) and DPPHS (P = 0.04) (). Plasma and salivary TAC indices were also positively interrelated to each other within the given environment (FRAP to DPPH and FRAS to DPPHS; both P < 0.001) as well as to plasma UA/SUA ().
Figure 1. Correlations between DPPH/DPPHS and UA/SUA values (n = 55). DPPH: 2.2-diphenyl-1-picryl-hydrazyl test in plasma; DPPHS: 2.2-diphenyl-1-picryl-hydrazyl test in saliva, SUA: salivary uric acid; UA: uric acid in plasma.
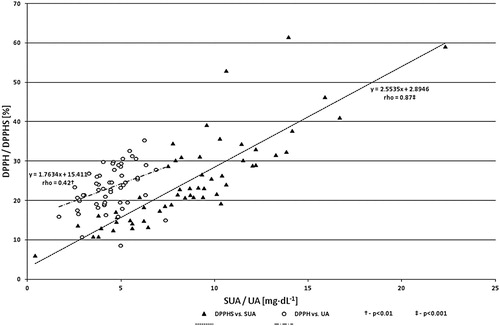
Table 3. Pearson product moment and Spearman rank correlations between plasma and salivary antioxidant indices.
Plasma Nu-TAC vs. salivary Nu-TAC
No correlations were found between plasma Nu-TAC (Nu-FRAP, Nu-DPPH) and salivary Nu-TAC parameters (Nu-FRAS, Nu-DPPHS), nor between UA and SUA ().
Discussion
Findings from studies on native plasma and salivary TAC are not conclusive. Our results showed a good agreement between salivary and plasma TAC and UA concentrations. Please note that, except for UA with SUA, the identified significant correlations were relatively not high. It may be assumed that antioxidants other than UA contributing to the TAC of saliva and plasma could result in the two body fluids exerting different activities, and the specificity of applied methods could also affect the result.
However, our findings do not preclude the use of saliva in diagnosing plasma native TAC, and it seems to be a promising analytical tool for plasma UA assessment. Also, SUA measurement was found to have equal value to plasma UA assay in a patient with chronic gouty arthropathy [Citation20]. SUA also showed good correlation with salivary TAC in hemodialyzed patients [Citation21]. However, in a case-control study by Lawaf et al. [Citation22] on patients with temporomandibular joint disorders, differences were observed between patients and controls in plasma TAC but not in salivary TAC. Also, while patients with generalized chronic and aggressive periodontitis had lower plasma TAC than healthy controls, salivary TAC was significantly lowered only in patients with chronic periodontitis [Citation23]. Conversely, both salivary and plasma TAC were decreased in erosive oral lichen planus patients in comparison with healthy subjects [Citation24]. In addition, in patients with recurrent aphthous stomatitis, individual salivary antioxidant activity (SOD, CAT) was higher and other (GSHPx) was lower than in healthy controls, while the opposite was the case for the enzymatic analogues in plasma. The authors suggest that the organism might mobilize antioxidant defense system at the sites where it was needed [Citation25].
SUA concentration has been reported to be similar to that of plasma UA [Citation26] and may change as a result of kidney disease [Citation27], gout [Citation28] or metabolic syndrome [Citation29]. UA is one of the organic, water-soluble components of saliva, which is secreted in acinar or ductal cells and transported into the salivary glands [Citation26]. UA is the terminal degradation product of purine catabolism. Plasma UA level can be regulated by intake of dietary purines, alcohol and fructose [Citation30], renal function [Citation4] or hyperinsulinemia [Citation31]. Our findings concerning the contribution of UA to plasma and to salivary TAC are in accordance with those of previous studies [Citation8,Citation10,Citation12]: ±75% of TAC using DPPH test and 64/72% using the FRAP/FRAS method.
The role of UA remains unclear: although it is a major determinant of antioxidant potential, its high level could be a causal, compensatory or coincidental risk factor in cardiovascular and renal diseases, gout, obesity or diabetes mellitus type 2 [Citation11,Citation16,Citation32,Citation33]. The approach of separating UA (or ascorbic acid) is not new [Citation33,Citation34]. The high TAC value associated with elevated plasma UA level may be misleading, masking a relative or absolute deficiency of other antioxidants. Benzie and Strain suggest that Nu-FRAP may offer a more sensitive index of antioxidant status in UA-rich fluid, such as plasma [Citation34]. However Nu-TAC is recommended in particular after nutritional interventions and in diseases associated with oxidative stress and hyperuricemia [Citation4]. On the other hand, as no single measure of antioxidant status is believed to be sufficient on its own, it is recommended that clinical studies use a battery of tests, including TAC, Nu-TAC and oxidative stress marker assessment [Citation35,Citation36].
In contrast to the present study, relatively few others examine the value of Nu-TAC fractions; in addition, the current study takes the rather unique approach of examining two biological fluids, plasma and saliva, at the same time, and measures native and non-urate TAC with two established methods concurrently. Even if UA-independent TAC is suggested to be a better approach in antioxidant status assessment, it is currently impossible to predict plasma Nu-TAC from salivary Nu-TAC, and salivary Nu-TAC cannot reflect native plasma TAC, at least based on FRAP or DPPH analysis. In this case, saliva appears to have little value. Likewise, several differences identified for TAC/UA indices between sex- and age-matched subgroups with different drug treatments, either in one body fluid, i.e. plasma or in saliva, were not confirmed in the other. This may suggest that different drugs have varying influences on plasma and salivary antioxidant potential, but further studies with larger numbers of patients are needed in this regard. On the other hand, no differences were found between the subgroup of apparently healthy subjects (without drug treatment) and the subgroup receiving pharmacotherapy with regard to TAC/UA parameters. The use of anti-hypertensives or the presence of diabetes mellitus type 2 have been found to have little effect on salivary TAC in the few previous studies in this area [Citation37,Citation38].
Some limitations of the present study should be acknowledged. Pharmacotherapy and its heterogeneity could interfere with the results. It was not feasible to find middle-aged/older subjects free from common age-related ailments or using similar drugs and treatment regimens. In addition, the study is based on a limited number of subjects and is of a cross-sectional nature.
We conclude that in older subjects, saliva has considerable value for predicting native plasma TAC, but not for Nu-TAC analogues. UA is a predominant contributor to both plasma and saliva TAC; however, this contribution is greater in saliva than in plasma according to FRAP, but not to DPPH. The choice of pharmacotherapy mostly did not affect plasma or salivary antioxidant indices. Further clinical studies with larger numbers of subjects are necessary to verify the possible clinical value of salivary TAC and Nu-TAC as indexes of plasma antioxidant defense, as well as the potential effects of drug treatment on antioxidant parameters.
Disclaimer statements
Contributors AGS, TK, FS, DN: conception and design; AGS, APP, AS, TK, DN: analysis and interpretation of the data; DN, TK, FS: critical revision of the article for important intellectual content; DN: final approval of the article; AS, AG: collection and assembly of data.
Funding This work was supported by the Medical University of Lodz under Grant no. 502-03/6-024-01/502-64-072 and partially by the Healthy Ageing Research Centre project under Grant REGPOT-2012-2013-1, 7FP.
Conflicts of interest The authors report no conflicts of interest.
Ethics approval None.
Acknowledgements
We would like to thank Andrzej Olczyk from the Department of Hygiene and Health Promotion for his assistance in material collection and transport, Hanna Jerczyńska PhD from the Central Scientific Laboratory, Alina Prylińska MD and Anna Piłat PhD from the University Hospital and Educational Center, for their laboratory analysis support, as well as for the assistance of the Department of Geriatrics medical staff, all at the Medical University of Lodz. We would also like to thank mgr. Edward Lowczowski of the Medical University of Lodz for language assistance.
Disclosure statement
No potential conflict of interest was reported by the authors.
References
- Sies H. Total antioxidant capacity: appraisal of a concept. J Nutr. 2007;137(6):1493–1495. doi: 10.1093/jn/137.6.1493
- Vassalle C, Masini S, Carpeggiani C, et al. In vivo total antioxidant capacity: comparison of two different analytical methods. Clin Chem Lab Med. 2004;42(1):84–89 doi: 10.1515/CCLM.2004.016
- Battino M, Ferreiro MS, Gallardo I, et al. The antioxidant capacity of saliva. J Clin Periodontol. 2002;29(3):189–194. doi: 10.1034/j.1600-051X.2002.290301x.x
- Peluso I, Raguzzini A. Salivary and urinary total antioxidant capacity as biomarkers of oxidative stress in humans. Patholog Res Int. 2016;2016:5480267. DOI:10.1155/2016/5480267.
- Kowalski M, Bielecka-Kowalska A, Bielecka-Roszkiewicz K, et al. Ferric reducing ability of tears in healthy subjects-diurnal variation and dependence on defined demographic data. Curr Eye Res. 2009;34(5):333–339. doi: 10.1080/02713680902815268
- Greabu M, Battino M, Mohora M, et al. Could constitute saliva the first line of defence against oxidative stress? Rom J Intern Med. 2007;45(2):209–213.
- Buczko P, Zalewska A, Szarmach I. Saliva and oxidative stress in oral cavity and in some systemic disorders. J Physiol Pharmacol. 2015;66(1):3–9.
- Benzie IF, Strain JJ. The ferric reducing ability of plasma (FRAP) as a measure of “antioxidant power": the FRAP assay. Anal Biochem. 1996;239(1):70–76. doi: 10.1006/abio.1996.0292
- Ghiselli A, Serafini M, Maiani G, et al. A fluorescence-based method for measuring total plasma antioxidant capability. Free Radic Biol Med. 1995;18(1):29–36. doi: 10.1016/0891-5849(94)00102-P
- Moore S, Calder KA, Miller NJ, et al. Antioxidant activity of saliva and periodontal disease. Free Radic Res. 1994;21(6):417–425. doi: 10.3109/10715769409056594
- Duplancic D, Kukoc-Modun L, Modun D, et al. Simple and rapid method for the determination of uric acid-independent antioxidant capacity. Molecules. 2011;16(8):7058–7068 doi: 10.3390/molecules16087058
- Chrzczanowicz J, Gawron A, Zwolinska A, et al. Simple method for determining human serum 2,2-diphenyl-1-picryl-hydrazyl (DPPH) radical scavenging activity - possible application in clinical studies on dietary antioxidants. Clin Chem Lab Med. 2008;46(3):342–349 doi: 10.1515/CCLM.2008.062
- Stelmach W, Kaczmarczyk-Chalas K, Bielecki W, et al. The impact of income, education and health on lifestyle in a large urban population of Poland (Cindi programme). Int J Occup Med Environ Health. 2004;17(3):393–401.
- Schlesier K, Harwat M, Bohm V, et al. Assessment of antioxidant activity by using different in vitro methods. Free Radic Res. 2002;36(2):177–187. doi: 10.1080/10715760290006411
- Prymont-Przyminska A, Zwolinska A, Sarniak A, et al. Consumption of strawberries on a daily basis increases the non-urate 2,2-diphenyl-1-picryl-hydrazyl (DPPH) radical scavenging activity of fasting plasma in healthy subjects. J Clin Biochem Nutr. 2014;55(1):48–55. doi: 10.3164/jcbn.13-93
- Gawron-Skarbek A, Chrzczanowicz J, Kostka J, et al. Cardiovascular risk factors and total serum antioxidant capacity in healthy men and in men with coronary heart disease. Biomed Res Int. 2014;2014: 1–8. DOI:10.1155/2014/216964.
- Navazesh M. Methods for collecting saliva. Ann N Y Acad Sci. 1993;694:72–77. doi: 10.1111/j.1749-6632.1993.tb18343.x
- Giebułtowicz J, Wroczyński P, Samolczyk-Wanyura D. Comparison of antioxidant enzymes activity and the concentration of uric acid in the saliva of patients with oral cavity cancer, odontogenic cysts and healthy subjects. J Oral Pathol Med. 2011;40(9):726–730. doi: 10.1111/j.1600-0714.2011.01045.x
- Bland JM, Altman DG., et al. Statistical methods for assessing agreement between two methods of clinical measurement. Lancet. 1986;1(8476):307–310 doi: 10.1016/S0140-6736(86)90837-8
- Zhao J, Huang Y. Salivary uric acid as a noninvasive biomarker for monitoring the efficacy of urate-lowering therapy in a patient with chronic gouty arthropathy. Clin Chim Acta. 2015;450:115–120. doi: 10.1016/j.cca.2015.08.005
- Meucci E, Littarru C, Deli G, et al. Antioxidant status and dialysis: plasma and saliva antioxidant activity in patients with fluctuating urate levels. Free Radic Res. 1998;29(5):367–376. doi: 10.1080/10715769800300411
- Lawaf S, Azizi A, Tabarestani T., et al. Comparison of serum and salivary antioxidants in patients with temporomandibular joint disorders and healthy subjects. J Dent (Tehran). 2015;12(4):263–270
- Baser U, Gamsiz-Isik H, Cifcibasi E, et al. Plasma and salivary total antioxidant capacity in healthy controls compared with aggressive and chronic periodontitis patients. Saudi Med J. 2015;36(7):856–861. doi: 10.15537/smj.2015.7.11954
- Azizi A, Farshchi F. Comparison of salivary and plasma antioxidant levels in lichen planus patients and healthy subjects. J Oral Pathol Med. 2012;41(7):524–526.
- Karincaoglu Y, Batcioglu K, Erdem T, et al. The levels of plasma and salivary antioxidants in the patient with recurrent aphthous stomatitis. J Oral Pathol Med. 2005;34(1):7–12. doi: 10.1111/j.1600-0714.2004.00253.x
- Nunes LA, Mussavira S, Bindhu OS. Clinical and diagnostic utility of saliva as a non-invasive diagnostic fluid: a systematic review. Biochem Med (Zagreb). 2015;25(2):177–192. doi: 10.11613/BM.2015.018
- Cardoso EM, Arregger AL, Tumilasci OR, et al. Assessment of salivary urea as a less invasive alternative to serum determinations. Scand J Clin Lab Invest. 2009;69(3):330–334. doi: 10.1080/00365510802588076
- Owen-Smith B, Quiney J, Read J. Salivary urate in gout, exercise, and diurnal variation. Lancet. 1998;351(9120):1932. DOI:10.1016/S0140-6736(05)78616-5.
- Soukup M, Biesiada I, Henderson A, et al. Salivary uric acid as a noninvasive biomarker of metabolic syndrome. Diabetol Metab Syndr. 2012;4(1):14. DOI:10.1186/1758-5996-4-14.
- Emmerson BT. The management of gout. N Engl J Med. 1996;334(7):445–451. doi: 10.1056/NEJM199602153340707
- Quiñones Galvan A, Natali A, Baldi S, et al. Effect of insulin on uric acid excretion in humans. Am J Physiol. 1995;268(1 Pt 1):E1–E5.
- Lippi G, Montagnana M, Franchini M, et al. The paradoxical relationship between serum uric acid and cardiovascular disease. Clin Chim Acta. 2008;392(1–2):1–7. doi: 10.1016/j.cca.2008.02.024
- Nälsén C, Ohrvall M, Kamal-Eldin A, et al. Plasma antioxidant capacity among middle-aged men: the contribution of uric acid. Scand J Clin Lab Invest. 2006;66(3):239–248. doi: 10.1080/00365510600590423
- Benzie IF, Strain JJ. Ferric reducing/antioxidant power assay: direct measure of total antioxidant activity of biological fluids and modified version for simultaneous measurement of total antioxidant power and ascorbic acid concentration. Methods Enzymol. 1999;299:15–27. doi: 10.1016/S0076-6879(99)99005-5
- Bartosz G. Non-enzymatic antioxidant capacity assays: limitations of use in biomedicine. Free Radic Res. 2010;44(7):711–720. doi: 10.3109/10715761003758114
- Prior RL, Cao G. In vivo total antioxidant capacity: comparison of different analytical methods. Free Radic Biol Med. 1999;27(11–12):1173–1181. doi: 10.1016/S0891-5849(99)00203-8
- Djukić LJ, Roganović J, Brajović MD, et al. The effects of anti-hypertensives and type 2 diabetes on salivary flow and total antioxidant capacity. Oral Dis. 2015;21(5):619–625. doi: 10.1111/odi.12325
- Gümüş P, Buduneli N, Cetinkalp S, et al. Salivary antioxidants in patients with type 1 or 2 diabetes and inflammatory periodontal disease: a case-control study. J Periodontol. 2009;80(9):1440–1446. doi: 10.1902/jop.2009.090159