
ABSTRACT
Objective: To explore the impact of oxidative insults on mitochondrial dynamics. In mammalian cells, oxidative insults activate stress response pathways including inflammation, cytokine secretion, and apoptosis. Intriguingly, mitochondria are emerging as a sensitive network that may function as an early indicator of subsequent cellular stress responses. Mitochondria form a dynamic network, balancing fusion, mediated by optic atrophy-1 (OPA1), and fission events, mediated by dynamin-related protein-1 (DRP1), to maintain homeostasis.
Methods: Here, we examine the impact of oxidative insults on mitochondrial dynamics in 143B osteosarcoma and H9c2 cardiomyoblast cell lines via confocal microscopy, flow cytometry, and protein-based analyses.
Results: When challenged with hydrogen peroxide (H2O2), a ROS donor, both cell lines display fragmentation of the mitochondrial network and loss of fusion-active OPA1 isoforms, indicating that OPA1-mediated mitochondrial fusion is disrupted by oxidative damage in mammalian cells. Consistent with this, cells lacking OMA1, a key protease responsible for cleavage of OPA1, are protected against OPA1 cleavage and mitochondrial fragmentation in response to H2O2 challenge.
Discussion: Taken together, these findings indicate that oxidative insults damage OPA1-mediated mitochondrial dynamics in mammalian cells via activation of OMA1, consistent with an emerging role for mitochondrial dynamics as an early indicator of cellular stress signaling.
Abbreviations: Δψm: transmembrane potential; ROS: reactive oxygen species; H2O2: hydrogen peroxide; OPA1: optic atrophy-1; MFN1: mitofusin1; DRP1: dynamin-related protein 1; DMEM: Dulbecco’s Modified Eagle’s Medium; PBS: phosphate buffer saline; TOM20: translocase of the outer mitochondrial membrane-20; DAPI: diaminophenylindole; TMRE: tetramethylrhodamine ethyl ester; TBST: Tris-Buffered Saline Tween-20; MEF: mouse embryonic fibroblast.
1. Introduction
Oxidative insults activate critical cellular stress response pathways, with severe outcomes including inflammation, proinflammatory cytokine secretion, and apoptosis. Oxidative stressors such as H2O2 cause apoptosis via activation of apoptosis-inducing factor (AIF) and caspase-3 [Citation1,Citation2], resulting in decreased cell viability [Citation3]. H2O2 also engages inflammatory signaling, activating the inflammasome via induction of NLRP3 and subsequent secretion of proinflammatory cytokines including IL-1Β [Citation4,Citation5]. As such, oxidatively induced inflammation and apoptosis is a key mechanism in the pathogenesis of prevalent diseases including diabetes and cardiovascular disease [Citation6]. Strikingly, the GTPase factors that direct mitochondrial fission/fusion dynamics play mechanistic roles in inflammatory and apoptotic signaling. OPA1 mediates fusion of the mitochondrial inner membrane [Citation7] under control of the OMA1 metalloprotease [Citation8,Citation9], while DRP1 drives the opposing process of mitochondrial fission by actin-mediated recruitment to the outer mitochondrial membrane, followed by constriction and division of mitochondria [Citation10,Citation11]. Loss of either OPA1 or DRP1 severely disrupts mitochondrial dynamics, but also activates inflammatory signaling [Citation12,Citation13] via the NLRP3 inflammasome [Citation4,Citation6]. Mitochondrial dynamics, mediated by OPA1 and DRP1, thus maintain mitochondria as a highly sensitive cellular stress response network. To explore the impact of oxidative insults on mitochondrial dynamics as a general mechanism, we employ two cell lines, H9c2 cardiomyoblasts and 143B osteosarcomas, with very different origins and metabolic settings.
OPA1 and DRP1, along with other interacting fusion and fission factors, work cooperatively to maintain mitochondria as a highly responsive, dynamic organellar network with a high degree of interconnection. In response to stresses such as loss of mitochondrial transmembrane potential (Δψm), however, the network collapses to a fragmented state, existing as a population of spherical organelles [Citation14]. Mitochondrial fission/fusion balance thus requires coordination of multiple interacting factors. Outer membrane fusion is accomplished by mitofusin 1 (MFN1) and mitofusin 2 (MFN2) [Citation15], while fusion of the inner membrane is mediated by OPA1. OPA1 is expressed in multiple isoforms, in which long (L-OPA1) isoforms mediate fusion of the inner membrane [Citation7,Citation16] and maintain inner membrane structure [Citation17]. Conversely, mitochondrial fission, which produces a collection of disconnected spherical organelles, is accomplished by actin-mediated recruitment of DRP1 to the mitochondria [Citation10], where it is bound by Fis1, MFF1, MiD49, and MiD51 [Citation11,Citation18,Citation19], promoting formation of a DRP1 multimeric ‘collar’ for membrane scission [Citation20,Citation21] with Dyn2 [Citation22]. Fission and fusion pathways directly interact: short OPA1 (S-OPA1) isoforms can activate mitochondrial fission [Citation23], while DRP1 stabilizes L-OPA1 isoforms [Citation24,Citation25]. These dynamics have a hand-in-hand relationship with bioenergetic function: L-OPA isoforms are fusion-active, while loss of Δψm causes cleavage to fusion-inactive S-OPA1 [Citation7], mediated by OMA1 [Citation8,Citation9]. Decreased Δψm also activates fission [Citation26] via DRP1 dephosphorylation [Citation27]. It is unclear, however, how oxidative insults affect this highly sensitive, dynamic organellar network. Here, we explore the impact of oxidative insults on mitochondrial fission/fusion dynamics as an early indicator of cellular stress.
2. Materials and methods
2.1. Cell culture
Human 143B osteosarcoma cells FLP6a39.2 (gift of Eric Schon, Columbia University, New York, NY, USA) and H9c2 cardiomyoblast (ATCC, Manassas, VA, USA) were grown in Dulbecco’s Modified Eagle’s Medium (DMEM) with 10% fetal bovine serum supplemented with 50 µg/mL uridine in 5% CO2 at 37°C. Cells were treated with 200 or 400 µM H2O2 for 1 h.
2.2. Fluorescence microscopy
Coverslips were fixed in 4% paraformaldehyde overnight at 4°C and blocked with 10% Normal Goat Serum (NGS) followed by anti-TOM20 antibody (1:100 dilution, Santa Cruz Biotechnology, Dallas, TX, USA) or DLP1 (1:500 dilution, BD Transduction 611112, San Jose, CA, USA) and AlexaFluor 488 goat anti-rabbit or goat anti-mouse antibody (1:100 dilution, Invitrogen Molecular Probes, Eugene, OR, USA). Slides were viewed on a Fluoview (FV10i) Olympus Confocal Microscope (Olympus America Inc., Melville, NY, USA) with a 60× UPLSAP60xW objective with 1.0 aperture and 3× optical zoom at room temperature.
2.3. Flow cytometry
Cells (∼106 cell/dish) were treated with H2O2 for 40 min., incubated with 100 nM Tetramethylrhodamine, Ethyl Ester, Perchlorate (TMRE) (Invitrogen Molecular Probes, Eugene, OR) without or with H2O2 for 20 min and analyzed on a BD Biosciences Facscalibur (BD Biosciences, San Jose, CA, USA).
2.4. Western blotting
Cells were lysed in ice-cold Laemmli buffer containing 2-mercaptoethanol, run on a 6% polyacrylamide gel, and transferred to PVDF (Bio-Rad, Hercules, CA, USA). Membranes were incubated with primary antibodies overnight at 4°C, then incubated with secondary antibody, developed using WestDura (ThermoFisher, Waltham, MA, USA), and scanned using Gel Doc™ XR+ Gel Documentation System (Bio-Rad, Hercules, CA, USA). Antibodies: OPA1, 1:500 dilution (BD Transduction 612606, San Jose, CA, USA), DLP1, 1:1000 dilution (BD Transduction 611112, San Jose, CA, USA), anti-α tubulin, 1:1000 dilution (Sigma T6074, St. Louis, MO, USA) and goat anti-mouse poly-HRP secondary antibody, 1:3000 dilution (ThermoFisher 32230, Waltham, MA, USA).
2.5. Quantitative RT–PCR
For qRT-PCR, cells were grown in 100 mm dishes and treated with H2O2 for 1 h. Total RNA was prepared using the Qiagen RNeasy kit to generate cDNA using Superscript Reverse Transcriptase II (Invitrogen, Carlsbad, CA, USA). Samples were analyzed using SYBR green and the Eco Illumina Real-time system (Illumina, San Diego, CA, USA). Expression levels were normalized to actin. The oligonucleotide sequences used were: DRP1 forward primer ATGGCAACATCAGAGGCACT, DRP1 reverse primer TGGAATAACCCTTCCCATCA.
2.6. Quantitation of morphology and statistical analysis
To assess mitochondrial morphology, confocal images were used to quantitate both mitochondrial circularity and interconnection via ImageJ, per the method of Dagda et al. [Citation28]. High-resolution images (for examples, see detail images, (A,B)) were analyzed using the Mitochondrial Morphology macro with ImageJ (publicly available at http://imagejdocu.tudor.lu/doku.php?id=plugin:morphology:mitochondrial_morphology_macro_plug-in:start). The circularity value describes the average circularity of all mitochondria in the image, where a perfect circle = 1.0. Interconnectivity is calculated from the average area/perimeter for all mitochondria in the image. Reported values were averages for n = 25 images of each sample, generated via blinded analysis, and statistically analyzed. All results expressed as mean ± SEM. P-values below .05 were statistically significant.
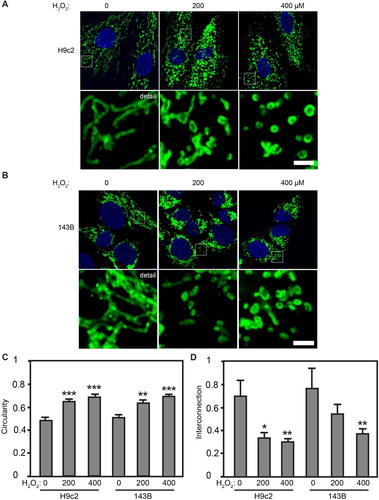
Figure 1. Oxidative stress causes mitochondrial fragmentation. Confocal microscopy of H9c2 (A) and 143B cells (B) immunolabeled for mitochondrial TOM 20 (green), with nuclei stained with DAPI (blue). (C, D) Quantification of mitochondrial morphology parameters for H9c2 and 143B lines. Circularity measures the average value per high-resolution micrograph (see detail images in A, B above for representative examples). Interconnection measures the average area/perimeter/mitochondrial profile per micrograph. n = 25, ±SE. *Significant at P < .05, **significant at P < .01, ***significant at P < .0001, one-way ANOVA followed by Tukey post hoc test.
3. Results
3.1. H2O2 causes mitochondrial fragmentation in H9c2 and 143B cells
As a mitochondrially localized protein, TOM20 provides a useful marker of mitochondrial organization via immunofluorescence confocal microscopy (Suppl. Fig. 1A). When viewed by anti-TOM20 immunofluorescence, untreated H9c2s showed a mix of both mitochondrial fission and fusion. When challenged with 200 μM H2O2, however, mitochondria were largely fragmented, while at 400 μM H2O2, H9c2s showed near-total mitochondrial fragmentation ((A)). Similarly, untreated 143Bs showed both interconnected and fragmented mitochondria, while 200 and 400 μM H2O2 caused extensive mitochondrial fragmentation ((B)). ImageJ quantitation confirmed this: when quantitating mitochondrial circularity and interconnection, untreated H9c2s showed a circularity value of 0.488 ± 0.03, compared with significantly increased mitochondrial circularity in H9c2s treated with 200 μM H2O2 (0.655 ± 0.02) and 400 μM H2O2 (0.695 ± 0.02) ((C)). The increased circularity of mitochondria in H2O2-treated H9c2s is mirrored by the loss of mitochondrial interconnection (200 μM H2O2: 0.337 ± 0.04, 400 μM H2O2: 0.306 ± 0.03) compared with untreated H9c2s (0.699 ± 0.14) ((D)). Consistent with this, quantitation of 143Bs showed that H2O2 elicits mitochondrial fragmentation: untreated 143Bs have a mitochondrial circularity value of 0.512 ± 0.03, while H2O2 caused a significant increase in circularity at 200 μM (0.643 ± 0.02) and 400 μM H2O2 (0.695 ± 0.02) ((C)). 143B cells treated with 400 μM H2O2 also showed a significant decrease in mitochondrial interconnection compared with untreated 143Bs (0.376 ± 0.04 versus 0.767 ± 0.12) ((D)). To examine whether the use of high glucose DMEM skewed our results, we examined mitochondrial morphology of both H9c2 and 143B cells in high glucose (25 mM) and normoglycemic (5 mM) media. Neither H9c2s nor 143Bs had apparent differences in mitochondrial morphology between the two glucose concentrations (Suppl. Fig. 1B); the statistically equivalent mitochondrial circularity values for each, as determined by Image J, confirmed this (Suppl. Fig. 1C). Taken together, these results show that H2O2-induced oxidative stress causes fragmentation of the mitochondrial network in both cell lines.
3.2. Differential effects of H2O2 on Δψm in cardiomyoblast and osteosarcoma cells
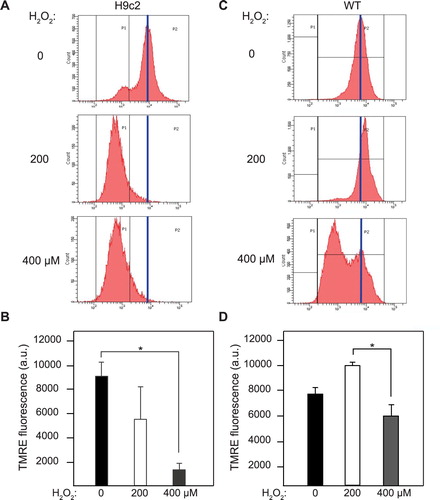
Δψm was assayed via TMRE flow cytometry, as previously [Citation25,Citation29]. As a Nernstian dye, TMRE accumulates reversibly in mitochondria with an active Δψm. In representative histograms, untreated H9c2s maintain a peak near 104 arbitrary fluorescence units (au) (blue line), while H2O2-treated H9c2s show dramatic left-shifts in peak TMRE ((A)). Untreated H9c2s maintained an average TMRE of 9031 ± 1189 a.u., while H9c2s treated with 400 µM H2O2 showed a significantly lower TMRE of 1306 ± 532 a.u. ((B)). These results contrasted with 143Bs: untreated 143Bs show a single peak, while 143B cells treated with 400 μM H2O2 show a bimodal distribution, with a second peak showing a distinct left-shift ((C)). As average TMRE was calculated for all events (no gating), no significant difference was found between the untreated and H2O2-treated 143Bs ((D)). The bimodal distribution found in H2O2-treated 143B cells indicates that two subpopulations exist, possibly reflecting differences in cell cycle requirements for mitochondrial bioenergetics; however, this remains to be explored in detail. Collectively, these results demonstrate that identical oxidative stresses may have distinct impacts on different cell types, depending on their specific metabolic and bioenergetics demands.
Figure 2. Differential impacts of oxidative stress on Δψm. Δψm measured by TMRE flow cytometry in H9c2 (A) and 143B (C) lines. Peak TMRE fluorescence represented by vertical blue line. Average TMRE in H9c2 (B) and 143B (D) lines, ±SE. n ≥ 3 experiments, 30,000 cells assayed per experiment. *Significant at P < .05.
3.3. DRP1 levels are not increased in response to H2O2 challenge in either H9c2 or 143B cell lines
The fragmentation observed in clearly demonstrates a disruption of mitochondrial dynamics. We next sought to determine the mechanism behind the observed mitochondrial fragmentation, hypothesizing that increased levels of DRP1 could be causing fragmentation through increased mitochondrial fission. To explore this, we examined the levels of DRP1 transcripts in both cell lines after 1 or 4 h of treatment with 400 μM H2O2. Strikingly, neither H9c2s or 143Bs showed a significant increase in DRP1 mRNA in response to H2O2 treatment: relative DRP1 expression (normalized to actin) of 143B cells at 1 h (1.17 ± 0.3) and 4 h (1.01 ± 0.2) were statistically equivalent to untreated 143Bs (1.05 ± 0.3), while H9c2 cells at 4 h (0.739 ± .06) were decreased relative to untreated H9c2s (1.08 ± .07) ((A)). We next examined whether DRP1 protein levels changed in response to H2O2. However, Western blotting did not show increased DRP1 in H9c2s or 143Bs treated with for 1 h at 200 or 400 μM H2O2 ((B)). Quantification of DRP1 Western blot signal confirms this: neither H9c2 nor 143B cells showed any significant increase in DRP1 signal (normalized to tubulin loading control) when challenged with H2O2 ((C)).
Figure 3. DRP1 expression in cells is not affected by oxidative stress. (A) qRT-qPCR of DRP1 mRNAs in H9c2s and 143Bs at 0, 1, and 4 h. Treatment with 400 μM H2O2, ±SE. **statistically significant, P < .01. (B) Anti-DRP1 Western blotting of H9c2 cells, without and with 1 h H2O2. DRP1 and α-tubulin labeled as indicated. (C) ImageJ quantification of DRP1 Westerns. No significant difference observed. ±SE. (D) Microscopy of H9c2 and 143B cells immunolabeled for DRP1 (green) and Mitotracker (red), nuclei labeled with DAPI (cyan). Size bar = 2 μm. (E) Confocal microscopy of HCT116 control and DRP1 KO cell lines immunolabeled for TOM20 (green) and DAPI (cyan). Size bar = 2 μm. (F) Quantification of mitochondrial morphology parameters for HCT116 control and DRP1 KO cell lines immunolabeled in (E). ***significant at P < .0001, one-way ANOVA followed by Tukey post hoc test.
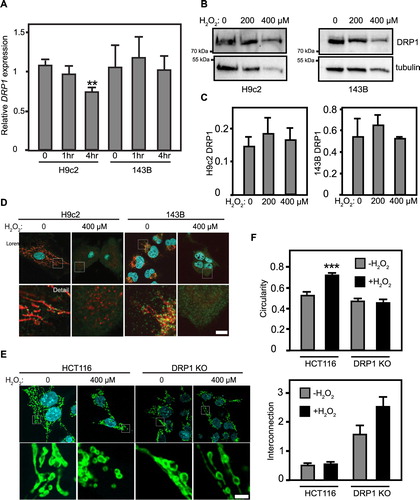
Alternately, existing DRP1 could be more strongly recruited to H9c2 mitochondria. Anti-DRP1 immunofluorescence of untreated H9c2s shows that DRP1 is concentrated at discrete foci along the mitochondria. Intriguingly, H2O2-treated cells show a diffuse distribution, with a more pervasive cytosolic distribution ((D)). Comparison side-by-side with DRP1 knockout cells (not shown) indicates that this diffuse DRP1 signal in H2O2-treated H9c2s reflects a genuine redistribution of DRP1. 143B cells yielded similar results: untreated 143B cells revealed DRP1 at discrete foci along the mitochondria, while H2O2-treated cells show a more diffuse overall distribution within the cell ((D)). Though intriguing, these results do not demonstrate increased DRP1 foci at mitochondria in response to H2O2.
To directly test DRP1’s requirement in H2O2-mediated mitochondrial fragmentation in a genetically clean model, we next examined HCT116 colorectal carcinoma cells with (control) or lacking DRP1 (DRP1 KO). These cells allow a direct interrogation of DRP1’s role, as a complementary approach to the experiments above in H9c2 and 143B cell lines. While HCT116s showed the expected balance of mitochondrial fission and fusion, H2O2-challenged HCT116s displayed near-total mitochondrial fragmentation. Conversely, DRP1 KO cells show extensive mitochondrial interconnection, consistent with a lack of DRP1-mediated fission. Strikingly, H2O2-treated DRP1 KO cells strongly retain mitochondrial interconnection, in contrast to the massive fragmentation shown in H2O2-treated control cells ((E)). ImageJ analysis of mitochondrial circularity confirmed this, showing that HCT116 control cells significantly increased mitochondrial circularity when challenged with H2O2, while DRP1 KO cells do not ((F)). Thus, while DRP1 levels and mitochondrial recruitment do not appear to increase in response to H2O2 treatment in H9c2 and 143B cell lines, it remains possible that DRP1 plays a contributing role in oxidatively induced mitochondrial fragmentation. However, as DRP1-mediated fission is mechanistically opposed by OPA1-mediated mitochondrial fusion, we next examined OPA1 as a potential target of H2O2-mediated oxidative stress.
3.4. H2O2 challenge causes L-OPA1 cleavage in both H9c2 cardiomyoblasts and 143B osteosarcoma cells
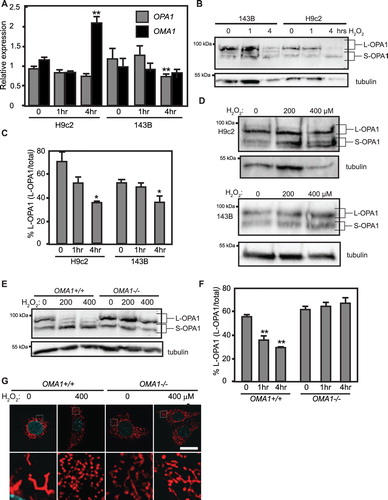
To examine the involvement of OPA1 and its Δψm-sensitive protease OMA1 in H2O2-mediated mitochondrial fragmentation, we examined the levels of OPA1 and OMA1 mRNA transcripts after 1 and 4 h of H2O2 challenge. H9c2 cardiomyoblast OPA1 expression (normalized to actin) did not show a significant change in response to H2O2; 143B cells showed a decrease in OPA1 expression after 4 h of H2O2 ((A)). 143B cells did not show any change in OMA1 levels in response to H2O2. Intriguingly, H9c2 cells showed a robust 2-fold increase in OMA1 expression after 4 h of H2O2 treatment ((A)). To examine whether the fusion-active L-OPA1 isoforms were affected by H2O2 challenge, we examined the OPA1 isoforms present in control and H2O2-treated cell lysates. OPA1 exists as five different isoforms (a, b, c, d, and e). Δψm-sensitive inner membrane fusion is mediated by the a and b long isoforms (L-OPA1), while the short c, d, and e isoforms (S-OPA1) are fusion-inactive [Citation7]. Constitutive proteases including YME1L result in steady-state production of S-OPA1 isoforms [Citation30]. Upon loss of Δψm, L-OPA1 isoforms are cleaved by OMA1 [Citation8,Citation9]. OPA1 blotting of untreated H9c2 and 143B lysates revealed the expected balance of both L-OPA1 and S-OPA1. In response to 4 h of H2O2 treatment, however, L-OPA1 bands were lost: while untreated 143B and H9c2 cells showed a robust major band in the L-OPA1 isoforms, this was lost in the 4 h H2O2 lysates ((B)), indicating that L-OPA1 was cleaved to S-OPA1 in response to H2O2. ImageJ quantification confirmed this: L-OPA1 levels in untreated H9c2 (71 ± 11%) and 143B (52 ± 2%) lysates were significantly greater than in 4 h H2O2-treated lysates for both H9c2 (36 ± 1.4%) and 143B (36 ± 5%) cell lines ((C)). These findings confirm that fusion-active L-OPA1 is lost in both cell lines in response to H2O2 challenge. We next examined lysates of both cell lines treated for 1 h with 200 and 400 μM H2O2. In H9c2 cells, H2O2 treatment appears to cause an accumulation of S-OPA1 isoforms relative to untreated controls. 143B cells showed no appreciable differences ((D)); these observations were confirmed by ImageJ quantification (not shown). Taken together, these results indicate that while overall expression of OPA1 does not increase in response to H2O2 challenge, both H9c2 and 143B cell lines show loss of L-OPA1 isoforms in response to H2O2 treatment. As OMA1 is the major inducible OPA1 protease [Citation8,Citation9], we next examined whether OMA1 is required for H2O2-mediated L-OPA1 cleavage and mitochondrial fragmentation.
Figure 4. Impacts of oxidative insults on OPA1 and OMA1. (A) qRT-PCR of OPA1 and OMA1 mRNAs in H9c2s 143Bs at 0, 1, and 4 h. treatment with 400 μM H2O2, ±SE. **statistically significant from corresponding untreated sample, P < .01. (B) Anti-OPA1 Western blotting of H9c2s and 143Bs at 0, 1, and 4 h. treatment with 400 μM H2O2. L- and S-OPA1 isoforms labeled as indicated. (C) ImageJ quantification of L-OPA1 levels in (B), n = 3. *Significant at P < .05, one-way ANOVA followed by Tukey post hoc test. (D) Anti-OPA1 blotting of cells treated with H2O2 for 1 h at indicated concentrations. (E) Anti-OPA1 blotting of OMA1+/+ and −/− cells treated with H2O2 for 4 h at indicated concentrations. (F) ImageJ quantification of L-OPA1 levels in (E), n = 3. **statistically significant from corresponding untreated sample, P < .01., one-way ANOVA followed by Tukey post hoc test. (G) Confocal microscopy of OMA1+/+ and OMA1−/− MEFs without or with H2O2. n = 3 experiments. Size bar = 10 μm.
3.5. Cells lacking OMA1 are protected against H2O2-mediated OPA1 cleavage and mitochondrial fragmentation
The mitochondrial fragmentation () and loss of L-OPA1 ((B,C)), as well as the robust upregulation of OMA1 in H2O2-treated H9c2s ((A)), strongly suggest that OMA1 plays a major role in H2O2-mediated disruption of mitochondrial dynamics. To directly test whether OMA1 is required, we examined mouse embryonic fibroblast (MEFs) containing (OMA1+/+) or lacking (OMA1−/−) the OMA1 gene. Western blotting of control OMA1+/+ cells revealed the expected balance of L-OPA1 and S-OPA1 isoforms, with a robust band for the L-OPA1 b isoform. In response to treatment with 200 or 400 μM H2O2, however, L-OPA1 was visibly lost compared to untreated controls. Strikingly, however, OMA1−/− cells showed robust L-OPA1 in control and H2O2-treated lysates ((E)). ImageJ quantification confirmed that OMA1+/+ cells showed highly significant decreases in L-OPA1 in response to H2O2, while OMA1−/− cells showed no difference in L-OPA1 levels between untreated controls and H2O2-treated samples ((F)). Under confocal microscopy, untreated OMA1+/+ MEFs had predominantly interconnected mitochondria, as visualized by MitoTracker. When challenged with H2O2, however, control MEFs showed near-total mitochondrial fragmentation ((G)). Conversely, OMA1−/− MEFs challenged with 200 or 400 μM H2O2 maintained readily apparent mitochondrial interconnection ((G)). These experiments show that cells lacking OMA1 do not display the H2O2-mediated mitochondrial fragmentation and L-OPA1 cleavage effects observed above. Taken together, these findings strongly suggest that OMA1 is activated in response to oxidative insult in cultured cells.
4. Discussion
Here, we show that H2O2-mediated oxidative stress disrupts mitochondrial dynamics in both H9c2 cardiomyoblasts and 143B osteosarcomas, causing fragmentation of the mitochondrial network and cleavage of fusion-active L-OPA1 isoforms. Moreover, cells lacking the OMA1 metalloprotease are protected from these impacts, retaining L-OPA1 and mitochondrial interconnection under H2O2 challenge. These findings support a role for OMA1 as a key sensor of oxidative impacts on mitochondrial dynamics, and suggest that OPA1-mediated mitochondrial fusion may be a critical early indicator of oxidative stress for subsequent cellular stress signaling.
Despite their different backgrounds, H2O2 causes extensive mitochondrial fragmentation in both 143B osteosarcomas and H9c2 cardiomyoblasts, with striking effects on both mitochondrial circularity and interconnection parameters (). This rapid fragmentation of the mitochondrial network causes significant loss of Δψm in H9c2s, but not 143Bs (). Mechanistically, the mitochondrial fragmentation observed does not appear to require DRP1: neither H9c2s nor 143Bs showed increased DRP1 expression. Despite this, DRP1 knockout cells were insensitive to H2O2, indicating that DRP1 may still play a role in oxidative fragmentation of mitochondria. Strikingly, however, both cell lines showed loss of the long, fusion-mediating, L-OPA1 isoforms in response to H2O2 challenge, with H9c2s showing a concomitant twofold increase in OMA1 transcripts (). These findings strongly implicate OPA1-mediated mitochondrial fusion as a mechanistic target of oxidative stress, further strengthened by our findings that cells lacking the OMA1 protease are insensitive to H2O2-mediated mitochondrial fragmentation and L-OPA1 cleavage.
While OMA1 has been extensively characterized for its ability to cleave L-OPA1 in response to uncoupling agents such as CCCP [Citation8,Citation9], our results are consistent with a broader role for OMA1 and its cleavage of OPA1 as a key mitochondrial stress response mechanism [Citation31]. Future work is needed to explore the functional determinants of OMA1 activation: an N-terminal domain appears to be responsible for CCCP-mediated activation of OMA1 [Citation32], providing an insight motivating further characterization of OMA1 proteolytic determinants, as well as the interacting proteins that help dictate functional responses. In vivo, excessive OPA1 cleavage causes dilated cardiomyopathy and heart failure [Citation33], while loss of OPA1 also causes inflammation in muscle [Citation12] through activation of UPR and inflammatory signaling [Citation13]. As such, OMA1’s role in controlling mitochondrial structure/function homeostasis and downstream signaling outputs is a prime candidate for further exploration as a checkpoint in cellular stress response.
Supplemental Material
Download JPEG Image (303.4 KB)
Acknowledgements
We thank Richard Youle (NIH) for DRP1 KO cells, Carlos Lopez-Otin (University of Oviedo) for OMA1−/− fibroblasts, and Ruben Dagda (University of Nevada) for advice on image analysis.
Disclosure statement
No potential conflict of interest was reported by the authors.
ORCID
Alma Lopez http://orcid.org/0000-0003-3621-7300
Megan Keniry http://orcid.org/0000-0002-4952-3545
Robert Gilkerson http://orcid.org/0000-0002-5725-6627
Additional information
Funding
Related Research Data
References
- Yu JH, Cho SO, Lim JW, et al. Ataxia telangiectasia mutated inhibits oxidative stress-induced apoptosis by regulating heme oxygenase-1 expression. Int J Biochem Cell Biol. 2015;60:147–156. doi: 10.1016/j.biocel.2015.01.002
- Chen JW, Ni BB, Li B, et al. The responses of autophagy and apoptosis to oxidative stress in nucleus pulposus cells: implications for disc degeneration. Cell Physiol Biochem. 2014;34(4):1175–1189. doi: 10.1159/000366330
- Man W, Ming D, Fang D, et al. Dimethyl sulfoxide attenuates hydrogen peroxide-induced injury in cardiomyocytes via heme oxygenase-1. J Cell Biochem. 2014 2014/06/01;115(6):1159–1165. doi: 10.1002/jcb.24761
- Liu X, Zhang X, Ding Y, et al. Nuclear factor E2-related factor-2 negatively regulates NLRP3 inflammasome activity by inhibiting reactive oxygen species-induced NLRP3 priming. Antioxid Redox Signal. 2017;26(1):28–43. doi: 10.1089/ars.2015.6615
- Wang Y, Men M, Xie B, et al. Inhibition of PKR protects against H2O2-induced injury on neonatal cardiac myocytes by attenuating apoptosis and inflammation. Sci Rep. 2016;6:315.
- Luo B, Li B, Wang W, et al. NLRP3 gene silencing ameliorates diabetic cardiomyopathy in a type 2 diabetes Rat model. PLoS ONE. 2014;9(8):e104771), PubMed PMID: PMC4138036. doi: 10.1371/journal.pone.0104771
- Griparic L, Kanazawa T, van der Bliek AM. Regulation of the mitochondrial dynamin-like protein Opa1 by proteolytic cleavage. J Cell Biol. 2007;178(5):757–764. PubMed PMID: 17709430; PubMed Central PMCID: PMC2064541. doi: 10.1083/jcb.200704112
- Head B, Griparic L, Amiri M, et al. Inducible proteolytic inactivation of OPA1 mediated by the OMA1 protease in mammalian cells. J Cell Biol. 2009;187(7):959–966. PubMed PMID: 20038677; PubMed Central PMCID: PMC2806274. doi: 10.1083/jcb.200906083
- Ehses S, Raschke I, Mancuso G, et al. Regulation of OPA1 processing and mitochondrial fusion bym -AAA protease isoenzymes and OMA1. J Cell Biol. 2009;187(7):1023–1036. PubMed PMID: 20038678; PubMed Central PMCID: PMC2806285. doi: 10.1083/jcb.200906084
- Moore AS, Wong YC, Simpson CL, et al. Dynamic actin cycling through mitochondrial subpopulations locally regulates the fission-fusion balance within mitochondrial networks. Nat Commun. 2016;7:12886), PubMed PMID: 27686185; PubMed Central PMCID: PMCPMC5056443. doi: 10.1038/ncomms12886
- Loson OC, Song Z, Chen H, et al. Fis1, Mff, MiD49, and MiD51 mediate Drp1 recruitment in mitochondrial fission. Mol Biol Cell. 2013;24(5):659–667. PubMed PMID: 23283981; PubMed Central PMCID: PMCPMC3583668. eng. doi: 10.1091/mbc.e12-10-0721
- Rodríguez-Nuevo A, Díaz-Ramos A, Noguera E, et al. Mitochondrial DNA and TLR9 drive muscle inflammation upon Opa1 deficiency. EMBO J. 2018;37(10):e96553. doi: 10.15252/embj.201796553
- Tezze C, Romanello V, Desbats MA, et al. Age-associated loss of OPA1 in muscle impacts muscle mass, metabolic homeostasis, systemic inflammation, and epithelial senescence. Cell Metab. 2017;25(6):1374–1389. e6. doi: 10.1016/j.cmet.2017.04.021
- Legros F, Lombès A, Frachon P, et al. Mitochondrial fusion in human cells Is efficient, requires the inner membrane potential, and is mediated by mitofusins. Mol Biol Cell. 2002;13(12):4343–4354. doi: 10.1091/mbc.e02-06-0330
- Chen H, Detmer SA, Ewald AJ, et al. Mitofusins Mfn1 and Mfn2 coordinately regulate mitochondrial fusion and are essential for embryonic development. J Cell Biol. 2003;160(2):189–200. PubMed PMID: 12527753; PubMed Central PMCID: PMC2172648. doi: 10.1083/jcb.200211046
- Olichon A, ElAchouri G, Baricault L, et al. OPA1 alternate splicing uncouples an evolutionary conserved function in mitochondrial fusion from a vertebrate restricted function in apoptosis. Cell Death Differ. 2007;14(4):682–692. doi: 10.1038/sj.cdd.4402048
- Ban T, Ishihara T, Kohno H, et al. Molecular basis of selective mitochondrial fusion by heterotypic action between OPA1 and cardiolipin. Nat Cell Biol. 2017;19(7):856–863. doi: 10.1038/ncb3560
- Gandre-Babbe S, van der Bliek AM. The novel tail-anchored membrane protein Mff controls mitochondrial and peroxisomal fission in mammalian cells. Mol Biol Cell. 2008;19(6):2402–2412. PubMed PMID: 18353969; PubMed Central PMCID: PMC2397315. doi: 10.1091/mbc.e07-12-1287
- Shen Q, Yamano K, Head BP, et al. Mutations in Fis1 disrupt orderly disposal of defective mitochondria. Mol Biol Cell. 2014;25(1):145–159. PubMed PMID: 24196833; PubMed Central PMCID: PMCPMC3873885. eng. doi: 10.1091/mbc.e13-09-0525
- Ingerman E, Perkins EM, Marino M, et al. Dnm1 forms spirals that are structurally tailored to fit mitochondria. J Cell Biol. 2005;170(7):1021–1027. PubMed PMID: PMC2171542. doi: 10.1083/jcb.200506078
- Smirnova E, Griparic L, Shurland D-L, et al. Dynamin-related protein Drp1 Is required for mitochondrial division in mammalian cells. Mol Biol Cell. 2001;12(8):2245–2256. doi: 10.1091/mbc.12.8.2245
- Lee JE, Westrate LM, Wu H, et al. Multiple dynamin family members collaborate to drive mitochondrial division. Nature. 2016;540(7631):139–143. PubMed PMID: 27798601. doi: 10.1038/nature20555
- Anand R, Wai T, Baker MJ, et al. The i-AAA protease YME1L and OMA1 cleave OPA1 to balance mitochondrial fusion and fission. J Cell Biol. 2014;204(6):919. doi: 10.1083/jcb.201308006
- Möpert K, Hajek P, Frank S, et al. Loss of Drp1 function alters OPA1 processing and changes mitochondrial membrane organization. Exp Cell Res. 2009;315(13):2165–2180. doi: 10.1016/j.yexcr.2009.04.016
- Jones E, Gaytan N, Garcia I, et al. A threshold of transmembrane potential is required for mitochondrial dynamic balance mediated by DRP1 and OMA1. CMLS. 2017;74(7):1347–1363. PubMed PMID: 27858084; PubMed Central PMCID: PMCPMC5346411. eng. doi: 10.1007/s00018-016-2421-9
- Cereghetti GM, Stangherlin A, de Brito OM, et al. Dephosphorylation by calcineurin regulates translocation of Drp1 to mitochondria. Proc Natl Acad Sci U S A. 2008;105(41):15803–15808. doi: 10.1073/pnas.0808249105
- Cribbs JT, Strack S. Reversible phosphorylation of Drp1 by cyclic AMP-dependent protein kinase and calcineurin regulates mitochondrial fission and cell death. EMBO Rep. 2007;8(10):939–944. doi: 10.1038/sj.embor.7401062
- Dagda RK, Cherra SJ, Kulich SM, et al. Loss of PINK1 function promotes mitophagy through effects on oxidative stress and mitochondrial fission. J Biol Chem. 2009;284(20):13843–13855. doi: 10.1074/jbc.M808515200
- Gilkerson RW, De Vries RL, Lebot P, et al. Mitochondrial autophagy in cells with mtDNA mutations results from synergistic loss of transmembrane potential and mTORC1 inhibition. Hum Mol Genet. 2012;21(5):978–990. PubMed PMID: 22080835; PubMed Central PMCID: PMC3277306. eng. doi: 10.1093/hmg/ddr529
- Guillery O, Malka F, Landes T, et al. Metalloprotease-mediated OPA1 processing is modulated by the mitochondrial membrane potential. Biol Cell. 2008;100(5):315–325. PubMed PMID: 18076378; eng. doi: 10.1042/BC20070110
- Rainbolt TK, Lebeau J, Puchades C, et al. Reciprocal degradation of YME1L and OMA1 adapts mitochondrial proteolytic activity during stress. Cell Rep. 2016;14(9):2041–2049. doi: 10.1016/j.celrep.2016.02.011
- Baker MJ, Lampe PA, Stojanovski D, et al. Stress-induced OMA1 activation and autocatalytic turnover regulate OPA1-dependent mitochondrial dynamics. EMBO J. 2014;33(6):578. doi: 10.1002/embj.201386474
- Wai T, García-Prieto J, Baker MJ, et al. Imbalanced OPA1 processing and mitochondrial fragmentation cause heart failure in mice. Science. 2015;350(6265). doi:10.1126/science.aad0116