
 ?Mathematical formulae have been encoded as MathML and are displayed in this HTML version using MathJax in order to improve their display. Uncheck the box to turn MathJax off. This feature requires Javascript. Click on a formula to zoom.
ABSTRACT
Objectives: Protein phosphatase 2A (PP2A), a major serine/threonine phosphatase, is also known to be a target of ROS. The methylation of PP2A can be catalyzed by leucine carboxyl methyltransferase-1 (LCMT1), which regulates PP2A activity and substrate specificity.
Methods: In the previous study, we have showed that LCMT1-dependent PP2Ac methylation arrests H2O2-induced cell oxidative stress damage. To explore the possible protective mechanism, we performed iTRAQ-based comparative quantitative proteomics and phosphoproteomics studies of H2O2-treated vector control and LCMT1-overexpressing cells.
Results: A total of 4480 non-redundant proteins and 3801 unique phosphopeptides were identified by this means. By comparing the H2O2-regulated proteins in LCMT1-overexpressing and vector control cells, we found that these differences were mainly related to protein phosphorylation, gene expression, protein maturation, the cytoskeleton and cell division. Further investigation of LCMT1 overexpression-specific regulated proteins under H2O2 treatment supported the idea that LCMT1 overexpression induced ageneral dephosphorylation of proteins and indicated increased expression of non-erythrocytic hemoglobin, inactivation of MAPK3 and regulation of proteins related to Rho signal transduction, which were known to be linked to the regulation of the cytoskeleton.
Discussion: These data provide proteomics and phosphoproteomics insights into the association of LCMT1-dependent PP2Ac methylation and oxidative stress and indirectly indicate that the methylation of PP2A plays an important role against oxidative stress.
1. Introduction
Reactive oxygen species (ROS) include hydrogen peroxide (H2O2), the hydroxyl radical (•OH), superoxide (), and singlet oxygen (O=O). They have double-edged effects in cells. Low levels of ROS function as important physiological regulators of intracellular signaling pathways [Citation1]. However, high levels of ROS induce oxidative damage to cell viability, cell cycle, and cellular morphology, which may trigger apoptosis and probably cancer-causing mutations [Citation2–5]. In addition to being a ROS, H2O2 is also a second messenger [Citation6]. Growth factors such as Platelet derived growth factor (PDGF), Epidermal growth factor (EGF), Fibroblast growth factor (FGF), and Vascular endothelial growth factor(VEGF) induce downstream effects on the phosphorylation of tyrosine via H2O2 production [Citation7]. In addition, the mitogen-activated protein kinase (MAPK) signaling pathway, which includes the extracellular regulated protein kinases1/2 (ERK1/2), c-Jun N-terminal kinases (JNK), and p38 regulatory pathways, is also activated by H2O2 [Citation8].
Protein phosphatase 2A (PP2A), a major serine/ threonine phosphatase, is composed of three functionally distinct subunits: a scaffolding/structural subunit (A), a variable regulatory subunit (B), and a catalytic subunit (C), which controls numerous cellular processes involved in metabolism, translation, ion transport, development, inflammation, and cell growth, differentiation, and apoptosis [Citation9,Citation10]. PP2A also interacts with numerous protein kinases implicated in oxidative stress, including calcium-calmodulin-dependent protein kinase, protein kinase B/AKT [Citation11], and mitogen-activated protein kinase family members [Citation12,Citation13]. Leucine carboxyl methyltransferase-1 (LCMT1) is an important methyltransferase that methylates the catalytic C subunit of PP2A (PP2Ac) at Leu309, which is crucial for the ability of PP2A to form heterotrimers [Citation14]. In the previous study, we have showed that LCMT1-dependent PP2Ac methylation arrests H2O2-induced cell oxidative stress damage [Citation15]. The objective of this study is to further explore its possible mechanism of LCMT1-dependent PP2Ac methylation arrests H2O2-induced cell oxidative stress damage by by quantitative proteomics and phosphoproteomics analysis.
Changes in protein expression and protein phosphorylation represent a common response to H2O2 or to LCMT1 overexpression, and the relative quantification assessment of these changes may reveal important clues to explain LCMT1 localization in oxidative stress. In our study, these changes were evaluated using isobaric tags for relative and absolute quantitation (iTRAQ) combined with LC-MS/MS analysis. As expected, LCMT1 overexpression induced a general dephosphorylation of proteins. In addition, our work revealed that LCMT1 overexpression deeply changed the characteristics of the response to H2O2, and LCMT1 overexpression-specific proteins under H2O2 treatment were closely related to the changes induced by H2O2. Overall, these data indicated that LCMT1 overexpression had a positive influence on oxidative stress, and we hope this study will provide proteomics and phosphoproteomics insights into the possible mechanism of LCMT1 overexpression in countering oxidative stress.
2. Materials and methods
2.1. Cell culture, treatment and transfection
Human embryonic kidney 293 (HEK293) cells were purchased from the Type Culture Collection of the Chinese Academy of Sciences, Shanghai, China and cultured in Dulbecco’s modified Eagle’s medium (Gibco) supplemented with 10% fetal bovine serum (Excell Bio), 100 U/mL penicillin and 100 mg/mL streptomycin at 37°C with 5% CO2. To construct the model of oxidative stress, the cells were incubated for 1 h at 37°C with 2 mm H2O2 in a 6-well dish. DNA transfection was performed using Lipofectamine 3000 (Invitrogen) according to the manufacturer's instructions. In brief, HEK293 cells (5.0 × 10⁵ cells) were seeded in a 6-well dish and incubated with a mixture of 2.5 µg of purified plasmid DNA and 200 µl DNA-lipid complex for 48 h. The construct used for transfection was the LCMT1 (NM_016309) overexpression vector. Control cells were generated by transfection with PCDNA3.0.
2.2. Cell viability assay with Alamar Blue
The HEK293 cells were plated in 96-well plates at a density of 2 × 10⁴ per well. After 24 h of culture, the cells were stimulated for 1 h with various concentrations (1, 2, 4, 8 or 16 mM) of H2O2 and then incubated with 1% Alamar Blue for 4 h. The optical density (OD) was determined on a plate reader (EL-800, BioTek, Winooski, VT, USA) at wavelengths of 570 and 600 nm. Lastly, the amount of reduced Alamar Blue present, reflecting cell viability, was calculated with the formula [AR570 = A570 –(A600 × RO), RO = AO570/AO600], and the values were expressed as a percentage of the control (untreated cells).
2.3. Western blot analysis
The cells were lysed in cell lysis buffer (Beyotime, Shanghai, China) with 1 mM PMSF. Protein concentrations were detected with the BCA Protein Assay Kit (TaKaRa, Shiga, Japan). Then, the supernatant was diluted in 2xSDS loading buffer and boiled for 5 min. Equivalent amounts of proteins from each sample were separated by 10% SDS-PAGE and transferred to a 0.45 μm PVDF membrane (Millipore, Burlington, MA, USA). The membranes were first blocked in 5% dried skim milk for 30 min, then incubated overnight with the primary antibodies at 4°C, washed with TBST three times, and then incubated with horseradish-conjugated AffiniPure IgG as the secondary antibody for 2 h at room temperature. After 3 washes of 15 min each, the membranes were visualized using an ECL (enhanced chemiluminescence) detection system (Pierce, Rockford, IL, USA). In this study, the following antibodies were used: (1) mouse anti-LCMT1 monoclonal antibody (Origene, Rockville, MD, USA); (2) rabbit anti-PP2A-alpha monoclonal antibody (Abcam, UK); (3) mouse anti-β actin (ZSGB-BIO, Beijing, China); and (4) mouse anti-demethylation-PP2A-C (Santa Cruz, CA, USA).
2.4. Protein/phosphoprotein sample preparation
Proteins were extracted using NitroExtraTM (N-Cell Technology, Shenzhen, China) with Protease and phosphatase inhibitor cocktail (Beyotime, China). After 2 h centrifugation at 103,745×g and 10°C, the supernatant was precipitated with cold acetone at a ratio of 1:3 (sample:acetone) at −20°C overnight. The precipitated protein was washed twice with cold acetone and finally resuspended in 8 M urea after being air dried. Then, the proteins were resuspended in 8 M urea and reduced with 20 mM DTT in 60°C for 1 h. The proteins were then alkylated with 40 mM IAA at room temperature for 30 min while protected from light. The alkylation reaction was quenched by 10 mM DTT. Samples were diluted to 2 M urea with HPLC-grade water. The protein concentration of each sample was determined by the modified Lowry’s assay (BioRad, Hercules, CA, USA) with the use of bovine serum albumin (BSA) to construct a calibration curve. An appropriate amount of trypsin was then added to the sample at an enzyme-to-substrate ratio of 1:100. Digestion was performed in 100 mM triethylammonium bicarbonate (Sigma, St. Louis, MO, USA) at 37°C for 18 h. The digested proteins were desalted on a C18 column and dried in a spin vacuum.
2.5. Phosphoprotein enrichment for phosphoproteomics
Phosphopeptides were enriched from 400 μg digested protein samples using TiO2 particles based on the manufacturer’s protocol (GL Science, 5020-75000). Repeated rounds of phosphopeptide enrichment were performed to maximize the amount of phosphopeptides enriched from the sample. The enriched phosphopeptides were preliminarily analyzed by LC-MS/MS (see below for details) to ensure an optimal level of enrichment efficiency. The phosphopeptides were then desalted and dried in a spin vacuum for subsequent analysis.
2.6. iTRAQ labeling
In this study, phosphoproteomics and proteomics trials were separately implemented in two independent iTRAQ 4-plex experiments. First, 100 µg of desalted peptides from each condition was chemically labeled with iTRAQ 4-plex reagent (4352135) in 100 mM TEAB according to the manufacturer’s protocol. An appropriate amount of isopropanol was added to each iTRAQ reagent tube so that when the sample was added, the mixture was at least 70% isopropanol. Each reagent tube was fully mixed with the sample by vortexing. The pH of the combined sample was checked again to make sure the final pH was between pH 7–10; if not, 1 M TEAB was added to adjust the pH. The labeling reaction was allowed to proceed at room temperature for 2 h. Balanced mix of the differentially labeled samples were then dried in a spin vacuum for C18 desalting.
2.7. Strong cation exchange (SCX) peptide fractionation
After desalting, the labeled peptide samples were re-suspended in SCX Buffer A (10 mM KH2PO3, 20% ACN, pH 2.7). SCX was performed with a PolySULFOETHYL A™ (200 × 4.6 mm, 200A) column using a step gradient (0–10 min: 0% B, 29 min: 15% B, 44 min: 45% B, 46–53 min: 100% B) of Buffer A and Buffer B (10 mM KH2PO3, 20% ACN, 0.6 M KCl, pH 2.7) and a flow rate of 1 min/ml. In total, 53 × 1 ml fractions were collected. They were further combined into 10 fractions based on the number of proteins identified in each 5 min fraction (5, 10, 15, etc.). Each fraction was desalted with ZipTip (Cat. ZTC18S960, Millipore) and dried in a spin vacuum for LC-MS/MS analysis.
2.8. LC-MS/MS analysis
Each dried peptide sample was dissolved in 12 µl of 0.1% FA. The sample was analyzed by nanoLC-MS/MS using an Eksigent ekspert™ nanoLC 425 system coupled to an AB Sciex TripleTOF® 6600 System (Sciex, Washington, DC, USA). After each sample was loaded, the peptide was trapped (ChromXP nanoLC Trap column 350 μm id × 0.5 mm, ChromXP C18 3 μm 120 Å) and eluted at a flow rate of 300 nl/min into a reverse phase C18 column (ChromXP nanoLC column 75 μm id × 15 cm, ChromXP C18 3 µm 120 Å) using a linear gradient of acetonitrile (3–36%) in 0.1% formic acid with a total runtime of 120 min including mobile phase equilibration. Mass spectra and tandem mass spectra were recorded in positive-ion and ‘high-sensitivity’ mode with a resolution of ∼35,000 full-width at half-maximum. The nanospray needle voltage was typically 2300 V in HPLC-MS mode. After the acquisition of ∼5–6 samples, the TOF MS spectra and TOF MS/MS spectra were automatically calibrated during dynamic LC-MS & MS/MS auto-calibration acquisitions with the injection of 25 fmol alcohol dehydrogenase. For collision-induced dissociation tandem mass spectrometry (CID-MS/MS), the mass window for precursor ion selection of the quadrupole mass analyzer was set to ± 2 m/z. The precursor ions were fragmented in a collision cell using nitrogen as the collision gas. Advanced information dependent acquisition (IDA) was used for MS/MS collection on the TripleTOF 6600 to obtain MS/MS spectra for the 20 most abundant and multiply charged ions (z = 2, 3 or 4) following each survey MS1 scan, typically allowing 250 msec acquisition time per MS/MS. Dynamic exclusion was set for 30 s after 2 repetitive occurrences.
2.9. Data analysis
Raw data files were converted to Mascot Generic Format (MGF) and mzXML format using OpenMS. The MGF files were searched against the Oryza Sativa NCBI and common MS contaminant databases using the Mascot (Matrix Science) software. Caramidomethylation (+57 Da) was added as a fixed modification, while iTRAQ-4Plex (K/N), Oxidation (M), Phospho (ST) and Phospho (Y) were added as variable modifications. A maximum of 2 trypsin miscleavages was allowed. Peptides were assumed to have charges of 2+, 3+ or 4+. The instrument type selected was ESI-QTOF. The mass input was assumed to be monoisotopic mass. A decoy database was used for the estimation of the false discovery rate (FDR), and FDR was set to 5%. Mascot search results were exported into DAT files. Protein fold change between conditions was calculated by comparing the different iTRAQ labeling’s signal intensity. The ratio of each protein is given by the mean of the protein ratios measured from all replicates. A student’s t-test was performed to test the significance of protein ratios and Benjamini-Hochberg multiple hypothesis test correction is employed to correct the p-values. Proteins with fold change >1.2 or <0.83 and p < 0.05 were considered to have a significantly different expression. The thresholds used to determine the significance of the differences were ‘p < 0.05, fold change >1.5 or <0.67’ in phosphopeptides. Venn’s diagrams were drawn based on ggplot2 package in the R environment that was used to describe the intersection of differentially expressed protein between different groups. In brief, differentially expressed proteins were divided into upregulated proteins and downregulated proteins. And then, the intersection number of upregulated or downregulated proteins sets in different groups were calculated out and used to draw diagrams.
3. Results
3.1. LCMT1 arrests H2O2-induced damage in HEK293 cells
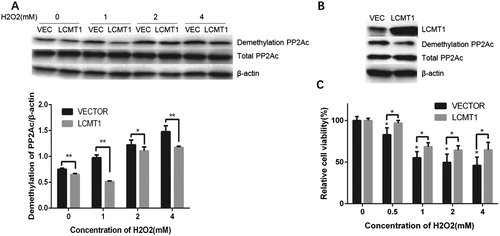
Hydrogen peroxide (H2O2) is generated as a byproduct of many enzyme-catalyzed physiological and pathological processes and is the main type of reactive oxygen species causing oxidative damage. We found that H2O2 induced a substantial reduction in PP2Ac methylation and increase in demethylation without affecting the level of total PP2A at concentrations of 1–4 mM ((A)). LCMT1 overexpression led to a significant increase in LCMT1 expression and downregulation of demethylated PP2Ac in HEK293 cells after H2O2 treatment ((B)). Moreover, LCMT1 overexpression rescued the decline in cell viability, as detected by Alamar Blue reagent, under oxidative stress ((C)).
Figure 1. Effect of LCMT1 overexpression on H2O2-induced demethylation of PP2Ac and cell viability damage. (A) LCMT1-overexpressing and vector control cells were treated with H2O2 at different concentrations for 60 min. The protein levels of total PP2Ac and demethylated PP2Ac were detected in two cell lines. Each condition has three biological repeats. Significance was determined by a One-way ANOVA followed by Tukey post-hoc test. * compared to the VECTOR control, p < 0.05; ** p < 0.01; (B) LCMT1, total PP2Ac, and demethylated PP2Ac levels were compared in LCMT1-overexpressing and vector control cells (C) Cell viability was determined with Alamar Blue for 4 h after 1 h exposure to H2O2. Significance was determined by a One-way ANOVA followed by Tukey post hoc test. * compared to the VECTOR control, p < 0.05; ** p < 0.01; *** p < 0.001.
3.2. Quantitative proteomics and phosphoproteomics profiles by iTRAQ combined with LC-MS/MS analysis
To explore the mechanism of LCMT1 against oxidative stress, quantitative proteomics and phosphoproteomics experiments were performed based on iTRAQ. Four samples were prepared from non-treated vector control, 2 mM H2O2 treated vector control for 60 min, non-treated LCMT1-overexpressing cells and 2 mM H2O2 treated LCMT1-overexpressing cells for 60 min. For the quantitative proteomics profiles, a total of 4480 non-redundant proteins were identified by 3 replicates of iTRAQ coupled with LC-MS/MS analysis. Meanwhile, 3801 unique phosphopeptides and 1596 phosphoproteins were identified by the quantitative phosphoproteomics experiment. lists the numbers of differentially expressed and phosphorylated proteins in different relative quantitative groups.
Table 1. Numbers of differentially expressed proteins and phosphorylated peptides in different groups.
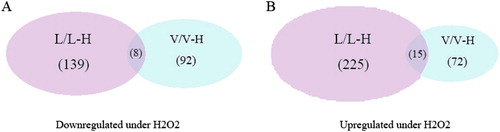
Following H2O2 treatment, 164 proteins were differentially expressed in vector control cells, of which 72 proteins were upregulated and 92 were downregulated. In the LCMT1-overexpressing cells, 364 proteins were differentially expressed, of which 225 were upregulated and 139 were downregulated (). Twenty-three proteins showed similar response patterns (fifteen upregulated and eight downregulated) in both cell lines under H2O2 treatment. In addition, we found that a higher proportion (59.4%) of peptides was phosphorylated by H2O2 in LCMT1-overexpressing cells than the 37.77% in vector control cells. It is known that protein expression and protein phosphorylation play a fundamental role in the intracellular signal transduction that regulates cell survival, proliferation, and metabolism in response to oxidative stress. These differences in the overlap of differentially expressed and phosphorylated proteins indicated that LCMT1 overexpression indeed had an influence on oxidative stress.
Figure 2. Venn diagram representing the overlap of H2O2-specific differentially expressed proteins in vector control and LCMT1-overexpressing cells. (A) Proteins downregulated under H2O2 stress. (B) Proteins upregulated under H2O2 stress.
3.3. The differential characteristics of the response to H2O2 between the vector control and LCMT1-overexpressing cells
These differentially expressed proteins and differentially phosphorylated proteins were integrated and classified into three sets of ontologies, biological process, molecular function and cellular component, by searching the Gene Ontology in the David (https://david.ncifcrf.gov/) database [Citation16,Citation17]. GO annotation comparison was performed to explain the differential characteristics of the response to H2O2 between the vector control and LCMT1-overexpressing cells (). We specifically focused on differential GO terms between V/V-H and L/L-H, which might be associated with the impact of LCMT1 overexpression on oxidative stress. We found that these GO terms were mainly related to protein phosphorylation, protein expression, the cytoskeleton and cell division.
Figure 3. Comparison of GO terms for H2O2-specific regulated protein expression in vector control and LCMT1-overexpressing cells. All terms were filtered by P < 0.001. (A) Biological processes. (B) Molecular function. (C) Cellular components.
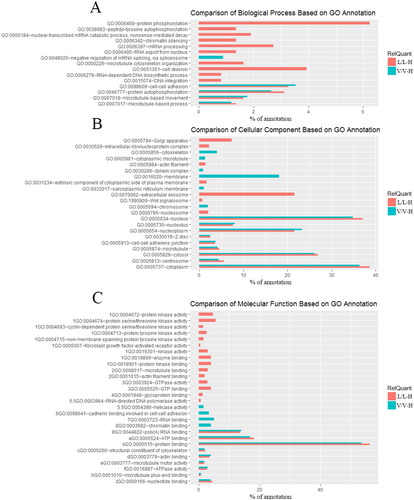
These GO terms related to protein phosphorylation and protein expression were detected in V/V-H and L/L-H. GO annotation analysis indicated that differentially expressed and phosphorylated proteins were involved in more terms related protein expression in L/L-H (). Corresponding, the number of differentially expressed proteins in L/L-H was 2.2 times higher than that in V/V-H. However, the number of phosphorylated proteins in L/L-H was lesser than that in V/V-H. The variance between GO term related phosphorylated proteins and the number of phosphorylated proteins might be due to the opposite regulation of phosphorylated proteins between LCMT1 and H2O2. In terms of the cytoskeleton, as shown in , ‘dynein complex’, ‘cytoskeleton’ and ‘cytoplasm microtubule’ were only detected in V/V-H. However, ‘microtubule cytoskeleton organization’ and ‘actin filament’ were only detected in L/L-H. It is known that H2O2 can induce cell morphological changes, which must require substantial cytoskeletal rearrangement. Furthermore, it is reported that GTPases, especially Rho GTPases, act as signaling centers to regulate the cytoskeleton [Citation18,Citation19]. Correspondingly, ‘GTP binding’ and ‘GTPase activity’ were also only detected in L/L-H, which indicated that LCMT1 overexpression might have an influence on H2O2-induced cytoskeleton rearrangement via the regulation of Rho GTPase. In addition, ‘cell division’ was only detected in L/L-H. H2O2 is known to arrest the multiphase cell cycle by the upregulation of cyclin-dependent kinases (CDKs) inhibitor [Citation20,Citation21]. However, it was interesting that all CDKs identified were upregulated by H2O2 in LCMT1-overexpressing cells.
Altogether, the GO annotation comparison provided a comprehensive overview of the differential characteristics of the response to H2O2 between vector control and LCMT1-overexpressing cells, which might potentially relate to the impact of LCMT1 overexpression on oxidative stress.
3.4. Overexpression of LCMT1 induced general dephosphorylation of proteins
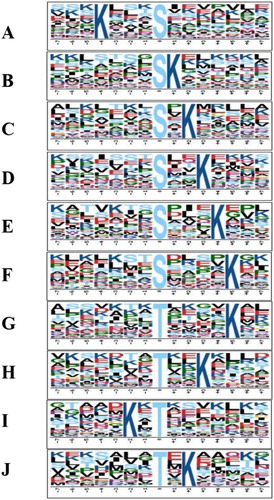
LCMT1 is the only known enzyme that catalyzes the methylation of PP2Ac. Knockdown of LCMT1 would lead to the loss of activity of PP2A and cell death [Citation22]. Moreover, LCMT1 coordinately regulates the carboxyl methylation of PP2A-related phosphatases and, consequently, their holoenzyme assembly and function [Citation23]. As an expected PP2A activator, LCMT1 overexpression induced the dephosphorylation of a majority (74.72%) of peptides in HEK293 cells. The consistency between the expected effects of overexpression of LCMT1 and the results of the data analysis emphasizes the validity of the phosphoproteomics data. To extract the features of dephosphorylation induced by LCMT1 overexpression, we performed a MotifX analysis on this group which revealed 10 significant motifs, i.e. KxxxSp, SpK, SpxK, SpxxK, SpxxxK, SpxxxxK, TpxxxxK, TpxxK, KxT, TxK (). These motifs provided an insight into the features of the LCMT1-dependent PP2A-regulated dephosphorylation of proteins, which has not been described previously.
Figure 4. Motif enrichment analysis of LCMT1 overexpression-specific dephosphorylated proteins. The results output from sequence motif enrichment analysis of the group of LCMT1 overexpression-specific dephosphorylated proteins using motif-x (http://motif-x.med.harvard.edu/motif-x.html). Significantly enriched motifs were shown (p < 1E−06), with a sequence width of 15 and an occurrence threshold of 20.
3.5. LCMT1 specifically controls hemoglobin and the cellular response to stimulus against H2O2
We have shown that LCMT1 overexpression arrests H2O2-induced activity damage. To investigate the possible mechanism, GO term enrichment analysis was performed to clarify the characteristics of LCMT1 overexpression-specific regulated proteins under H2O2 treatment (). All of associated proteins were listed in Supplement data 1. Interestingly, ‘cellular response to DNA damage stimulus’ and ‘regulation of cellular response to heat’ were identified among biological process (BP) GO terms, and they are known to be a fundamental response to oxidative stress. In addition, ‘oxygen transport’ was also detected among the BP GO terms. Furthermore, lists LCMT1 overexpression-specific altered proteins under H2O2 treatment, which are enriched in ‘oxygen transport’. All hemoglobin subunits were upregulated dramatically by LCMT1 overexpression under H2O2 treatment. Non-erythrocytic hemoglobin has been reported in a variety of cells, including neurons, HEK293 cells, HepG2 cells and macrophages [Citation24–26]. The upregulation of hemoglobin is known as a potential mechanism against oxidative stress, which reduces the production of H2O2 and enhanced cell viability [Citation25,Citation27]. The upregulation of hemoglobin might play an important role in the ability of LCMT1 overexpression to protect cells from oxidative stress.
Figure 5. GO term enrichment analysis of differentially expressed and phosphorylated proteins in V-H/L-H. All terms were a biological process (BP) GO terms filtered by P < 0.001.
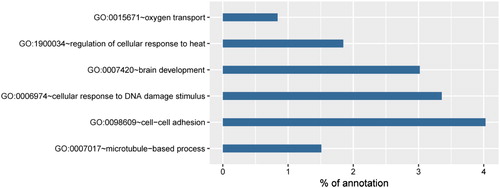
Table 2. List of proteins with LCMT1-specific regulated proteins in H2O2-treated cells, which can be linked to oxygen transport.
3.6. Overexpression of LCMT1 inactivated MAPK3 and regulated Rho signal transduction under H2O2 treatment
Following H2O2 treatment, 60.30% of peptides were dephosphorylated by LCMT1 overexpression. The network of the MAPK and Rho GTPase signaling pathways was crucial under oxidative stress, which regulated signal transduction and the cytoskeleton. We found that the different responses to H2O2 between the vector control and LCMT1-overexpressing cells were related to cytoskeleton-related protein changes. Interestingly, the GO term ‘microtubule-based process’ was also detected in V-H/L-H (). These findings indicated that LCMT1 overexpression could have profound effects on oxidative stress by altering cytoskeleton-related signals. To explore how LCMT1 overexpression modulated cytoskeleton-related signals, pathway enriched analyses were performed to analyze LCMT1 overexpression-specific regulated proteins under H2O2 treatment using KOBAS3.0 (http://kobas.cbi.pku.edu.cn/) [Citation28,Citation29]. Some of KOBAS3.0 results were shown in Supplement data 2. In these terms, we had a special interest in proteins enriched in ‘signaling by Rho GTPases’ and ‘negative feedback regulation of MAPK pathway’. These proteins regulated by LCMT1 overexpression under H2O2 had been shown in .
Figure 6. Overview of LCMT1 overexpression-specific regulated proteins under H2O2 treatment that are linked directly or indirectly to MAPK3 regulation and Rho signal transduction. These differentially expressed and phosphorylated proteins were from V-H/L-H. The colored symbol above each expression of protein and phosphosite indicated whether it was up- or downregulated. Proteins not identified in this study but representing crucial parts of the signaling pathway were shown in white with dotted outlines. The arrow indicated the direction of regulation between proteins.
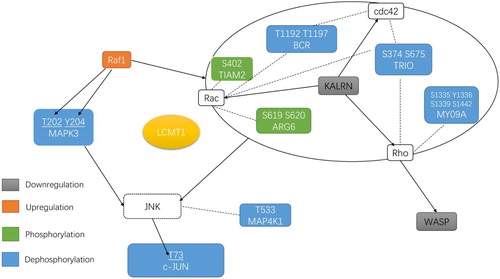
Raf1 is known to act as a regulatory link between the membrane-associated Ras GTPases and the MAPK/ERK cascade. It can activate a MAPK cascade and inhibit signal transducers involved in motility (ROK-α) [Citation30]. Our data showed that LCMT1 overexpression upregulated the expression of Raf1 under H2O2 treatment. Surprisingly, downstream of Raf1, MAPK3(ERK1) was found to have 2 LCMT1 overexpression-specific downregulated phosphosites at Thr202 and Tyr204 that were known to be dephosphorylated and inactivated. These sites suggested that LCMT1 might directly dephosphorylate MAPK3 without necessarily reducing the expression of raf1. It has been reported that MAPK is an important intracellular pathway, activated by H2O2, and its inhibitor PD98059 is known to protect cells from highly reactive oxygen radicals [Citation31,Citation32] (). In addition to the MAPK signaling pathway, the Rho GTPase family members, which include Rho, Rac and Cdc42, also play a pivotal role in regulating actin cytoskeletal organization, cell-adhesive interactions, cell migration, and vesicle trafficking [Citation33–35]. Following H2O2 treatment, 5 LCMT1 overexpression-specific proteins with regulated phosphosites and 1 differentially expressed protein were identified, which regulated the activity of the Rho GTPase family (). These phosphosites had not been reported to have functional specificity in previous studies. However, the majority of these proteins are known to have an ability to promote the activity of Rho GTPases. Among the differentially expressed proteins, kalirin had the ability to promote the exchange of GDP with GTP and activate specific Rho GTPase family members [Citation36] and was downregulated by LCMT overexpression. The downregulation of kalirin indicated that LCMT1 overexpression might induce the inactivation of Rho GTPases. It has been reported that the Rho kinase inhibitor Y26372 could also protect cells from highly reactive oxygen radicals [Citation31].
As an effector of Rho GTPases, WASP is known to regulate actin filament reorganization via its interaction with the Arp2/3 complex [Citation37]. We found that H2O2 upregulated WASP in the vector control cells, which may be associated with H2O2-induced morphological changes. However, LCMT1 overexpression could restore the upregulation of WASP induced by H2O2. c-Jun is a vital transcription factor regulated by Rho GTPase and MAPK3. The dephosphorylation of c-Jun is known to play a positive role in oxidative stress [Citation31,Citation38]. In our study, c-Jun was found to have an LCMT1 overexpression-specific downregulated phosphosite at S73 under H2O2 treatment, known to be modulated and activated by JNK [Citation38–40] (). Moreover, LCMT1 overexpression restored the H2O2-induced downregulation of c-Jun. In summary, our results suggest that LCMT1 overexpression inactivated MAPK3 and regulated Rho signal transduction under H2O2 treatment, which might act as an antioxidant mechanism.
4. Discussion
Reactive oxygen species (ROS) have been suggested to be involved in a variety of human diseases. We have showed that LCMT1 overexpression rescued cell viability and the mitochondrial membrane potential decrease in response to oxidative stress [Citation15]. Additionally, ROS were found to inactivate PP2A [Citation41], and PP2A was reported to have the ability to protect PC12 cells against oxidative stress-induced cell death [Citation42]. So, it would be helpful to further explore the possible mechanism of LCMT1-dependent methylation of PP2Ac affecting oxidative stress. In this study, iTRAQ 4-plex proteomics and phosphoproteomics experiments were applied to investigate the effects of LCMT1 overexpression on oxidative stress. Taking advantage of bioinformatics tools, we obtained some further evidence to indicate that LCMT1 may play a positive role in H2O2-induced oxidative stress. GO term enrichment analysis of LCMT1 overexpression-specific regulated proteins under H2O2 treatment suggests that LCMT1 overexpression may be linked to the cellular response to stimulus induced by H2O2. In addition, we found that non-erythrocytic hemoglobin was upregulated by the overexpression of LCMT1 under H2O2 treatment. It has been reported that hemoglobin can prevent hydrogen peroxide-induced oxidative stress, acting as an antioxidative peroxidase [Citation43]. Furthermore, our results indicate that the LCMT1-dependent methylation of PP2Ac induces general dephosphorylation of proteins, which is related to the activation of PP2A. In addition, we found that LCMT1 overexpression induced the downregulation of 2 activating phosphorylations on MAPK3 (Thr202, Tyr204) and a phosphorylation on c-Jun(Ter73). These phosphorylation sites are known to be reversibly phosphorylated by H2O2, and PP2A could play a positive role in oxidative stress by regulating these phosphorylation sites [Citation42,Citation44].
As a cellular second massager and one of the type of ROS, H2O2 may trigger many physiological and pathological processes, from cell proliferation to induce apoptosis or necrosis. Different cell fate outcomes are greatly dependent upon the level at which it exists. One limitation in our study is that only one concentration of H2O2 was detected. To fully understand the dynamic processes of H2O2 and the reaction of LCMT1 under oxidative stress, a series of concentrations and time point need be conducted. Further study also needs to be carried out to verify the molecular mechanism and the end point of effect of LCMT1 overexpression on H2O2 treatment, especially focus on the signaling pathway detected in our study.
In summary, our experimental data have provided proteomics and phosphoproteomics insights into the mechanism of the LCMT1-dependent methylation of PP2Ac against oxidative stress.
Supplemental Material
Download MS Word (17.5 KB)Supplemental Material
Download MS Word (23.7 KB)Disclosure statement
No potential conflict of interest was reported by the authors.
Additional information
Funding
References
- Finkel T. Signal transduction by reactive oxygen species. J Cell Biol. 2011 Jul 11;194(1):7–15. doi:10.1083/jcb.201102095. PubMed PMID: 21746850; PubMed Central PMCID: PMCPMC3135394.
- Gao F, Yi J, Yuan JQ, et al. The cell cycle related apoptotic susceptibility to arsenic trioxide is associated with the level of reactive oxygen species. Cell Res. 2004 Feb;14(1):81–85. doi:10.1038/sj.cr.7290206. PubMed PMID: 15040894.
- Chang MC, Chen LI, Chan CP, et al. The role of reactive oxygen species and hemeoxygenase-1 expression in the cytotoxicity, cell cycle alteration and apoptosis of dental pulp cells induced by BisGMA. Biomaterials. 2010 Nov;31(32):8164–8171. doi:10.1016/j.biomaterials.2010.07.049. PubMed PMID: 20673999.
- Ramsey MR, Sharpless NE. ROS as a tumour suppressor? Nat Cell Biol. 2006 Nov;8(11):1213–1215. doi:10.1038/ncb1106-1213. PubMed PMID: 17077852.
- Chou HC, Chen YW, Lee TR, et al. Proteomics study of oxidative stress and Src kinase inhibition in H9C2 cardiomyocytes: a cell model of heart ischemia-reperfusion injury and treatment. Free Radic Biol Med. 2010 Jul 01;49(1):96–108. doi:10.1016/j.freeradbiomed.2010.04.001. PubMed PMID: 20385227.
- Rhee SG, Kang SW, Jeong W, et al. Intracellular messenger function of hydrogen peroxide and its regulation by peroxiredoxins. Curr Opin Cell Biol. 2005 Apr;17(2):183–189. doi:10.1016/j.ceb.2005.02.004. PubMed PMID: 15780595.
- Sies H. Role of metabolic H2O2 generation: redox signaling and oxidative stress. J Biol Chem. 2014 Mar 28;289(13):8735–8741. doi:10.1074/jbc.R113.544635. PubMed PMID: 24515117; PubMed Central PMCID: PMCPMC3979367.
- Truong TH, Carroll KS. Redox regulation of protein kinases. Crit Rev Biochem Mol Biol. 2013 Jul-Aug;48(4):332–356. doi:10.3109/10409238.2013.790873. PubMed PMID: 23639002; PubMed Central PMCID: PMCPMC4358782.
- Zolnierowicz S. Type 2A protein phosphatase, the complex regulator of numerous signaling pathways. Biochem Pharmacol. 2000 Oct 15;60(8):1225–1235. PubMed PMID: 11007961. doi: 10.1016/S0006-2952(00)00424-X
- Janssens V, Goris J. Protein phosphatase 2A: a highly regulated family of serine/threonine phosphatases implicated in cell growth and signalling. Biochem J. 2001 Feb 1;353(Pt 3):417–439. PubMed PMID: 11171037; PubMed Central PMCID: PMCPMC1221586. doi: 10.1042/bj3530417
- Beaulieu JM, Sotnikova TD, Marion S, et al. An Akt/beta-arrestin 2/PP2A signaling complex mediates dopaminergic neurotransmission and behavior. Cell. 2005 Jul 29;122(2):261–273. doi:10.1016/j.cell.2005.05.012. PubMed PMID: 16051150.
- Budziszewska B, Szymanska M, Leskiewicz M, et al. The decrease in JNK- and p38-MAP kinase activity is accompanied by the enhancement of PP2A phosphate level in the brain of prenatally stressed rats. J Physiol Pharmacol. 2010 Apr;61(2):207–215. PubMed PMID: 20436222.
- Liu Q, Hofmann PA. Protein phosphatase 2A-mediated cross-talk between p38 MAPK and ERK in apoptosis of cardiac myocytes. Am J Physiol Heart Circ Physiol. 2004 Jun;286(6):H2204–H2212. doi:10.1152/ajpheart.01050.2003. PubMed PMID: 14962831.
- Tolstykh T, Lee J, Vafai S, et al. Carboxyl methylation regulates phosphoprotein phosphatase 2A by controlling the association of regulatory B subunits. EMBO J. 2000 Nov 01;19(21):5682–5691. doi:10.1093/emboj/19.21.5682. PubMed PMID: 11060019; PubMed Central PMCID: PMCPMC305779.
- Tang S, Qin F, Wang X, et al. H2O2 induces PP2A demethylation to downregulate mTORC1 signaling in HEK293 cells. Cell Biol Int. 2018 May 12. doi:10.1002/cbin.10987. PubMed PMID: 29752834.
- Huang da W, Sherman BT, Lempicki RA. Bioinformatics enrichment tools: paths toward the comprehensive functional analysis of large gene lists. Nucleic Acids Res. 2009 Jan;37(1):1–13. doi:10.1093/nar/gkn923. PubMed PMID: 19033363; PubMed Central PMCID: PMCPMC2615629.
- Huang da W, Sherman BT, Lempicki RA. Systematic and integrative analysis of large gene lists using DAVID bioinformatics resources. Nat Protoc. 2009;4(1):44–57. doi:10.1038/nprot.2008.211. PubMed PMID: 19131956.
- Rodriguez OC, Schaefer AW, Mandato CA, et al. Conserved microtubule-actin interactions in cell movement and morphogenesis. Nat Cell Biol. 2003 Jul;5(7):599–609. doi:10.1038/ncb0703-599. PubMed PMID: 12833063.
- Abreu-Blanco MT, Verboon JM, Parkhurst SM. Coordination of Rho family GTPase activities to orchestrate cytoskeleton responses during cell wound repair. Curr Biol. 2014 Jan 20;24(2):144–155. doi:10.1016/j.cub.2013.11.048. PubMed PMID: 24388847; PubMed Central PMCID: PMCPMC3925435.
- Upadhyay D, Chang W, Wei K, et al. Fibroblast growth factor-10 prevents H2O2-induced cell cycle arrest by regulation of G1 cyclins and cyclin dependent kinases. FEBS Lett. 2007 Jan 23;581(2):248–252. doi:10.1016/j.febslet.2006.12.020. PubMed PMID: 17188682; PubMed Central PMCID: PMCPMC1861821.
- Barnouin K, Dubuisson ML, Child ES, et al. H2O2 induces a transient multi-phase cell cycle arrest in mouse fibroblasts through modulating cyclin D and p21Cip1 expression. J Biol Chem. 2002 Apr 19;277(16):13761–13770. doi:10.1074/jbc.M111123200. PubMed PMID: 11827966.
- Arora DK, Machhadieh B, Matti A, et al. High glucose exposure promotes activation of protein phosphatase 2A in rodent islets and INS-1 832/13 beta-cells by increasing the posttranslational carboxylmethylation of its catalytic subunit. Endocrinology. 2014 Feb;155(2):380–391. doi:10.1210/en.2013-1773. PubMed PMID: 24265448; PubMed Central PMCID: PMCPMC3891936.
- Hwang J, Lee JA, Pallas DC. Leucine carboxyl methyltransferase 1 (LCMT-1) methylates protein phosphatase 4 (PP4) and protein phosphatase 6 (PP6) and differentially regulates the Stable Formation of different PP4 Holoenzymes. J Biol Chem. 2016 Sep 30;291(40):21008–21019. doi:10.1074/jbc.M116.739920. PubMed PMID: 27507813; PubMed Central PMCID: PMCPMC5076511.
- Liu L, Zeng M, Stamler JS. Hemoglobin induction in mouse macrophages. Proc Natl Acad Sci USA. 1999 Jun 8;96(12):6643–6647. PubMed PMID: 10359765; PubMed Central PMCID: PMCPMC21968. doi: 10.1073/pnas.96.12.6643
- Nishi H, Inagi R, Kato H, et al. Hemoglobin is expressed by mesangial cells and reduces oxidant stress. J Am Soc Nephrol. 2008 Aug;19(8):1500–1508. doi:10.1681/ASN.2007101085. PubMed PMID: 18448584; PubMed Central PMCID: PMCPMC2488266.
- Biagioli M, Pinto M, Cesselli D, et al. Unexpected expression of alpha- and beta-globin in mesencephalic dopaminergic neurons and glial cells. Proc Natl Acad Sci USA. 2009 Sep 08;106(36):15454–15459. doi:10.1073/pnas.0813216106. PubMed PMID: 19717439; PubMed Central PMCID: PMCPMC2732704.
- Liu W, Baker SS, Baker RD, et al. Upregulation of hemoglobin expression by oxidative stress in hepatocytes and its implication in nonalcoholic steatohepatitis. PLoS One. 2011;6(9):e24363), doi:10.1371/journal.pone.0024363. PubMed PMID: 21931690; PubMed Central PMCID: PMCPMC3171444.
- Wu J, Mao X, Cai T, et al. KOBAS server: a web-based platform for automated annotation and pathway identification. Nucleic Acids Res. 2006 Jul 1;34:W720-4. doi:10.1093/nar/gkl167. PubMed PMID: 16845106; PubMed Central PMCID: PMCPMC1538915. doi: 10.1093/nar/gkl219
- Xie C, Mao X, Huang J, et al. KOBAS 2.0: a web server for annotation and identification of enriched pathways and diseases. Nucleic Acids Res. 2011 Jul;39:W316–W322. doi:10.1093/nar/gkr483. PubMed PMID: 21715386; PubMed Central PMCID: PMCPMC3125809.
- Ehrenreiter K, Piazzolla D, Velamoor V, et al. Raf-1 regulates Rho signaling and cell migration. J Cell Biol. 2005 Mar 14;168(6):955–964. doi:10.1083/jcb.200409162. PubMed PMID: 15753127; PubMed Central PMCID: PMCPMC2171799.
- Garcia-Redondo AB, Briones AM, Martinez-Revelles S, et al. c-Src, ERK1/2 and Rho kinase mediate hydrogen peroxide-induced vascular contraction in hypertension: role of TXA2, NAD(P)H oxidase and mitochondria. J Hypertens. 2015 Jan;33(1):77–87. doi:10.1097/HJH.0000000000000383. PubMed PMID: 25380156.
- Thakali K, Davenport L, Fink GD, et al. Cyclooxygenase, p38 mitogen-activated protein kinase (MAPK), extracellular signal-regulated kinase MAPK, Rho kinase, and Src mediate hydrogen peroxide-induced contraction of rat thoracic aorta and vena cava. J Pharmacol Exp Ther. 2007 Jan;320(1):236–243. doi:10.1124/jpet.106.110650. PubMed PMID: 17003231.
- Lazer G, Katzav S. Guanine nucleotide exchange factors for RhoGTPases: good therapeutic targets for cancer therapy? Cell Signal. 2011 Jun;23(6):969–979. doi:10.1016/j.cellsig.2010.10.022. PubMed PMID: 21044680.
- Ridley AJ. Rho GTPase signalling in cell migration. Curr Opin Cell Biol. 2015 Oct;36:103–112. doi:10.1016/j.ceb.2015.08.005. PubMed PMID: 26363959; PubMed Central PMCID: PMCPMC4728192.
- Tapon N, Rho HA. Rac and Cdc42 GTPases regulate the organization of the actin cytoskeleton. Curr Opin Cell Biol. 1997 Feb;9(1):86–92. PubMed PMID: 9013670. doi: 10.1016/S0955-0674(97)80156-1
- Kawai T, Sanjo H, Akira S. Duet is a novel serine/threonine kinase with Dbl-Homology (DH) and Pleckstrin-Homology (PH) domains. Gene. 1999 Feb 18;227(2):249–255. PubMed PMID: 10023074. doi: 10.1016/S0378-1119(98)00605-2
- Peng X, Yan T, Sun M. The WASP-Arp2/3 complex signal cascade is involved in actin-dependent sperm nuclei migration during double fertilization in tobacco and maize. Sci Rep. 2017 Feb 22;7:43161), doi:10.1038/srep43161. PubMed PMID: 28225074; PubMed Central PMCID: PMCPMC5320560.
- Aquilano K, Baldelli S, Rotilio G, et al. trans-Resveratrol inhibits H2O2-induced adenocarcinoma gastric cells proliferation via inactivation of MEK1/2-ERK1/2-c-Jun signalling axis. Biochem Pharmacol. 2009 Feb 01;77(3):337–347. doi:10.1016/j.bcp.2008.10.034. PubMed PMID: 19038233.
- Nateri AS, Spencer-Dene B, Behrens A. Interaction of phosphorylated c-Jun with TCF4 regulates intestinal cancer development. Nature. 2005 Sep 8;437(7056):281–285. doi:10.1038/nature03914. PubMed PMID: 16007074.
- Qi M, Elion EA. MAP kinase pathways. J Cell Sci. 2005 Aug 15;118(Pt 16):3569–3572. doi:10.1242/jcs.02470. PubMed PMID: 16105880.
- Nakahata S, Morishita K. PP2A inactivation by ROS accumulation. Blood. 2014 Oct 2;124(14):2163–2165. doi:10.1182/blood-2014-08-594093. PubMed PMID: 25278564.
- Chen L, Liu L, Yin J, et al. Hydrogen peroxide-induced neuronal apoptosis is associated with inhibition of protein phosphatase 2A and 5, leading to activation of MAPK pathway. Int J Biochem Cell Biol. 2009 Jun;41(6):1284–1295. doi:10.1016/j.biocel.2008.10.029. PubMed PMID: 19038359.
- Widmer CC, Pereira CP, Gehrig P, et al. Hemoglobin can attenuate hydrogen peroxide-induced oxidative stress by acting as an antioxidative peroxidase. Antioxid Redox Signal. 2010 Feb;12(2):185–198. doi:10.1089/ars.2009.2826. PubMed PMID: 19702440.
- Cao Z, Zhang R, Li J, et al. X-linked inhibitor of apoptosis protein (XIAP) regulation of cyclin D1 protein expression and cancer cell anchorage-independent growth via its E3 ligase-mediated protein phosphatase 2A/c-Jun axis. J Biol Chem. 2013 Jul 12;288(28):20238–20247. doi:10.1074/jbc.M112.448365. PubMed PMID: 23720779; PubMed Central PMCID: PMCPMC3711291.