
ABSTRACT
Objectives
Nitric oxide (NO) plays a vital role in neurological development. As an easily accessible and non-invasive fluid, saliva hasn't been evaluated for nitrite among children with autism spectrum disorder (ASD). This study aims to quantify saliva nitrite and explore its relation with serum NO.
Methods
Saliva sampling and pretreatment methods were optimized, followed by NO measurement via chemiluminescence for 126 ASD children and 129 normally developing children (ND).
Results
In the ASD group, saliva nitrite was significantly higher than that in the ND, with concentrations of 4.97 ± 3.77 μM and 2.66 ± 2.07 μM (p < 0.0001), respectively. Positive correlation was observed between saliva NO2− and serum NO3− in ASD children, which didn't exist in the ND group. Male children in the ASD group had significantly higher NO than that in boys of the ND group, without significant difference between girls in both groups. Correlation was not found between saliva or serum NO and severity of these ASD children.
Discussion
It is reported for the first time that saliva nitrite was positively correlated with serum nitrate in ASD children, with significantly higher NO only in autistic boys. Non-invasive saliva might serve as a predictor of health status of ASD children.
Introduction
According to the latest definition in Diagnostic and Statistical Manual of Mental Disorders (DSM–5) [Citation1], autism spectrum disorder (ASD) is characterized by two core symptoms: (1) restricted and/or repetitive patterns of behavior, interests, or activities and (2) persistent deficits in social communication and interactions. Accumulated evidences have indicated that ASD can also be characterized by pathophysiological abnormalities, besides behavioral disorders [Citation2,Citation3]. Due to molecular complexity and wide heterogeneity of this neurodevelopmental disease, multiple potential biomarkers have been suggested, including behavioral [Citation2,Citation4], morphological [Citation3,Citation5], neuropsychological [Citation6], neurophysiological and neuroanatomical [Citation7], immunological [Citation8], hormonal [Citation9] and biochemical biomarkers [Citation10]. However, there is no consensus over effective preventive strategies, early biomarker-based diagnosis and specific medicinal drugs, along with elevated prevalence during the past decades, with about one in 160 children diagnosed with ASD worldwide [Citation11].
The reason behind this predicament is that we still lack clear understanding of its pathophysiology [Citation12]. Researchers have realized that ASD is not only a disorder of brain, with the peripheral nervous, immune and metabolic systems playing a role in its pathogenesis, i.e. a disorder with systematic issues [Citation13–15]. For example, one study with 32 autistic men indicated the participation of peripheral sensory nerves in etiology, possibly abnormal tactile sensation [Citation13]. Dysregulation of multiple pro-inflammatory or anti-inflammatory cytokines was reported in blood or cerebrospinal fluid of ASD patients, including interleukin-6 (IL-6) and interleukin-17 (IL-17) [Citation16,Citation17]. Moreover, in studies of urine and blood specimens from autistic children, redox metabolite nitrite was found higher in ASD children [Citation10]. In fact, redox metabolism or oxidative stress has been suggested as one of the pathways causing autism [Citation18]. Oxidative stress is due to the imbalance of antioxidants and pro-oxidants, including reactive oxygen species (ROS) and reactive nitrogen species (RNS). Nitric oxide (NO), one of RNS, along with its metabolites was reported significantly higher in blood of ASD people than in the control group [Citation19]. NO2−, NO3− and 3-nitrotyrosine (3-NT) in blood or cerebrospinal fluid were also reported as a potential biomarker among ASD children [Citation10].
As a physiological fluid in circulation, saliva has not caught much attention in ASD research, in comparison to cerebrospinal fluid, blood or urine. In fact, saliva samples have been applied for diagnosis of various local or systemic diseases [Citation20]. In dental diseases, saliva was heavily studied, including periodontal disease, caries and so on [Citation21]. It was also used in diagnosis of cardiovascular dysfunction [Citation22], metabolic diseases [Citation23], cancer [Citation24] and infectious diseases [Citation25]. Saliva is secreted from salivary glands, and the latter are regulated by nervous systems [Citation26]. Saliva has been suggested as a promising fluid to identify biomarkers for neurodegenerative and neurodevelopmental diseases [Citation27–29]. Collection of saliva is non-invasive, simple and repeatable, which become its unique advantages over other biological fluids, i.e. cerebrospinal fluid, alveolar lavage fluid, blood and urine. If a specific connection between saliva and invasive fluids (blood, cerebrospinal fluid) is identified in ASD population, detection of saliva will definitely help understanding this disease, therefore benefiting its diagnosis and prognosis in a long run.
On the other hand, saliva is a complex matrix, which may cause complications of sample preparation. Oral bacteria contain nitrate reductase and nitrite reductase enzymes, leading to nitrite degradation after specimen collection. To date, there existed six known methods for the preparation of saliva before quantification, including direct measurement without treatment [Citation30], centrifugation [Citation31], precipitation with saturated zinc sulfate (ZnSO4) [Citation32], precipitation with sodium hydroxide (NaOH) plus ZnSO4 and centrifugation [Citation33], filtration [Citation34], centrifugation followed by precipitation with methanol (MeOH) [Citation35]. Due to rare interactive opportunities between clinicians and methodologist, comparison of these methods in parallel and optimization of saliva pretreatment had been missing for saliva nitrite analysis in the past which is critical to obtain accurate data from clinical samples.
In order to advance precise quantification of nitrite in saliva, we first performed parallel comparison of these known pretreatment methods in this study. Sampling processes for children were also evaluated. With optimized sampling and pretreatment methods, salivary nitrite was precisely quantified for 134 ASD children and 135 normally developing children (ND, the control group). After the out-of-range data were excluded, nitrite from 126 ASD and 129 ND children's saliva was compared. Furthermore, the correlation between nitrite in saliva and serum NO was investigated for both groups. In addition, sex was evaluated to clarify whether it impacts salivary nitrite and serum NO. These data in accumulation suggested that salivary nitrite differentiated male ASD children from male ND children, which was positively correlated with serum nitrate only in the ASD group. Therefore, nitrite in saliva, along with nitrate in serum, may serve as an elevated redox indicator for male children with ASD.
Materials and methods
Statement on guidelines of human subject research
We have followed the regulation policy on human subject research published by the National Health Commission of the People's Republic of China. All human biological materials were obtained, processed and analyzed in compliance with national guidelines in the submission of this manuscript. All the consent forms (Biomedical Consent, Parent Consent and Permission with Child Assent) and biomedical protocols had been reviewed and approved by the Ethics Committee of Huangshi Maternity and Children’s Health Hospital (case number: 2017-KF-001).
Subject recruitment
All participants, including 134 ASD children (118 male and 16 female, 2–10 years old), 135 normally developing children (ND children, the control group, 72 male and 63 female, 2–10 years old), were recruited at Huangshi Maternity and Children's Health Hospital (Wuhan City, Hubei Province, China). No other illness conditions were reported for participants, and none of these participants were under any medication. Biological matrices (saliva and blood) were collected for nitrite and nitrate analysis. All experimental protocols were approved by the Ethics Committee of Huangshi Maternity and Children’s Health Hospital (case number: 2017-KF-001), including sampling, pretreatment and analytic methods. The inclusion criteria of ASD were conducted by two independent professional clinicians from Huangshi Maternity and Child Health Care Hospital (Wuhan City, Hubei Province, China), primarily based on the Diagnostic and Statistical Manual of Mental Disorders (Fifth Edition, DSM-5). The Autism Diagnostic Observation Schedule (ADOS) was used as diagnostic aids. Exclusion criteria were children who diagnosed with other mental disorders (e.g. attention deficit hyperactivity disorder, obsessive-compulsive disorder), a history of brain injury, severe chronic conditions (e.g. gastrointestinal symptoms), definite genetic metabolic syndrome, recent infections, recent high-doses of vitamin or mineral supplements and any medication. Parents or guardians of all participants recruited for this study had been given and signed the research consent.
Saliva and serum sampling
In order to minimize interference of food and drinks for salivary nitrite analysis, saliva was collected after overnight fasting and no beverage was allowed overnight except water. Samples were obtained in the morning between 8 am to 10 am. For saliva collected via spitting, each participant was asked to rinse mouth with bottled clean water three times, wait for five minutes and then spit whole saliva, without cough up mucus, into a 10 mL propene polymer tube with or without 200 μL NaOH (1 M) inside, which depended on the pretreatment method as described below. Samples collected via spitting were only used for comparison of pretreatment methods. For saliva collected via dripping, each participant was asked to rinse mouth with bottled clean water three times, wait for five minutes and then open mouth, allowing saliva naturally dripping into a clinical saliva tube (Lot # 1-d-2-G, Nantong Taidi Experimental Device Co., Ltd) via gravity. This tube came with its own protective liquid, which was mixed with dripped saliva with 1:1 volume ratio.
In order to make saliva collection safe and accessible for children, rubbing with a cotton swab was applied for sampling from the ASD and ND children. Each participant was asked to rinse mouth with bottled clean water three times, waited for five minutes and then saliva specimens were sampled by rubbing the palate with one cotton swab left and right for three times. Afterwards, the swab was quickly transferred into a 10 mL propene polymer tube containing 200 μL NaOH (1 M) and 1 mL Phosphate-Buffered Saline (PBS), and capped for immediate analysis or stored at −20 °C for further management.
To analyze nitrite and nitrate in serum, whole blood samples were collected during the same period in the morning. After sitting on bench for 40–60 min, tubes containing whole blood were centrifuged at 4000g for 5 min at room temperature (RT) and serum was isolated. Serum was then put on dry ice for immediate analysis or stored at −80 °C for next-step management.
Pretreatment of saliva specimens
In order to evaluate various preparation methods, 10 mL saliva was collected from one grown-up individual via spitting. The obtained saliva was then divided into seven specimens, which were adopted to evaluate these below seven methods: (1) untreated: omission of any pre-treatment before analysis; (2) centrifugation: 1 mL of saliva was centrifuged at 10,000g for 5 min at 4°C. Supernatant was collected for analysis; (3) saturated ZnSO4: into a 4 mL tube, 1.5 mL H2O, 0.5 mL saliva and 0.2 mL saturated zinc sulfate solution was mixed on vortex and treated in a water bath at 70°C for 15 min. Upon cooling to room temperature, the supernatant was filtered by 0.45 μm polyethersulfone filter and filtrate was obtained for analysis; (4) NaOH and ZnSO4 plus centrifugation: 2 mL saliva was mixed with 0.2 mL NaOH (1 M) and 1.2 mL zinc sulfate solution (0.15 M), which stayed on ice for 15 min and was then centrifuged at 12,000g for 5 min. Afterwards, supernatant was collected for analysis; (5) filtration: 1.2 mL saliva was filtered by 0.22 μm polyethersulfone for analysis; (6) centrifugation plus MeOH: 1.2 mL saliva was centrifuged at 11,500g for 5 min at 4 °C. Supernatant was mixed with methanol via the volume ratio of 1:1 before analysis; (7) NaOH plus centrifugation: 1 mL of saliva was mixed with 0.1 mL NaOH (1 M), and then centrifuged at 10,000g for 1 min. Supernatant was collected for analysis. The first six methods were carried out according to literature [Citation19–24], and the last method was an optimized protocol in this study.
For samples collected with a cotton swab, each swab was immediately put into a 10 mL propene polymer tube containing 0.2 mL NaOH (1 M) and 1 mL PBS (10 mM), mixed on vortex and centrifuged at 10,000g for 1 min. Then the supernatant was obtained for analysis or stored at −20 °C for future measurements.
Measurement of saliva pH
The pH meter (Mettler Toledo, FiveEasy Plus FE28) was employed to measure pH of saliva. Before use, the pH meter was calibrated with standard calibration solutions (pH 4.01, 7.00 and 9.21). Approximately 3 mL saliva from one adult was used for pH measurement at RT. Triplicate measurements for each sample were performed.
Quantification of nitrite and nitrate in saliva and serum
Nitric Oxide Analyzer (NOA 280i, GE, US) was adopted to measure the concentration of nitrite and nitrate with N2 as carrier gas. 0.011 g/mL iodine ion reagent was adopted for nitrite detection and 0.008 g/mL vanadium trichloride solution mixed with 1 M HCl was loaded into the purge vessel for nitrate quantification.
Duplicate injections of standard solutions into the NOA purge vessel were performed. When calibration curves were obtained with R2 > 0.999, the instrument NOA passed daily calibration. Each saliva or serum sample was thawed on ice before injection for analysis. The injected volume of saliva and serum specimens was 100 and 20 μL, respectively, unless specimens were specifically diluted in order to stay in the linear range of analysis. All the tests were repeated three times at RT.
Statistical analysis
Comparisons between two groups were performed using a two-tailed unpaired Student’s t-test with GraphPad Prism 7 (Graphpad, California, USA). Correlation between NO was checked for normality and analyzed by Pearson’s correlation or Spearman’s correlation with GraphPad Prism 7 (Graphpad, CA, USA). Values for all measurements were expressed as mean ± SD for parametric distributions. p < 0.05 was considered statistically significant. All experiments were performed at least three times.
Results
Evaluation of pretreatment methods for quantification of saliva nitrite
There exists a complicated matrix in saliva, including protein and microorganism, which may disturb the accurate detection of nitrite. An efficient pretreatment method could reduce matrix interference and achieve high accuracy. To date, co-existence of multiple pretreatment methods has caused confusion, for nitrite levels varied dramatically among published data [Citation19–24].
In this study, six preparation methods were compared in parallel, including methods of untreated, centrifugation, saturated ZnSO4, NaOH plus saturated ZnSO4 and centrifugation, filtration, and centrifugation plus MeOH ((A)). Strong base has been known to denature proteins and high-speed centrifugation helps precipitate cells and bacteria [Citation25], so the method of NaOH plus centrifugation was brought up as a new preparation method here ((A)). In order to find the method that can stabilize nitrite well, saliva was first prepared with these seven methods separately, and then got assessed for nitrite stability after staying in air for different time length: 0, 2, 6, 12 and 24 h at RT. The ratio of NO2− (ti) to NO2− (t0) was taken as the evaluation index of y-axis ((B)). NO2− (ti) and NO2− (t0) were the original nitrite concentration and detected NO2− concentration at different time length, respectively. The results were shown in .
Figure 1. Different pretreatment and sampling methods of saliva. (A) Scenic description of seven pretreatment methods: untreated, centrifugation, saturated ZnSO4, NaOH plus ZnSO4 and centrifugation, filtration, centrifugation plus MeOH, and NaOH plus centrifugation. (B) ratio of NO2− (ti) to NO2− (t0) versus time with methods described in (A). t0 was when the first measurement was performed immediately after pre-treatment. ti was when nitrite was measured at time length i: 2, 6, 12 or 24 h. (C) nitrite concentrations within 24 h with one of these two sampling methods: spitting (spit), cotton swabbing (cotton swab), followed by pretreatment of NaOH plus centrifugation.
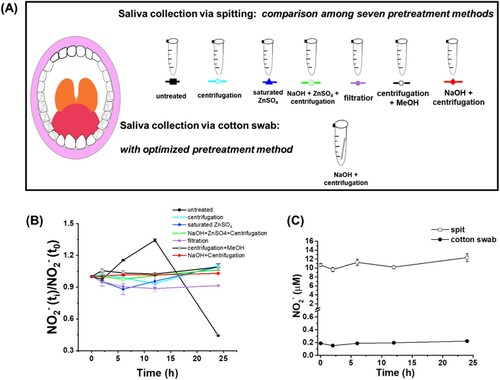
These results showed that nitrite levels quickly dropped if untreated, with more than 90% nitrite degraded within 24 h ((B)). At the same time, pH of this untreated saliva kept increasing (Supplementary Figure S1). Pretreatment with centrifugation, saturated ZnSO4, NaOH plus saturated ZnSO4 plus centrifugation, filtration or centrifugation plus MeOH led to varied nitrite levels. Besides, filtration has one drawback, which took more than 10 min to collect 500 μL filtrate with 0.22 μm polyethersulfone. It apparently raised the risk of nitrite degradation during preparation. The ratio of NO2− (ti) to NO2− (t0) in saliva stayed stable via preparation with NaOH plus centrifugation, which means that both methods helped stabilize salivary nitrite. To date, this is for the first time that various preparation methods were compared in parallel, which indicated that the method of NaOH plus centrifugation should be the best option for pretreatment of salivary nitrite in the time frame of 24 h. Therefore, saliva samples were pretreated with this method before nitrite detection for recruited participants.
Evaluation of sampling methods of saliva
Besides pretreatment methods, sampling process was also evaluated in this study. Safety and feasibility are the two major concerns for saliva collection from young children [Citation26]. Though spitting or drooling has been used for sampling in adults, it doesn’t succeed among children, especially for ASD children who usually have communicating difficulties. Sampling with a cotton device is an easy and safe process suitable for children. Here, we measured nitrite from one adult’s saliva for comparison of three sampling methods: (1) spitting: saliva was split into a tube; (2) dripping: saliva dripped into a tube with month open; (3) cotton swab: saliva was collected via rubbing an individual’s month (Supplementary Figure S2–S3).
First, it was clarified that a cotton swab didn’t release or consume nitrite to interfere saliva measurement (Supplementary Figure S2). Subsequently, saliva samples from one adult recruiter were collected via spitting, cotton swabbing or dripping (Supplementary Figure S3). Then saliva nitrite was assessed for stability ((C), Supplementary Figure S3). It turned out that nitrite was stable for at least 24 h after collection with a cotton swab and pretreatment with NaOH plus centrifugation, not with the dripping device. We noticed that the nitrite level via swabbing was lower than that via spitting ((C)), but rubbing with a swab was the best option for sampling due to spitting difficulty among children. The weight of saliva collected via cotton swab was about 1/50 of that via direct spitting, and the dilution fold of the cotton rubbed-saliva was about 1/60 of that of split saliva, which explained the lower nitrite level in rubbed samples (1/57 of the split samples ((C)). Besides, as long as the same sampling method is utilized to all groups, the goal to elucidate whether salivary nitrite differentiates ASD and ND groups can be still achieved. It is worth noting that salivary nitrite concentrations in this study were comparable to what was previously reported in several studies () [Citation31,Citation33,Citation36–38]. While a swab-absorbent device had been applied for quantification of other molecules, it is for the first time to be clearly stated for use in salivary nitrite measurement here.
Table 1. Summary of concentrations of salivary nitrite.
Quantification of saliva nitrite in the ASD and ND groups
Spot saliva specimens from participants were collected between 8 am to 10 am in the morning, which were analyzed within 24 h with the reductive I3− method on NOA. Nitrite levels in eight out of the 134 ASD children and six out of the 135 ND children were out of range, i.e. >mean + 3SD or < mean − 3SD, which were discarded during the next-step analysis.
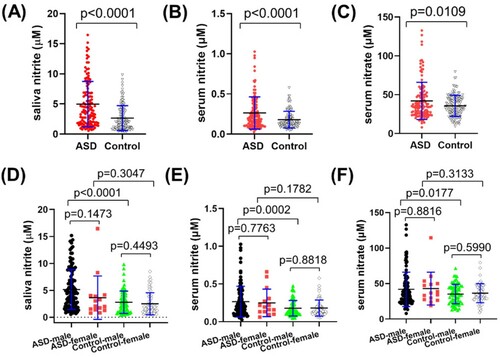
The results of 126 ASD and 129 ND children ((A), , Supplementary Table S1) showed that the nitrite level was 4.97 ± 3.77 μM in the range of 0.55–16.46 μM among the ASD group. In the ND group, the nitrite level was 2.66 ± 2.07 μM in the range of 0.23–9.83 μM. The difference in saliva nitrite concentrations between the ASD and ND groups was significant (p < 0.0001). Inside each group, sex didn’t make a difference between boys and girls. However, the boys in the ASD group had significant higher saliva nitrite than in male children in the ND (p < 0.0001), with close average concentrations between girls (p = 0.3047) ((D)).
Figure 2. Concentrations of salivary nitrite, serum nitrite and nitrate in the ASD and Control groups. (A) salivary nitrite in the ASD and Control groups (p < 0.0001); (B) serum nitrite in the ASD and Control groups (p < 0.0001); (C) serum nitrate in the ASD and Control groups (p = 0.0109); (D) salivary nitrite of male and female participants in each group; (E) serum nitrite of male and female participants in each group; (F) serum nitrate of male and female participants in each group.
Apparently, saliva nitrite levels in this study were lower than what had been reported in some literature () [Citation32,Citation34,Citation39–42]. It should be due to differences among sampling methods, even though sampling details had been rarely stated in literature. On the other hand, salivary nitrite in ASD population hadn’t been reported before, which didn’t really make an effective comparison. Another noteworthy point is that the chemiluminescence method of NOA was employed for salivary nitrite quantitation for the first time, which has been widely accepted for NO detection in other biological specimens (blood, urine, tissue) and was distinctive from previous studies as well.
Quantification of serum nitrite and nitrate in the ASD and ND groups
In order to figure out whether serum NO and saliva nitrite are correlated or not, we also performed detection of nitrite and nitrate in serum from these two groups. It turned out that serum NO had a similar trend, i.e. nitrite and nitrate in the ASD group were significantly higher than in those in the control group ((B–C), ), with p < 0.0001 and p = 0.0109, respectively. In addition, this group distinction was mainly between the boys in both groups (E–F), with p = 0.0002 for serum nitrite and p = 0.0177 for serum nitrate. The results indicate that sex plays a role in NO levels among ASD children. It was the first time that precise concentrations of serum nitrite and nitrate were independently disclosed among children aged between 2 and 10 years old, though the sum of nitrite and nitrate had been reported before () [Citation19,Citation22,Citation29,Citation43].
Table 2. Summary of concentrations of nitrite and nitrate in blood among children.
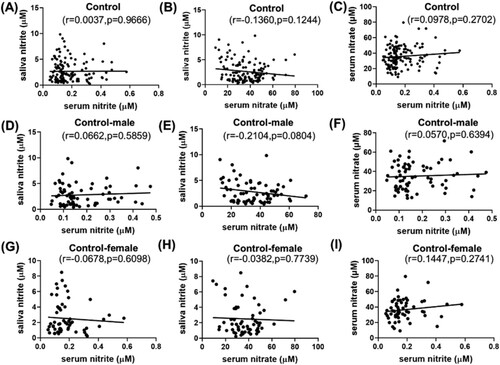
Hereafter, correlations were carefully checked among saliva NO2−, serum NO2− and serum NO3− through Pearson’s or Spearman’s analysis, depending on the number of analyzed subjects (). For ASD children, saliva NO2− was positively correlated with serum NO3−, with r = 0.3628, p < 0.0001 ((B)). Serum NO3− and NO2− were positively correlated as well with r = 0.2196, p = 0.0135 ((C)). This saliva nitrite-serum nitrate correlation was even more notable in the autistic girls ((H)), even though the number of girls was only 15. Interestingly, no correlation was observed among saliva nitrite, serum nitrite and serum nitrate in the ND or Control group ((A–I)), either in the ND group or in the male/female subgroups. The results indicate that saliva-serum NO relations were remarkably different between the ASD and ND groups, which was novel and may suggest a difference in blood barriers.
Figure 3. Correlation among saliva nitrite, serum nitrite and serum nitrate in the ASD group (A–C), in the male participants of the ASD group (D–F), and in the female participants of the ASD group (G–I).
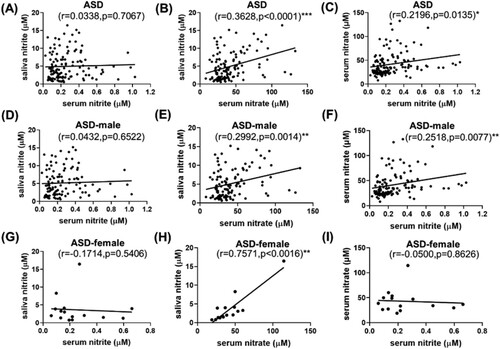
Figure 4. Correlation among saliva nitrite, serum nitrite and serum nitrate in the Control group (A–C), in the male participants of the Control group (D–F), and in the female participants of the Control group (G–I).
Moreover, the relation between NO and the severity of ASD children was analyzed (Supplementary Figure S4). Correlation between ABC or CARS score and saliva nitrite, serum nitrite or serum nitrate was depicted, without any specific relation found. Since ABC or CARS results have their own limitations [Citation44], this preliminary study certainly needs further verification.
Discussion
Nitrite and nitrate have been recognized as an endogenous reservoir of NO, but nitrate is reported to exercise its function always via conversion to nitrite [Citation47]. Intake food or drinks has a direct impact on oral nitrate levels [Citation48], with 60–80% dietary source from vegetables, 15–20% from drinking water and 10–15% from cured meat [Citation49]. As for nitrite in human, exogenous dietary sources plays a minor role in endogenous nitrite levels, for oral nitrite is mainly converted by oral commensal bacteria from nitrate that is reabsorbed and concentrated in saliva glands [Citation50]. Measurement of saliva nitrite after overnight fasting is capable to exclude dietary interference in this study. Therefore, we focused on accurate quantification of oral nitrite after overnight fasting, as well as pursuing its relation with NO in blood of ASD children.
In the past four decades, reported concentrations of salivary nitrite had varied dramatically among literatures, but evaluation of protocols to prepare this biological fluid was missing. Various factors impact the stability of saliva, including time and temperature [Citation51]. Saliva degrades nitrite in the presence of oral nitrite reductase [Citation52], which seemed being ignored previously in clinical detection. Ammonia is one product upon nitrite reduction catalyzed by bacterial heme nitrite reductase, which agreed with elevated pH of saliva during storage in this study (Supplementary Figure S1). Therefore, protocol optimization is necessary for precise measurement of nitrite, which was performed in this study. Here the pretreatment method of NaOH plus centrifugation was easy to perform and could stabilize saliva nitrite for at least 24 h. Since saliva specimens are usually processed for analysis within one day, this preparation protocol should be robust enough for lab research. However, for quantification of large-scale samples or sampling without immediate low-temperature storage, this method needs to be re-evaluated. Moreover, we adjusted the sampling method from spitting to rubbing with a cotton swab due to difficulty of sampling from children, which made nitrite levels lower than in some studies. It’s noteworthy that the sampling process should be specifically stated in studies in order to make data more comparable.
After preclusion of potential interferences from sampling and pretreatment processes, pathophysiological factors should mainly contribute to nitrite and nitrate abundance in saliva and blood. For the main outcome of this cross sectional study, the power value of salivary nitrite between groups in (A) is 0.99998. As this power value is large enough, and together with the p value less than 0.0001, the probability of false negatives and false positives of this result is very low and the conclusion is quite reliable.
Current data regarding oral health of autistic children are controversial [Citation53,Citation54]. Correlation of salivary NO among ASD population had been rarely investigated, especially nitrite in oral microbiota. Studies of six healthy volunteers by Hyde et al. identified 14 bacterial species, which functioned as nitrate reductase, nitrite reductase or both [Citation55]. Ahmed et al. reported that the bacterial number of tongue impacted nitrate reductase activity, which was regulated by inhaled reactive substances [Citation56]. Until recently, Qiao et al. reported that ASD children had notably different oral microbiota from the healthy control [Citation57], with lower bacterial diversity and higher pathogens in ASD. Streptoccocus, one major oral pathogen that catalyzes nitrite reduction to NO, was significantly higher in dental samples from ASD children than from healthy children. Whether and how oral nitrate reductases and nitrite reductases impact ASD pathogenesis still deserve further investigation, for researchers had found connections between other neurological disorders with oral microbiota [Citation58]. NO may regulate the potentially existing oral-brain axis, according to recent findings on the role of S-nitrosylation in gastrointestinal bacteria [Citation59].
Even though the male-to-female ratio in ASD is widely accepted as around 4:1 or 3:1 [Citation60,Citation61], it is still noteworthy to find that the difference of saliva nitrite, serum nitrite and nitrate was between boys in the ASD and Control groups, not between girls in this study (). Literatures have shown that there is a close connection between NO and estrogen, as NO-mediated estrogen effects in osteocytes [Citation62], or estrogen-regulated endothelial/inducible nitric oxide synthase (eNOS, iNOS) to protect females’ immune and cardiovascular systems at younger age via production of NO, instead of superoxide (O2−) [Citation63]. It is well known that ASD patients undertake higher oxidative stress, [Citation64] but whether sex makes a difference hadn’t been addressed in literature before. In this preliminary study of both saliva and serum NO for the first time, estrogen seems protecting female ASD children from unregulated oxidative stress. Certainly, there is a need for further verification and mechanistic studies.
Though blood NO was reported in few literatures before (), here positive correlation was reported between saliva nitrite and serum nitrate for both girls and boys with autism for the first time, which was missing in ND children. In literature, reduced expression of barrier-forming and increased pore-forming proteins were reported in ASD patients, suggesting alterations or damages of the blood–brain barrier and gut-blood barrier in these patients with schizophrenia and healthy subjects as control groups [Citation65]. Besides, certain bacteria-origin metabolites, including lipopolysaccharides and short chain fatty acids, were found in blood and urine of ASD children [Citation66]. This novel finding between saliva and serum NO may add another evidence to the interface changes at intestinal and blood–brain barriers. Certainly, further studies are needed to uncover the connection among metabolites in cerebrospinal fluid, blood, urine and saliva.
However, it is unclear whether this saliva-serum NO relation is a cause or an effect of autism pathogenesis. Volume and contents of saliva secretion are controlled by human automatic nervous system. As one of salivary inorganic anions, production and transportation of nitrite hasn’t been reported, while sialin was identified by Qin et al. as the major transporter of nitrate from blood to saliva [Citation67]. According to the nitrate-nitrite-NO pathway, levels of NO in saliva and serum are regulated by multiple factors, at least including production, consumption, transportation and reabsorption of different nitrogen-containing anions and gas molecules [Citation68]. Under aerobic conditions, nitrite may be generated from NO oxidation catalyzed by copper enzyme ceruloplasmin [Citation69], dismutation of nitrogen dioxide (NO2) [Citation70], hydration of dinitrogen trioxide (N2O3) [Citation71], or reduction of nitrate catalyzed by commensal bacterial nitrate reductase in oral cavity or gastrointestine [Citation67]. Consumption of nitrite may go through reduction to NO catalyzed by multiple nitrite reductases, or oxidation to nitrate catalyzed by oxygenated heme proteins [Citation72]. Apparently, salivary nitrite and serum NO have multiple sources. Therefore, it would be prudent to elucidate the contribution of each source, which would help precisely quantitate nitrite and nitrate in blood, saliva and other biological fluids, as well as fostering early and fast diagnosis of ASD and other nervous diseases.
Depending on its resource, concentration and timing of production, NO has been known to play a Janus face in the central nervous system. At its physiological level (usually low concentration), NO serves its neuroprotective role via S-nitrosylation of N-methyl-D-aspartate receptor subunits, activation of two important survival molecules Akt and cyclic AMP-responsive-element-binding protein or induction of one key cell stress-responding protein heme oxygenase-1 [Citation63]. At its excessive level (usually high concentration), NO becomes neurotoxic [Citation73]. For example, INF-γ could up-regulate inducible nitric oxide synthase (iNOS) in microglia, which produced high NO [Citation18]. The neurotoxic impact of high NO had been suggested due to peroxynitrite (ONOO−), which formed via the reaction of NO and superoxide (O2−) [Citation74]. Peroxynitrite is a short-life radical, which is readily decomposed to nitrate under acidic conditions or to nitrite at neutral/basic pH, or oxidizes protein to generate nitrotyrosine, This might explain higher NO production in plasma, red blood cells and urine of ASD population, compared to the control group. It was also in agreement with the reported significantly higher levels of 3-nitrotyrosine in the brain of ASD patients. Besides NO-related reactive nitrogen species (RNS), a few other oxidative parameters and cytokines were also reported significantly higher in ASD [Citation75]. Accumulated evidences have indicated that ASD patients were more vulnerable to oxidative pressure. Moreover, lower levels of antioxidants were observed in ASD population, including cysteine, reduced glutathione and vitamin D3 [Citation76]. It is still puzzling whether elevated nitrosative stress is one of the causes or results during ASD pathogenesis. Therefore, it would be useful to clarify cellular NO signaling and metabolic pathways in ASD etiology. Furthermore, re-balance of pro-oxidation and anti-oxidation homeostasis may contribute to therapy for ASD patients.
There are some limitations in this study as well. As a preliminary study of NO in saliva, sex distribution in the ASD and ND groups was not absolutely matched, which needs to be considered in the next-step verification studies. The study power value of saliva nitrite (>0.99) was reliable (p < 0.0001), but the power value of serum nitrate was close to 0.8, suggesting the need of a bigger and more selective validation group. The autistic patients who participated in this study were not subtyped based on their symptoms or pathophysiological status. This subtyping strategy can be applied in large population studies to minimize the potential confounding effects within the autistic group.
Conclusions
Salivary nitrite and its correlation with blood NO were reported in autistic children for the first time. Cotton swabbing was used for nitrite detection in saliva sampling, which served young children better. The preparation process of NaOH plus centrifugation was selected as the optimal method for saliva pretreatment, which stabilized saliva nitrite before quantification. Our findings demonstrated that salivary nitrite was significantly higher in the male ASD children than boys in the ND children. Additionally, the positive correlation among saliva nitrite and serum nitrate was only observed in the ASD children, not in the ND group. This preliminary study here lays the groundwork for future studies to explore saliva as a non-invasive diagnostic fluid for ASD, as well as the role of NO in autism diagnosis and therapeutics.
Supplemental Material
Download MS Word (239.2 KB)Acknowledgements
We thank Dr Reza A. Ghiladi of the Department of Chemistry at North Carolina State University for his insightful comments during experimental design.
Disclosure statement
The authors declare that the research was conducted in the absence of any commercial or financial relationships that could be construed as a potential conflict of interest.
Data availability statement
Due to the nature of this research, participants of this study did not agree for their personal data to be shared publicly, and they agreed to share the measured biochemical data online. All the biochemical data used in this study have been deposited to the https://data.mendeley.com/ database (DOI:10.17632/8kz7rwmwnt.1).
Additional information
Funding
References
- Association AP. Diagnostic and statistical manual of mental disorders: DSM-5. 5th ed. Washington, DC: American Psychiatric Association; 2013; 991.
- Ruggeri B, Sarkans U, Schumann G, et al. Biomarkers in autism spectrum disorder: the old and the new. Psychopharmacol. (Berl). 2014;231(6):1201–1216.
- Bridgemohan C, Cochran DM, Howe YJ, et al. Investigating potential biomarkers in autism spectrum disorder. Front Integr Neurosci. 2019;13:31.
- Bradford Y, Haines J, Hutcheson H, et al. Incorporating language phenotypes strengthens evidence of linkage to autism. Am J Med Genet. 2001;105(6):539–547.
- Ha S, Sohn IJ, Kim N, et al. Characteristics of brains in autism spectrum disorder: structure, function and connectivity across the lifespan. Exp Neurobiol. 2015;24(4):273–284.
- Bakeman R, Adamson LB. Coordinating attention to people and objects in mother-infant and peer-infant interaction. Child Dev. 1984;55(4):1278–1289.
- Gabrielsen TP, Anderson JS, Stephenson KG, et al. Functional MRI connectivity of children with autism and low verbal and cognitive performance. Mol Autism. 2018;9:67.
- Masi A, Glozier N, Dale R, et al. The immune system, cytokines, and biomarkers in autism spectrum disorder. Neurosci Bull. 2017;33(2):194–204.
- Tordjman S, Anderson GM, Bellissant E, et al. Day and nighttime excretion of 6-sulphatoxymelatonin in adolescents and young adults with autistic disorder. Psychoneuroendocrinology. 2012;37(12):1990–1997.
- Fu H, Deng W, Yao L, et al. Urinary NO(x), a novel potential biomarker for autism spectrum disorder. Free Radicals Biol Med. 2020;146:350–356.
- https://www.who.int/news-room/fact-sheets/detail/autism-spectrum-disorders.
- Lai MC, Lombardo MV, Baron-Cohen S. Autism. Lancet. 2014;383(9920):896–910.
- Chien YL, Chao CC, Wu SW, et al. Small fiber pathology in autism and clinical implications. Neurol. 2020;95(19):e2697–ee706.
- Meltzer A, Van de Water J. The role of the immune system in autism spectrum disorder. Neuropsychopharmacology. 2017;42(1):284–298.
- Cheng N, Rho JM, Masino SA. Metabolic dysfunction underlying autism spectrum disorder and potential treatment approaches. Front. Mol. Neurosci. 2017;10:34.
- Nadeem A, Ahmad SF, Attia SM, et al. Dysregulation in IL-6 receptors is associated with upregulated IL-17A related signaling in CD4+ T cells of children with autism. Prog. Neuropsychopharmacol. Biol. Psychiatry. 2020;97:109783.
- Reed MD, Yim YS, Wimmer RD, et al. IL-17a promotes sociability in mouse models of neurodevelopmental disorders. Nature. 2020;577(7789):249–253.
- Liu H, Talalay P, Fahey JW. Biomarker-guided strategy for treatment of autism spectrum disorder (ASD). CNS Neurol Disord: Drug Targets. 2016;15(5):602–613.
- Tostes MH, Teixeira HC, Gattaz WF, et al. Altered neurotrophin, neuropeptide, cytokines and nitric oxide levels in autism. Pharmacopsychiatry. 2012;45(6):241–243.
- Humphrey SP, Williamson RT. A review of saliva: normal composition, flow, and function. J Prosthet Dent. 2001;85(2):162–169.
- Aksit-Bicak D, Emekli-Alturfan E, Ustundag UV, et al. Assessment of dental caries and salivary nitric oxide levels in children with dyspepsia. BMC Oral Health. 2019;19(1):11.
- Al-Mashhadi A, Checa A, Wåhlin N, et al. Changes in arterial pressure and markers of nitric oxide homeostasis and oxidative stress following surgical correction of hydronephrosis in children. Pediatr Nephrol. 2018;33(4):639–649.
- Codoñer-Franch P, Tavárez-Alonso S, Murria-Estal R, et al. Nitric oxide production is increased in severely obese children and related to markers of oxidative stress and inflammation. Atherosclerosis. 2011;215(2):475–480.
- Forman D. Commentary: nitrites, nitrates and nitrosation as causes of brain cancer in children: epidemiological challenges. Int J Epidemiol. 2004;33(6):1216–1218.
- Powell HR, McCredie DA, Ritchie MA. Urinary nitrite in symptomatic and asymptomatic urinary infection. Arch Dis Child. 1987;62(2):138–140.
- Keith L DA M, Anne MR A. Clinically oriented anatomy. Philadelphia: Lippincott Williams & Wilkins; 2010.
- Farah R, Haraty H, Salame Z, et al. Salivary biomarkers for the diagnosis and monitoring of neurological diseases. Biomed J. 2018;41(2):63–87.
- Shi M, Sui YT, Peskind ER, et al. Salivary tau species are potential biomarkers of Alzheimer’s disease. J Alzheimer’s Dis. 2011;27(2):299–305.
- Zoroğlu SS, Yürekli M, Meram I, et al. Pathophysiological role of nitric oxide and adrenomedullin in autism. Cell Biochem Funct. 2003;21(1):55–60.
- Green LC, Wagner DA, Glogowski J, et al. Analysis of nitrate, nitrite, and [15N]nitrate in biological fluids. Anal Biochem. 1982;126(1):131–138.
- Ali O T, Akalin FA, Sahbazoglu KB, et al. Nitrite and nitrate levels of gingival crevicular fluid and saliva in subjects with gingivitis and chronic periodontitis. J Oral Maxillofac Res. 2014;5(2):e5.
- Mirvish SS, Reimers KJ, Kutler B, et al. Nitrate and nitrite concentrations in human saliva for men and women at different ages and times of the day and their consistency over time. Eur J Cancer Prev. 2000;9(5):335–342.
- Phizackerley PJ, Al-Dabbagh SA. The estimation of nitrate and nitrite in saliva and urine. Anal Biochem. 1983;131(1):242–245.
- Cardoso TMG, Garcia PT, Coltro WKT. Colorimetric determination of nitrite in clinical, food and environmental samples using microfluidic devices stamped in paper platforms. Anal Methods. 2015;7(17):7311–7317.
- Clodfelter WH, Basu S, Bolden C, et al. The relationship between plasma and salivary NOx. Nitric Oxide. 2015;47:85–90.
- Tanaka Y, Naruishi N, Fukuya H, et al. Simultaneous determination of nitrite, nitrate, thiocyanate and uric acid in human saliva by capillary zone electrophoresis and its application to the study of daily variations. J Chromatogr A. 2004;1051(1–2):193–197.
- Modi A, Morou-Bermudez E, Vergara J, et al. Validation of two point-of-care tests against standard lab measures of NO in saliva and in serum. Nitric Oxide. 2017;64:16–21.
- Ghasempour M, Qujeq D, Rabiee M, et al. Measurement of nitrite and nitrate in saliva of children with different caries activity. J Contemp Dent Pract. 2014;15(5):623–625.
- Maiti B, Walvekar AP, Krishnamoorthy TS. Separation and determination of inorganic anions by high-performance liquid chromatography using a micellar mobile phase. Analyst. 1989;114:731–733.
- Helaleh MI, Korenaga T. Ion chromatographic method for simultaneous determination of nitrate and nitrite in human saliva. J Chromatogr B Biomed Sci Appl. 2000;744(2):433–437.
- Pannala AS, Mani AR, Spencer JP, et al. The effect of dietary nitrate on salivary, plasma, and urinary nitrate metabolism in humans. Free Radic Biol Med. 2003;34(5):576–584.
- Tatarczak-Michalewska M, Flieger J, Kawka J, et al. HPLC-DAD determination of nitrite and nitrate in human saliva utilizing a phosphatidylcholine column. Molecules. 2019;24(9):1754.
- Tas FV, Guvenir T, Tas G, et al. Nitric oxide levels in disruptive behavioral disorder. Neuropsychobiology. 2006;53(4):176–180.
- Park HS, Yi SY, Yoon SA, et al. Comparison of the autism diagnostic observation schedule and childhood autism rating scale in the diagnosis of autism spectrum disorder: a preliminary study. J Korean Acad Child Adolesc Psychiatry. 2018;29(4):172–177.
- Hegde AM, Neekhra V, Shetty S. Evaluation of levels of nitric oxide in saliva of children with rampant caries and early childhood caries: a comparative study. J Clin Pediatr Dent. 2008;32(4):283–286.
- Toprakçi M, Ozmen D, Mutaf I, et al. Age-associated changes in nitric oxide metabolites nitrite and nitrate. Int J Clin Lab Res. 2000;30(2):83–85.
- Amdahl MB, DeMartino AW, Gladwin MT. Inorganic nitrite bioactivation and role in physiological signaling and therapeutics. Biol Chem. 2019;401(1):201–211.
- Hohensinn B, Haselgrübler R, Müller U, et al. Sustaining elevated levels of nitrite in the oral cavity through consumption of nitrate-rich beetroot juice in young healthy adults reduces salivary pH. Nitric Oxide. 2016;60:10–15.
- Schrenk D, Bignami M, Bodin L, et al. Risk assessment of nitrate and nitrite in feed. EFSA J. 2020;18(11):e06290.
- Lundberg JO, Weitzberg E, Gladwin MT. The nitrate-nitrite-nitric oxide pathway in physiology and therapeutics. Nat Rev Drug Discovery. 2008;7(2):156–167.
- Dos Santos DR, Souza RO, Dias LB, et al. The effects of storage time and temperature on the stability of salivary phosphatases, transaminases and dehydrogenase. Arch Oral Biol. 2018;85:160–165.
- Choudhury T, Sato EF, Inoue M. Nitrite reductase in Streptoccocus mutans plays a critical role in the survival of this pathogen in oral cavity. Oral Microbiol Immunol. 2007;22(6):384–389.
- Kalyoncu I, Tanboga I. Oral health status of children with autistic spectrum disorder compared with non-authentic peers. Iran J Public Health. 2017;46(11):1591–1593.
- Jaber MA. Dental caries experience, oral health status and treatment needs of dental patients with autism. J Appl Oral Sci. 2011;19(3):212–217.
- Hyde ER, Andrade F, Vaksman Z, et al. Metagenomic analysis of nitrate-reducing bacteria in the oral cavity: implications for nitric oxide homeostasis. PLoS One. 2014;9(3):e88645.
- Ahmed KA, Nichols AL, Honavar J, et al. Measuring nitrate reductase activity from human and rodent tongues. Nitric Oxide. 2017;66:62–70.
- Qiao Y, Wu M, Feng Y, et al. Alterations of oral microbiota distinguish children with autism spectrum disorders from healthy controls. Sci Rep. 2018;8(1):1597.
- Olsen I, Hicks SD. Oral microbiota and autism spectrum disorder (ASD). J Oral Microbiol. 2020;12(1):1702806.
- Seth P, Hsieh PN, Jamal S, et al. Regulation of MicroRNA machinery and development by interspecies S-Nitrosylation. Cell. 2019;176(5):1014–1025. e12.
- May T, Adesina I, McGillivray J, et al. Sex differences in neurodevelopmental disorders. Curr Opin Neurol. 2019;32(4):622–626.
- Loomes R, Hull L, Mandy WPL. What is the male-to-female ratio in autism spectrum disorder? A systematic review and meta-analysis. J Am Acad Child Adolesc Psychiatry. 2017;56(6):466–474.
- Joshua J, Kalyanaraman H, Marathe N, et al. Nitric oxide as a mediator of estrogen effects in osteocytes. Vitam Horm. 2014;96:247–263.
- White RE, Gerrity R, Barman SA, et al. Estrogen and oxidative stress: a novel mechanism that may increase the risk for cardiovascular disease in women. Steroids. 2010;75(11):788–793.
- Pangrazzi L, Balasco L, Bozzi Y. Oxidative stress and immune system dysfunction in autism spectrum disorders. Int J Mol Sci. 2020;21(9):3288.
- Fiorentino M, Sapone A, Senger S, et al. Blood-brain barrier and intestinal epithelial barrier alterations in autism spectrum disorders. Mol Autism. 2016;7:49.
- Srikantha P, Mohajeri MH. The possible role of the microbiota-gut-brain-axis in autism spectrum disorder. Int J Mol Sci. 2019;20(9):2115.
- Lundberg JO. Nitrate transport in salivary glands with implications for NO homeostasis. Proc Natl Acad Sci U. S. A. 2012;109(33):13144–13145.
- Lundberg JO, Weitzberg E, Cole JA, et al. Nitrate, bacteria and human health. Nat Rev Microbiol. 2004;2(7):593–602.
- Shiva S, Wang X, Ringwood LA, et al. Ceruloplasmin is a NO oxidase and nitrite synthase that determines endocrine NO homeostasis. Nat Chem Biol. 2006;2(9):486–493.
- Tahon JP, Maes G, Vinckier C, et al. The reaction of nitrite with the haemocyanin of the Roman snail (Helix pomatia). Biochem J. 1990;271(3):779–783.
- Basu S, Grubina R, Huang J, et al. Catalytic generation of N2O3 by the concerted nitrite reductase and anhydrase activity of hemoglobin. Nat Chem Biol. 2007;3(12):785–794.
- Wang J, Keceli G, Cao R, et al. Molybdenum-containing nitrite reductases: spectroscopic characterization and redox mechanism. Redox Rep. 2017;22(1):17–25.
- Calabrese V, Mancuso C, Calvani M, et al. Nitric oxide in the central nervous system: neuroprotection versus neurotoxicity. Nat Rev Neurosci. 2007;8(10):766–775.
- Sultana R, Poon HF, Cai J, et al. Identification of nitrated proteins in Alzheimer’s disease brain using a redox proteomics approach. Neurobiol Dis. 2006;22(1):76–87.
- Saghazadeh A, Ataeinia B, Keynejad K, et al. A meta-analysis of pro-inflammatory cytokines in autism spectrum disorders: effects of age, gender, and latitude. J Psychiatr Res. 2019;115:90–102.
- Cannell JJ. Vitamin D and autism, what’s new? Rev Endocr Metab Disord. 2017;18(2):183–193.