
ABSTRACT
Objectives: The present study describes a pharmacological strategy for the treatment of glioblastoma by redoxcycling ‘mitocans’ such as quinone/ascorbate combination drugs, based on their tumor-selective redox-modulating effects and tolerance to normal cells and tissues.
Methods: Experiments were performed on glioblastoma mice (orthotopic model) treated with coenzyme Q0/ascorbate (Q0/A). The drug was injected intracranially in a single dose. The following parameters were analyzed in vivo using MRI orex vivo using conventional assays: tumor growth, survival, cerebral and tumor perfusion, tumor cell density, tissue redox-state, and expression of tumor-associated NADH oxidase (tNOX).
Results: Q0/A markedly suppressed tumor growth and significantly increased survival of glioblastoma mice. This was accompanied by increased oxidative stress in the tumor but not in non-cancerous tissues, increased tumor blood flow, and downregulation of tNOX. The redox-modulating and anticancer effects of Q0/A were more pronounced than those of menadione/ascorbate (M/A) obtained in our previous study. No adverse drug-related side-effects were observed in glioblastoma mice treated with Q0/A.
Discussion: Q0/A differentiated cancer cells and tissues, particularly glioblastoma, from normal ones by redox targeting, causing a severe oxidative stress in the tumor but not in non-cancerous tissues. Q0/A had a pronounced anticancer activity and could be considered safe for the organism within certain concentration limits. The results suggest that the rate of tumor resorption and metabolism of toxic residues must be controlled and maintained within tolerable limits to achieve longer survival, especially at intracranial drug administration.
Introduction
‘Mitocans’ is an acronym derived from ‘mitochondria’ and ‘cancer’[Citation1]. It describes a new generation of anticancer drugs that target mitochondria and disrupt their functions interfering with: (i) respiratory chain and oxidative phosphorylation (OXPHOS); (ii) tricarboxylic acid (TCA) cycle; (iii) redox-regulating enzymes; (iv) mitochondrial apoptotic and tumor-suppressor signaling pathways; (v) mitochondrial fission; (vi) mitochondrial DNA (mtDNA), and others [Citation2]. In general, their anticancer effect is mediated by overproduction of reactive oxygen species (ROS) and induction of severe oxidative stress and redox imbalance, violating retrograde (mitochondria-to-nucleus) signaling pathways, which is detrimental to cancer [Citation1–3].
Our interest is directed to ‘mitocans’, targeting the specific metabolism of impaired cancerous mitochondria, and inducing oxidative stress and redox imbalance in cancer cells, causing their death without affecting the viability of normal cells and tissues. Such ‘mitocans’ may provide selective cancer treatment that is tolerable for the patient and improves quality of life. We consider that redox-cycling ‘mitocans’ like quinone/ascorbate (Q/A) redox-pairs are some of the most attractive candidates.
Benzoquinone coenzyme Q0 (unprenylated Q10 analog) and naphthoquinone menadione (unprenylated vitamin K analog known as pro-vitamin K3) are one of the most interesting redox-cycling ‘mitocans’ among the many known synthetic and natural drugs with a quinone unit in their molecules. Coenzyme Q, menadione, and ascorbate are recognized as vital regulators of cellular redox signaling that is crucial for cell fate – senescence or proliferation.
Administered alone or in combination with ascorbate, Q0 and menadione can interact with molecular oxygen, causing oxidative stress and subsequent replicative stress in transformed cells [Citation4–10]. Our recent studies provide experimental evidence that menadione/ascorbate (M/A)-induced cytotoxicity in cancer cells is mediated by their redox-cycling in the impaired cancerous mitochondria, which is accompanied by overproduction of mitochondrial superoxide, decrease of mitochondrial membrane potential, NADH/NAD+ ratio, oncometabolite succinate, and accelerated ATP depletion [Citation4,Citation5]. In normal cells, M/A was found to induce a mild oxidative stress that was well tolerated [Citation4] and did not affect their redox and energy homeostasis.
Q/A redox-pairs have emerged as a tolerable redox platform in cancer therapy due to their multiple beneficial effects: (i) synergistic cytotoxicity to cancer cells but not to normal cells within certain concentration limits [Citation4,Citation6,Citation7,Citation11]; (ii) suppression of colony formation and invasion [Citation7,Citation11]; (iii) suppression of tumor growth and metastasis in vivo [Citation4,Citation7]; (iv) anti-inflammatory and immunomodulating effects [Citation4,Citation5,Citation11]; (v) potentiation of the effectiveness of conventional chemotherapy and radiation therapy [Citation1,Citation4]. Most of these studies have focused on the M/A redox-pair, whose safety and effectiveness of oral administration for cancer treatment have been demonstrated in clinical trials [Citation12,Citation13].
Coenzyme Q is one of the most widely studied quinones, including in cancer, due to its essentiality in mammals. Coenzyme Q10 is a key component of the mitochondrial ETC, where it acts as an electron transporter. It also links the respiratory chain to other metabolic pathways that are essential for cell viability and proliferation [Citation14]. However, cancer patients rarely respond to Q10 supplementation, and the treatment has not been approved as effective [Citation15].
Non-prenylated quinones appear to have greater potential as anticancer agents than prenylated ones. For example, menadione has been found to be more effective than vitamins K1 and K2 [Citation4,Citation16,Citation17]. Synergistic antiproliferative and cytotoxic effects on cancer cells are inherent for the M/A combination, but not for the K1/A and K2/A combinations [Citation4]. Non-prenylated and short-chain quinones (Q0, Q1, Q2) have also been shown to exhibit marked cytotoxicity to cancer cells, but not long-chain Q10 [Citation10,Citation18]. The prenylation could explain, at least in part, the lack of effectiveness of Q10 in the treatment of cancer. Vitamin K and coenzyme Q are most likely prenylated by the same prenyltransferase, UBIAD1 (TERE1) [Citation19,Citation20], known as a tumor suppressor that is downregulated in many cancers [Citation21]. Based on these findings, we hypothesized that Q/A redox-pairs containing unprenylated quinones such as Q0 should be more effective as anticancer drugs than those containing prenylated quinones such as Q10. However, this assumption needs experimental verification. It should be noted that Q0 is one of the main active ingredients in medicinal mushrooms [Citation8,Citation9] and should be safe for humans.
Benzoquinones are considered more effective as anticancer agents than naphthoquinones [Citation11,Citation22]. However, most studies have been conducted on cultured cancer cells without considering the effects of quinones on normal cells and tissues. Little is known about their tolerance in mammals, especially when quinones are administered in combination with ascorbate, and to our knowledge there are no published data comparing the anticancer effects of benzoquinone/ascorbate versus naphthoquinone/ascorbate in vivo. Some of the most widely used conventional anticancer drugs are quinone-based – mitomycin C, daunorubicin, doxorubicin, mitoxantrone. They exert their therapeutic effect through intracellular and extracellular redox-cycling, which leads to the generation of ROS and the destruction of cancer cells, but their selectivity and tolerability are very disputable [Citation11,Citation23]. It is well known that their therapeutic effect is accompanied by compromised tolerability due to multiple harmful side-effects arising from the induction of a generalized oxidative stress [Citation11,Citation23–25].
The aim of the present study was: (i) to elucidate the effectiveness of Q0/A as an anticancer combination drug in vivo and its tolerance to normal tissues; (ii) to clarify some of the mechanisms of its anticancer activity; and (iii) to compare the effects of Q0/A with those of M/A published in our previous article [Citation5], considering which of the two redox-pairs is more efficient, tolerant, and promising for translational research. The experiments with Q0/A and M/A were performed under the same conditions, including cancer model, drug dose and treatment protocol, analytical methods, parameters analyzed, data collection, and others.
Materials and methods
Chemicals
L-Ascorbic acid were purchased from Sigma-Aldrich (Weinheim, Germany). Coenzyme Q0 was purchased from Cayman (Ann Arbor, MI, USA). All reagents used in the experiments were ‘analytical grade’ or ‘HPLC-grade’.
Total antioxidant capacity (TAC) assay
TAC assay was performed on tissue lysates using OxiSelectTM Total Antioxidant Capacity (TAC) Assay kit (Cell Biolabs, Inc., San Diego, CA, USA), following the manufacturer`s instruction. The method is based on the reduction of Cu2+ to Cu+ by antioxidants and other reducing equivalents in the biological sample. Cu+ interacts with a chromophore to obtain a color product with an absorption maximum at 490 nm, which was detected by a microplate reader Tecan Infinite F200 PRO (Grodig, Austria). The value of the absorption is proportional to the total antioxidant, respectively reducing capacity of the biological object. Uric acid was used as a standard. All samples were run in triplicate. The results are calculated as a ‘Total Antioxidant Capacity (TAC)’, which is equivalent to ‘Total Reducing Capacity’ (TRC) in ‘mM Uric Acid Equivalents’. One mM of uric acid corresponds to 2189 μM of Cu2+-reducing equivalents. The protein concentration in the lysates was determined by Bradford assay and data were normalized to equal protein concentration in the samples.
tNOX (ENOX2) assay
Ecto-NOX disulfide-thiol exchanger 2 (ENOX2, tNOX) expression was detected in tissue lysates using the Mouse ENOX2 ELISA kit (LifeSpan BioScience, Washington, DC, USA) as it was described in our previous article [Citation5]. Lyophilized tNOX (ENOX2) protein was used as a standard. All samples were run in triplicate. The protein concentration in the lysates was determined by Bradford assay and data were normalized to equal protein concentration in the samples.
Protein concentration assay
Protein concentration in cell and tissue lysates were measured using Quick StartTM Bradford Protein Assay kit (BioRad, Hercules, CA, USA) following the manufacturer’s instruction. The method is based on the binding of Coomassie Brilliant Blue G-250 dye to proteins, which is accompanied by its conversion from a protonated red cationic form with absorbance at 470 nm to a stable unprotonated blue form with absorbance at 595 nm. Bovine serum albumin was used as a standard to obtain the calibration curve. The analysis was performed in 96-well plates and absorbance of the blue protein-dye form was detected by a microplate reader Tecan Infinite F200 PRO operating in a spectrophotometric mode.
Animals, treatment protocol, and MRI measurements
The animal experiments were approved by the National Institutes for Quantum Science and Technology (QST) Institutional Animal Care and Use Committee (protocol #14-1006), Chiba, Japan, and all experiments were performed in accordance with relevant guidelines and regulations.
Glioblastoma-bearing BALB/c nude mice (mile, 6–8 weeks of age) were obtained from Japan SLC Inc. (Shizuoka, Japan). Mice were maintained in specific pathogen-free conditions and placed on a vitamin C and menadione deficient diet (CLEA, Tokyo, Japan) one day before cell transplantation. The diet contained the minimum amount of vitamin K1, which is essential for mice. Since we are investigating the effects of quinone/ascorbate redox-pair, the exclusion of menadione and vitamin C from the diet aimed to eliminate the effect of oral administration of M/A combination on that of parenteral administration of Q0/A and M/A.
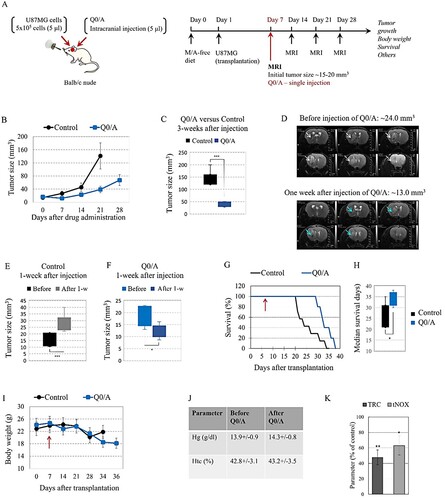
The experimental design is shown in (A). U87MG cells (5 × 10⁵ cells in 5 μl) were transplanted intracranially in the mouse to trigger a development of brain glioblastoma. The cancer-bearing mice were divided into two groups: (i) control group – single intracranial injection of saline solution; (ii) Q0/A-treated group – single intracranial injection of Q0/A (70 μg/7 mg per kg body weight) on day 7th after cell transplantation. The volume of injections was 5 μl, respectively.
Figure 1. Effects of coenzyme Q0/ascorbate (Q0/A) on tumor growth, body weight, and survival of cancer-bearing mice:(A) Experimental design. (B) Effect of single intracranial injection (5 μl) of Q0/A on tumor growth in the brain of U87MG glioblastoma-grafted mice, detected by T2-weighted magnetic resonance imaging (MRI) within 35 days after cell transplantation and 28 days after drug administration (70 μg/7 mg of Q0/A per kg body weight). The drug was administered on day 7th of the brain cell transplant, when the tumor size was 14.2 ± 4.5 mm3 in the control group and 18.3 ± 4.3 mm3 in the Q0/A-treated group. Number of mice in each experimental group: Control group (n = 7); Q0/A-treated group (n = 5). Data means ± SD from 3 mice at each time point. (C) Comparison of tumor size between control group and Q0/A-treated group, measured 3 weeks after intracranial injection of saline solution or Q0/A, respectively (***p < 0.001 versus control group). (D) Representative T2W magnetic resonance images of tumor size in the brain obtained before injection and one week after intracranial injection of Q0/A. Tumor size decreased twice after Q0/A treatment. (E) Comparison of tumor size in the control group, detected before and 1 week after intracranial injection of saline solution (***P < 0.001 versus before injection). (F) Comparison of tumor size in the Q0/A-treated group, detected before and 1 week after intracranial injection of Q0/A (*p < 0.05 versus before injection). (G) Effect of single intracranial injection of Q0/A on survival of glioblastoma-grafted mice. Red arrow indicates the time of injection (day 7th after cell transplantation). Data are means ± SD from 7 mice in the control group and 5 mice in the Q0/A-treated group. (H) Median survival of mice in the groups described in (F) (*p < 0.05 versus control group). (I) Dynamics of body weight of control and Q0/A-treated glioblastoma-grafted mice. Red arrow indicates the time of injection (day 7th after cell transplantation). At each time point, the data are means ± SD from 2 to 7 mice in the control group and 2–5 mice in the Q0/A-treated group, depending on their survival.(J) Hematological parameters analyzed in mice before and after intravenous administration of Q0/A (140 μg/14 mg per kg body weight) in healthy mice. Data are means ± SD from 3 mice in each group with three measurements for each specimen. (K) Ex vivo analysis of: (i) total reducing capacity (TRC); (ii) and expression of tNOX in the brain tissues isolated from Q0/A-treated glioblastoma-bearing mice. Data are means ± SD from 3 mice in each group with three measurements for each specimen. Tissue and blood specimens were collected 1-week after the start of Q0/A administration and 2-weeks after cell transplantation. Samples isolated from untreated mice were used as controls. Data are expressed as % of the respective control. *p < 0.05, ***p < 0.001 versus untreated (control) group.
Each mouse was anesthetized with isoflurane (3% for initial induction and 1–2% during MRI scanning). This is the only anesthesia used in the study. Mouse was placed in the prone position on a custom-built MRI stage with a bite bar and a facemask. The respiration rate was monitored using a respiration sensor (SA Instruments, Inc., Stony Brook, NY, USA) and was regulated at 80–120 breaths per minute. The core body temperature was monitored with a rectal probe (FOT-L and FTI-10, FISO Technologies Inc., Germany) and was regulated at 37.0 ± 1.0°C using a water circulating pad and a warm circulation air system. MRI data were acquired using a horizontal 7.0-T Bruker BioSpec 70/40 MRI system with an 86 mm volume transmit and a 4-channel phased array receiving cryoprobe (Bruker Biospin, Ettlingen, Germany). The software and console of the MRI scanner was ParaVision 360 and AVANCE NEO, respectively. Following the standard adjustment routines, pilot scans (Triplet sequence) were used for accurate positioning of the animal head inside the magnet. Four parameters were analyzed in vivo using MRI: (i) tumor size; (ii) cerebral blood flow (CBF); (iii) apparent diffusion coefficient (ADC); and (iv) tissue redox-state. The first three parameters were analyzed by native MRI, while the fourth parameter was analyzed by nitroxide-enhanced MRI using mito-TEMPO as redox-sensitive probe. Details are described in our previous study [Citation5]. MRI data analysis was performed using custom-written software in MATLAB (MathWorks, Natick, MA, USA).
Statistical analysis
All results are expressed as Means ± Standard Deviation (SD). The normality of the distribution for all parameters of each experimental group in vivo was initially confirmed by using the Kolmogorov–Smirnov test. The most extreme differences for all experimental groups were below the critical D-values. Based on the normality of distribution in all groups, the comparisons between them were performed using the Student’s t-test for multiple comparisons. Two-tailed p values of less than 0.05 were considered statistically significant.
Results
Effect of Q0/A on tumor growth and survival
Glioblastoma cells were transplanted into the brain and the tumor was visualized by T2-weighted (T2W) MRI one week after transplantation. The initial tumor size was approximately 15–20 mm3. The mice were divided into two groups: (i) drug-treated – single intracranial injection of Q0/A; and (ii) control – single intracranial injection of saline solution; and tumor growth was analyzed by MRI.
Q0/A significantly decreased tumor growth compared to the control group ((B)). Three weeks after a single injection of Q0/A, the tumor size was 38.5 ± 10.3 mm3 versus 141.4 ± 29.7 mm3 in the control group (P < 0.001) ((C)). Representative T2W magnetic resonance images of brain glioblastoma are shown in (D). Prior to Q0/A injection, the tumor was visualized on six slices and was approximately 24 mm3 in size. One week after Q0/A injection, the tumor was visualized on four slices and its size was twice as small (∼13 mm3). In the control group, the mean tumor size increased significantly within one week after saline injection ((E)), while in the Q0/A-treated group, it decreased significantly within one week after drug injection ((F)).
Q0/A-treated mice had a longer lifespan than control mice ((G)). Median survival was 33.8 ± 3.2 days for the Q0/A-treated mice versus 25.8 ± 5.4 days for the control mice (P < 0.05) ((H)). It should be noted that in the two longest-lived mice, the injection of Q0/A was intratumoral, which was visualized on T2W magnetic resonance images obtained within a few days after injection. In the other three mice, the intracranial injection was close to the tumor but not intratumoral.
The body weight in both experimental groups was relatively stable within 3 weeks after cell transplantation but decreased ∼20–25% thereafter ((I)). Q0/A did not cause erythropenia and hemolysis, as analyzed by hemoglobin and hematocrit levels in the blood samples collected before and after intravenous injection at a dose that was twice as high as that injected intracranially ((J)). Q0/A significantly decreased the expression of tNOX in the brain (∼40% compared to controls) as well as the overall reducing capacity of brain tissues ((K)).
Effects of Q0/A on tissue redox-state in vivo
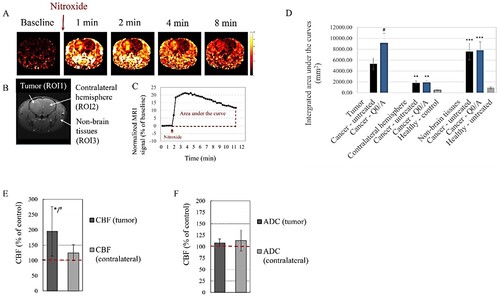
Tissue redox-state of Q0/A-treated mice was also analyzed in vivo in dynamics by nitroxide-enhanced MRI after intravenous administration of a redox-sensitive nitroxide probe (). The color images in (A) represent the calculated extracted MRI signal obtained after nitroxide injection and normalized to the native baseline signal obtained before injection. The signal was high and long lived in the tumor area and non-brain tissues ((A)). Three regions-of-interest (ROIs) were selected: (i) the tumor area in the brain (ROI1); (ii) the contralateral non-cancerous hemisphere (ROI2), and (iii) the surrounding (non-brain) tissues (ROI3) ((B)). ROI2 and ROI3 were selected for comparison with untreated healthy mice. Kinetic curve of MRI signal dynamics in each ROI was generated from the images and the area under the curve was integrated over the same time interval ((C)). The enhancement of the MRI signal in the beginning is due to the presence of paramagnetic nitroxide in the bloodstream and its penetration and accumulation in the respective tissue, while the attenuation of the signal is the result of two processes – reduction of nitroxide to diamagnetic hydroxylamine, which occurs mainly in cells, and its excretion by the kidneys. In healthy mice, the integrated nitroxide-enhanced MRI signal in ROI2 and ROI3 was markedly lower than that of cancer-bearing mice ((D)). It is a marker of higher oxidative capacity of the tissues of cancer-bearing mice compared to healthy mice. Q0/A increased oxidative capacity of the tumor (ROI1) compared to the tumor of untreated mice but did not affect the redox-state in the contralateral hemisphere (ROI2) and surrounding non-brain tissues (ROI3). Q0/A significantly increased tumor blood flow but not CBF in the contralateral hemisphere compared to untreated mice ((E)). ADC values in the tumor and contralateral hemisphere were not significantly affected by Q0/A, although there was a tendency to decrease this parameter in the Q0/A-treated group ((F)).
Figure 2. Effects of coenzyme Q0/ascorbate (Q0/A) on tissue redox status, cerebral perfusion assessed by cerebral blood flow (CBF), and cell density assessed by apparent diffusion coefficient (ADC) in glioblastoma-bearing mice: (A) Representative nitroxide-enhanced magnetic resonance images of glioblastoma-bearing brain, obtained at different time intervals after intravenous injection of nitroxide probe (mito-TEMPO) – a marker of tissue redox activity. Color images represent the calculated extracted MRI signal obtained after injection of the nitroxide probe and normalized to the baseline (native) signal obtained before injection. (B) Definition of regions-of-interest (ROIs): ROI1 – tumor area; ROI2 – contralateral hemisphere; ROI3 – non-brain issues (black and white image). (C) Representative calculated kinetic curve of nitroxide-enhanced MRI signal in a glioblastoma-grafted mice, obtained within 12 min after i.v. injection of mito-TEMPO. The areas under the curves were integrated and the averaged data are presented in (D). (D) Integrated areas under the kinetic curves obtained by different experimental groups. *p < 0.05 versus tumor (ROI1); ##p < 0.01, ###p < 0.001 versus healthy untreated mice. Data means ± SD from 3 mice in each group with three measurements (slices) per mouse. (E, F) Effects of Q0/A on brain perfusion analyzed by CBF (E) and cell density analyzed by ADC (F) using brain MRI of glioblastoma-bearing mice within two weeks after intracranial injection of the drug. *p < 0.05 versus Control (untreated) group; #p < 0.05 tumor versus contralateral hemisphere. Data are means ± SD from 3 mice in each group.
Discussion
Briefly, our study demonstrates that a single intracranial injection of Q0/A significantly suppresses tumor growth and increases survival of glioblastoma mice, which was accompanied by increased oxidative stress in the tumor but not in non-cancerous tissues, increased tumor perfusion, and down-regulation of tNOX.
It is generally accepted that benzoquinones have better potential as anticancer drugs than naphthoquinones [Citation11,Citation22]. However, this notion derives mainly from experiments on isolated cell lines, using different protocols, doses, methodologies, etc. Below, we provide a comparative analysis of the anticancer effects of Q0/A and M/A in vivo, which is based on identical experimental design, applied dose, analytical methods, and analyzed parameters (). Details of the M/A-treated glioblastoma mice (orthotopic U87MG model) are described in our previous article [Citation5].
Table 1. Effects of quinone/ascorbate combinations in mice with brain glioblastoma (intracranial model, single administration) – coenzyme Q0/ascorbate (Q0/A) versus menadione/ascorbate (M/A).
The most interesting observation was that Q0/A suppressed tumor growth much more effectively than M/A, but the survival of Q0/A-treated mice was shorter than that of M/A-treated mice (). Both drugs significantly decreased the reducing capacity of brain tissues analyzed ex vivo by TAC/TRC assay, as well as tNOX expression in the brain and their effects on these parameters were similar (). However, there was a difference in the effects of the two redox-pairs on the redox-state of tumor tissue and normal surrounding tissues analyzed in vivo using nitroxide-enhanced MRI. Q0/A and M/A significantly increased oxidative stress in the tumor but did not affect the tissue redox-state in the contralateral hemisphere ((D)) [Citation5]. M/A significantly decreased oxidative stress in normal non-brain tissues of glioblastoma mice distant from the primary tumor locus [Citation5], which was not observed for Q0/A ((D)). M/A appears to be more tolerable than Q0/A, especially when administered intracranially at the selected dose (70 μg/7 mg per kg body weight).
Similar tendencies were observed in our previous study on an orthotopic GS9L glioblastoma model comparing mice treated intracranially with M/A or temozolomide (TMZ) [Citation26]. TMZ is the ‘gold standard’ for first-line chemotherapy of patients with glioblastoma [Citation27]. The survival of M/A-treated mice was comparable to that of TMZ-treated at the doses we have tested so far, although the effect of M/A on tumor growth was much less pronounced than that of TMZ [Citation26]. The tumor size decreased markedly within a few days after the intracranial injection of TMZ, but this was accompanied by severe side-effects such as tetraplegia, convulsions, fever, cachexia [Citation26]. The same side-effects have been reported by other authors even with oral administration of the drug [Citation28]. We hypothesize that the rapid destruction of tumor in TMZ-treated mice most likely leads to the release of a large amount of toxic substances that cannot be quickly eliminated, which is detrimental when it occurs in the brain. This could also apply to Q0/A, especially with intracranial administration, given the tumor resorption in the first days of treatment ((F)). This may be one of the reasons for the shorter survival of TMZ-treated and Q0/A-treated mice compared to M/A-treated mice in our intracranial models.
We would like to highlight recent studies on cancer cells and cancer-bearing animals treated with coenzyme Q0 or menadione, which may explain, at least in part, the different anticancer effects of Q0/A and M/A on the intracranial glioblastoma model described in our article.
We recently proposed a hypothetical mechanism for the selective anticancer effect of quinone/ascorbate redox-pairs based on the highly specific redox-cycling between the two substances in cancerous mitochondria [Citation4,Citation5,Citation29]. It assumes that cancerous mitochondria are over-loaded with reducing equivalents, such as NADN and succinate (one of the major oncometabolites), as well as over-charged to the high coenzyme Q10H2/Q10 ratio [Citation30–32]. The mobile unprenylated quinones as Q0 and menadione can replace the poorly mobile and over-reduced coenzyme Q10 in complex III of the respiratory chain, and to be converted into semiquinones [Citation29]. The unprenylated semiquinone can easily leave the active site of complex III and interact with molecular oxygen in the mitochondrial matrix, causing overproduction of superoxide. Quinone/ascorbate combination containing unprenylated quinones, such as Q0 and menadione, were found to induce overproduction of mitochondrial superoxide in cancer cells [Citation29]. In turn, production of superoxide requires electrons coming from reducing equivalents. This leads to depletion of succinate and NADH in mitochondria, as well as to depolarization of mitochondrial membrane [Citation4,Citation5]. At high doses of Q0/A and M/A, these processes trigger mitochondrial collapse, severe ATP depletion and cell death. At low/tolerable doses of Q0/A and M/A, these processes could sensitize cancer cells to conventional anticancer drugs, radiation therapy, and the immune system [Citation4]. The mitochondria of normal cells are not over-loaded and over-charged, which hampers the redox-cycling of the two substances in them. Thus, quinone/ascorbate redox-pairs could recognize cancer cells and exert their targeted anticancer effect. Experimental evidence for this hypothetical mechanism has been described in our previous articles [Citation4,Citation5,Citation29].
Despotovic et al. reported that mild oxidative stress, induced by tolerable concentrations of menadione (5–20 μM), triggers non-toxic autophagy in human glioblastoma cells (U251), which protects them [Citation33]. However, ascorbate (500–2000 μM) converts menadione-induced autophagy from nontoxic to cytotoxic, which is accompanied by severe oxidative stress [Citation33]. The authors analyzed the following markers: autophagosome-associated LC3-II expression, belcin-1 expression, and p62 degradation. Cytoprotective menadione-induced autophagy, which is associated with the ‘cleanup’ of impaired mitochondria, may explain, at least in part, the decrease of oxidative stress in non-cancerous tissues of M/A-treated mice found in our previous study [Citation5]. With topical application of M/A, the accumulation and retention of menadione and ascorbate inside and around the tumor should be significantly greater than in tissues distant from the primary tumor locus. Both substances are characterized by different pharmacokinetics in vivo, and it is unlikely that a cytotoxic concentration in healthy tissues will be reached when the combination drug is administered topically. Thus, high concentrations of M/A in the brain would trigger severe oxidative stress and cytotoxic autophagy in the tumor. In non-brain tissues, the concentrations of menadione and ascorbate should be much lower and would induce cytoprotective autophagy or not affect mitochondrial function in them.
Severe oxidative stress and cytotoxic autophagy activation were recently reported in human glioblastoma cells (U87MG, GBM8401) treated with 10–30 μM of Q0[Citation9]. The authors analyzed the same autophagy markers as mentioned above. The combination of Q0 with ascorbate was not investigated in their study. It is interesting to note that Q0 induced cytotoxic autophagy at 20 μM in human glioblastoma [Citation9], whereas menadione induced cytoprotective autophagy at the same concentration [Citation33]. The same authors reported a significant induction of ROS production in Q0-treated glioblastoma cells as well as induction of apoptosis [Citation9], while the effect of menadione on these parameters was negligible at the same doses [Citation33]. Therefore, doses that are harmless to non-cancerous cells and tissues in the case of menadione may be harmful in the case of Q0, especially for intracranial administration. In a pilot study, we observed that intracranial injection of 140 μg/14 mg of Q0/A per kg body weight resulted in impressive suppression of tumor growth and its resorption, but the survival of glioblastoma mice was shorter than those treated with 70 μg/7 mg of Q0/A per kg body weight. This could explain, at least in part, the shorter survival of Q0/A-treated mice compared to M/A-treated mice in our intracranial glioblastoma model when the drugs were administered at equal doses. Therefore, lowering the dose of Q0 in the Q0/A combination may increase survival without compromising its effect on tumor growth. However, this assumption needs experimental verification.
Yang et al. reported that Q0 (1 mg per kg body weight) administered intraperitoneally in glioblastoma mice (U87MG and GBM8401 hind paw xenografts) every 2 days within 24 days significantly suppressed tumor growth compared to untreated controls [Citation9]. In U87MG xenografts, a reduction in tumor size was also observed in their study. Coenzyme Q crosses the blood–brain barrier [Citation34] and multiple injections of Q0 may possibly solve the problem of tumor growth recovery. Multiple administration of the drug is easily achieved by intraperitoneal or intravenous injections. However, it is disputable whether these modes of administration will achieve effective therapeutic doses in the brain. In addition, multiple intracranial drug administration requires an appropriate catheter system and neurosurgical procedure to maintain intracranial pressure, as well as to ensure a normal brain function and a normal general condition. At present, this is difficult to achieve on small animals, but it seems possible on large animals and humans using an Ommaya reservoir.
Downregulation of tNOX in mice treated with Q0/A and M/A is also an interesting fact, supporting the assumption of the tolerance of both redox-pairs to cancer-bearing organisms and their selective anticancer effects (). tNOX has been found to be up-regulated in cancer cells, down-regulated in slow-proliferating non-cancer cells, and currently undiscovered in non-proliferating normal cells [Citation35,Citation36]. Thus, suppression of tNOX with anticancer drugs such as Q0/A and M/A could selectively inhibit cell growth and induce apoptosis in cancer cells and tissues, but not in normal ones. Up-regulation of tNOX correlates with a poor prognosis and low survival in patients with glioblastoma [Citation35,Citation36]. Inhibition of tNOX expression and/or activity was recently reported to affect mitochondrial function, increasing ROS-dependent cytotoxic mitophagy and inducing apoptosis in cancer cells [Citation37]. In this context, tNOX could be a valuable therapeutic target, distinguishing cancer cells from normal cells and enabling selective damage of cancerous mitochondria by redox-cycling ‘mitocans’ like Q0/A and M/A.
The MRI analysis of CBF and ADC () provides further evidence of the versatile effects of Q0/A and M/A and the complexity of their selectivity to cancer and tolerance to normal tissues. CBF is a marker for cerebral perfusion [Citation38,Citation39]. Brain tumors are known with their poor perfusion combined with severe fibrosis. This maintains their hypoxic and malignant behavior without disrupting the flow of essential metabolites for cell proliferation and invasion. Glioblastoma is characterized by endothelial dysfunction, endothelial-to-mesenchymal transition, and neuroinflammation due to interplay between the tumor and surrounding microglial cells [Citation40,Citation41]. One of the strategies to increase the effectiveness of conventional therapy of brain tumors is to suppress neuroinflammation in normal brain tissues without affecting the recognition and elimination of cancer cells by the native immune system. The delivery of anti-inflammatory agents to the brain and suppression of general neuroinflammation are tightly related to the CBF and tumor blood flow (TBF). Increased cerebral perfusion could facilitate the penetration of conventional drugs into the tumor and potentiate their therapeutic effect. Our data demonstrated that Q0/A and M/A significantly increased bloodflow in the tumor (). Intracranial administration of M/A significantly increased CBF in the contralateral hemisphere as well, but not intracranial administration of Q0/A although there was a tendency (). Q0 and menadione were also found to inhibit inflammation by targeting the NLRP3 inflammasome [Citation42,Citation43]. M/A has been shown to suppress PD-L1 expression in cancer cells [Citation4]. This is indirect evidence that Q0/A and M/A can suppress neuroinflammation in the brain of glioblastoma mice, alleviating the harmful side-effects and increasing their survival.
ADC is a measure of the magnitude of water diffusion in tissues [Citation44,Citation45] and is sensitive to the microenvironment of the tumor and its cell density [Citation46,Citation47]. Solid tumors are characterized by compact structure with high cell density due to many cancer cells in mitosis and a ‘tight’ microenvironment composed of fibroblasts, immune cells, and other cellular components [Citation47]. All these cellular factors restrict the diffusion of water in the tumor and ADC correlates negatively with them. In contrast, apoptotic or necrotic areas of tumors are characterized by elevated ADC values because of the decreased cell density [Citation48,Citation49]. Recent studies have demonstrated that ADC may be a potential non-invasive biomarker for monitoring and predicting response to therapy using MRI [Citation47,Citation49]. We found that M/A increased the ADC value in the tumor but did not affect the value in the contralateral hemisphere and a similar tendency was observed for Q0/A (). It may hypothesize that M/A and Q/A decreased cell density and increased water diffusion in the tumor. The effect of M/A on the ADC is consistent with published histological data obtained on M/A-treated animals [Citation50]. M/A has been found to cause a specific form of cancer cell death called autoschisis, which is characterized by a reduction in cell size due to loss of cytoplasm through self-excision without loss of cell organelles, degradation of the nucleus, and formation of apoptotic bodies [Citation50].
Conclusion
Our study proposes a pharmacological strategy for the tolerable treatment of glioblastoma using the redox-cycling ‘mitocan’ Q0/A and comparing its anticancer effects with those of widely investigated M/A. Both combination drugs significantly suppressed tumor growth compared to the untreated glioblastoma mice, which was accompanied by: (i) severe oxidative stress in the tumor but not in non-cancerous tissues; (ii) increased tumorperfusion; and (iii) down-regulation of tNOX.
Suppression of tumor growth was more pronounced in Q0/A-treated mice than in M/A-treated mice. Q0/A induced partial tumor resorption in the first days after its intracranial administration, whereas M/A induced only tumor growth arrest. However, survival of Q0/A-treated glioblastoma mice was shorter than that of M/A-treated mice. These data suggest that the rate of tumor resorption, as well as the rate of metabolism of toxic residues must be controlled and maintained within tolerable limits to achieve longer survival, especially at intracranial drug administration. In addition, the concomitant drug-induced inflammation should also be strictly controlled in the brain during anticancer therapy and localized only to the lesion to avoid morphological changes in healthy brain tissues and severe drug-related side-effects leading to serious neurological disorders.
The study shows that Q0/A and M/A are attractive candidates as adjuvants for tolerable treatment of glioblastoma. Menadione and ascorbate are natural metabolites in animals and humans. This also applies to some harmless plant-derived benzoquinones, such as coenzyme Q0, which is a precursor for synthesis of Q10. Therefore, Q0/A and M/A can be considered safe for the organism within certain concentration limits and have a potential for translational research.
Acknowledgements
The authors would like to thank Dr. Takayuki Obata (QST, Japan) for his suggestions in the interpretation of the MRI data. The participation of Dr. Raj Parajuli (QST, Japan) in the MRI measurement is gratefully acknowledged. Conception and design: R.B., Z.Z.; Development of methodology: R.B., A.S., Z.Z., Acquisition of data (provided animals, acquired and managed patients, provided facilities, etc.): A.S., S.S., R.B.; Analysis and interpretation of data (e.g. statistical analysis, biostatistics, computational analysis): R.B., Z.Z., A.S., D.L.; Writing, review, and/or revision of the manuscript: R.B., Z.Z., A.S., S.S., D.L.; Administrative, technical, or material support (i.e. reporting or organizing data, constructing databases): I.A.; Study supervision: I.A. Note: The participation of Akira Sumiyoshi and Sayaka Shibata in this study should be considered equal.
Data availability statement
The data presented in this study are available upon request from the corresponding author.
Disclosure statement
No potential conflict of interest was reported by the author(s).
Additional information
Funding
References
- Ralf SJ, Low P, Dong L, et al. Mitocans: mitochondrial targeted anti-cancer drugs as improved therapies and related patient documents. Recent Pat Anticancer Drug Discov. 2006;1(3):327–346.
- Dong L, Gopalan V, Holland O, et al. Mitocans revisited: mitochondrial targeting as efficient anti-cancer therapy. Int J Mol Sci. 2020;21:7941.
- Chen K, Lu P, Beeraka NM, et al. Mitochondrial mutations and mitoepigenetics: focus on regulation of oxidative stress-induced response in breast cancers. Semin Cancer Biol. 2022;83:556–559.
- Bakalova R, Semkova S, Ivanova D, et al. Selective targeting of cancerous mitochondria and suppression of tumor growth using redox-active treatment adjuvant. Oxid Med Cell Longev. 2020;2020:6212935.
- Sumiyoshi A, Shibata S, Zhelev Z, et al. Targeting glioblastoma via selective alteration of mitochondrial redox-state. Cancers (Basel). 2022;14(3):485.
- Ren X, Santhosh SM, Coppo L, et al. The combination of ascorbate and menadione causes cancer cell death by oxidative stress and replicative stress. Free Radic Biol Med. 2019;134:350–358.
- Verrax J, Beck R, Dejeans RB, et al. Redox-active quinones and ascorbate: an innovative cancer therapy that exploits the vulnerability of cancer cells to oxidative stress. Anticancer Agents Med Chem. 2011;11(2):213–221.
- Hseu Y-C, Tsai T-J, Korivi M, et al. Antitumor properties of coenzyme Q0 against human ovarian carcinoma cells via induction of ROS-mediated apoptosis and cytoprotective autophagy. Sci Rep. 2017;7:8062.
- Yang H-L, Tsai C-H, Shrestha S, et al. Coenzyme Q0, a novel quinone derivative of Antrodia camphorate, indices ROS-mediated cytotoxic autophagy and apoptosis against human glioblastoma cells in vitro and in vivo. Food Chem Toxicol. 2021;155:112384.
- Yang H-L, Chiu L-W, Lin Y-A, et al. In vitro and in vivo anti-tumor activity of coenzyme Q0 against TWIST1-overexpressing HNSCC cells: ROS-mediated inhibition of EMT/metastasis and autophagy/apoptosis induction. Toxicol Appl Pharmacol. 2023;116453.
- Pereyra CE, Dantas RF, Ferreira SB, et al. The diverse mechanisms and anticancer potential of naphthoquinones. Cancer Cell Int. 2019;19:207.
- Tareen B, Summers JL, Jamison JM, et al. A 12-week, open label, phase I/IIa study using apatone for the treatment of prostate cancer patients who have failed standard therapy. Int J Med Sci. 2008;5(2):62–67.
- US National Library of Medicine Home Page. Double-blinded clinical trial using Apatone-B for symptomatic postoperative total joint replacement (Apatone-B). ClinicalTrials.gov.Identifier:NCT01272830.
- Hidalgo-Gutierres A, Gonzalez-Garcia P, Diaz-Casado ME, et al. Metabolic targets of coenzyme Q10 in mitochondria. Antioxidants. 2021;10(4):520.
- Hargreaves IP. Coenzyme Q10 as a therapy for mitochondrial disease. Int J Biochem Cell Biol. 2014;49:105–111.
- Hitomi M, Yokoyama F, Kita Y, et al. Antitumor effects of vitamins K1, K2 and K3 on hepatocellular carcinoma in vitro and in vivo. Int J Oncol. 2005;26(3):713–720.
- Xu W, Wu H, Chen S, et al. Cytotoxic effects of vitamins K1, K2, and K3 against human T lymphoblastoid leukemia cells through apoptosis induction and cell cycle arrest. Chem Biol Drug Design. 2020;96(4):1134–1147.
- Yonezawa Y, Kuriyama I, Fukuoh A, et al. Inhibitory effect of coenzyme Q1 on eukaryotic DNA polymerase gamma and DNA topoisomerase II activities on the growth of a human cancer cell line. Cancer Sci. 2006;97(8):716–723.
- Nakagawa K, Hirota Y, Sawada N, et al. Identification of UBIAD1 as a novel human menaquinone-4 biosynthetic enzyme. Nature. 2010;468(7320):117–121.
- Mugoni V, Postel R, Catanzaro V, et al. UBIAD1 is an antioxidant enzyme that regulates eNOS activity by CoQ10 synthesis. Cell. 2013;152(3):504–518.
- The Human Protein Atlas. UBIAD1 Protein Expression Summary. Available from: http://www.proteinatlas.org/ENSG00000120942-UBIAD1. [accessed 2022 October 20].
- Azad A, Kong A. The therapeutic potential of imidazole or quinone-based compounds as radiosensitizers in combination with radiotherapy for the treatment of head and neck squamous cell carcinoma. Cancers (Basel). 2022;14:4694.
- Saibu M, Sagar S, Green I, et al. Evaluating the cytotoxic effects of novel quinone compounds. Anticancer Res. 2014;34(8):4077–4086.
- Li Y, Lin R, Peng X, et al. The role of mitochondrial quality control in anthracycline-induced cardiotoxicity: from bench to bedside. Oxid Med Cell Longev. 2022;2022:3659278.
- Huang J, Wu R, Chen L, et al. Understanding anthracycline cardiotoxicity from mitochondrial aspect. Front Pharmacol. 2022;13:811406.
- Sumiyoshi A, Shibata S, Zhelev Z, et al. Pharmacological strategy for selective targeting of glioblastoma by redox-active combination drug – comparison with the chemotherapeutic standard-of-care temozolomide. Anticancer Res. 2021;41(12):6067–6076.
- Femandes C, Costa A, Osorio L, et al. Chapter 11: current standard of care in glioblastoma therapy. In: D Vleeschouwer S, editor. Glioblastoma. Brisbane: Codon Publ.; 2017.
- Tatar Z, Thivat E, Planchat E, et al. Temozolomide and unusual indications: review of literature. Cancer Treat Rev. 2013;39(2):125–135.
- Bakalova R, Lazarova D, Sumiyoshi A, et al. Redox-cycling “mitocans” as effective new developments in anticancer therapy. Int J Mol Sci. 2023;24:8435.
- Tielens AGM, Rotte C, van Hellemond JJ, et al. Mitochondria as we don`t know them. Trends Biochem Sci. 2002;27:564–572.
- Collins RRJ, Patel K, Putman WC, et al. Oncometabolites: A new paradigm for oncology,: metabolism, and clinical laboratory. Clin Chem. 2017;63:1812–1820.
- Robb EL, Hall AR, Prime TA, et al. Control of mitochondrial superoxide production by reverse electron transport at complex I. J Biol Chem. 2018;239:9869–9879.
- Despotovic A, Mircic A, Misirlic-Dencic S, et al. Combination of ascorbic acid and menadione induces cytotoxic autophagy in human glioblastoma cells. Oxid Med Cell Longev. 2022;2022:2998132.
- Spindler M, Flint Beal M, Henchcliffe C. Coenzyme Q10 effects in neurodegenerative disease. Neuropsychiatr Dis Treat. 2009;5:597–610.
- Cheng H-L, Lee Y-H, Yuan T-M, et al. Update on a tumor-associated NADH oxidase in gastric cancer cell growth. World J Gastroenterol. 2016;22(10):2900–2905.
- Jiang Z, Gorenstein NM, Morré DM, et al. Molecular cloning and characterization of a candidate human growth-related and time-keeping constitutive cell surface hydroquinone (NADH) oxidase. Biochemistry. 2008;47(52):14028.
- Islam A, Hsieh P-F, Liu P-F, et al. Capsaicin exerts therapeutic effects by targeting tNOX-SIRT1 axis and augmenting ROS-dependent cytotoxic autophagy in melanoma cancer cells. Am J Cancer Res. 2021;11(9):4199–4219.
- Eilaghi A, Yeung T, d`Esterre C, et al. Quantitative perfusion and permeability biomarkers in brain cancer from tomographic CT and MR images. Biomark Cancer. 2016;8(Suppl):47–59.
- Van Dijken BRJ, Van Laar PJ, Smits M, et al. Perfusion MRI in treatment evaluation of glioblastomas: clinical relevance of current and future techniques. J Magn Reson Imaging. 2019;49(1):11–22.
- Lah TT, Novak M, Breznik B. Brain malignancies: glioblastoma and brain metastasis. Semin Cancer Biol. 2020;60:262–273.
- Couto M, Coelho-Santos V, Santos L, et al. The interplay between glioblastoma and microglial cells leads to endothelial cell monolayer dysfunction via the interleukin-6-induced JAK2/STAT3 pathway. J Cell Physiol. 2019;234(11):19750–19760.
- Zheng X, Hou Y, He H, et al. Synthetic vitamin K analogs inhibit inflammation by targeting the NLRP3 inflammasome. Cell Mol Immunol. 2021;18(10):2422–2430.
- Hseu Y-C, Tseng Y-F, Pandey S, et al. Coenzyme Q0 inhibits NLRP3 inflammasome activation through mitophagy induction in LPS/ATP-stimulated macrophages. Oxid Med Cell Longev. 2022;2022:4266214.
- Castellano A, Bailo M, Cicone F, et al. Advanced imaging techniques for radiotherapy planning of gliomas. Cancers (Basel). 2021;13(5):1063.
- Song J, Kadaba P, Kravitz A, et al. Multiparametric MRI for early identification of therapeutic response in recurrent glioblastoma treated with immune checkpoint inhibitors. Neurol Oncol. 2020;22(11):1658–1666.
- Sugahara T, Korogi Y, Kochi M, et al. Usefulness of diffusion-weighted MRI with echo-planar technique in the evaluation of cellularity in glioma. Magn Reson Imaging. 1999;9(1):53–60.
- Tourell MC, Shokoohmand A, Landgrave M, et al. The distribution of the apparent diffusion coefficient as an indicator of the response to chemotherapeutics in ovarian tumor xenografts. Sci Rep. 2017;7:42905.
- Surov A, Meyer HJ, Wienke A. Correlation between apparent diffusion coefficient (ADC) and cellularity is different in several tumors: a meta-analysis. Oncotarget. 2017;8(35):59492–9.
- Fliedner FP, Engel TB, El-Ali HH, et al. Diffusion weighted magnetic resonance imaging (DW-MRI) as a non-invasive, tissue cellularity marker to monitor cancer treatment response. BMC Cancer. 2020;20:134.
- Gilloteaux J, Jamison JM, Arnold D, et al. Ultrastructural aspects of autoschizis: a new cancer cell death induced by the synergistic action of ascorbate/menadione on human bladder carcinoma cells. Ultrastruct Pathol. 2001;25(3):183–192.