
ABSTRACT
Objective:
Obstructive sleep apnea (OSA) is associated with severity of pneumonia; however, the mechanism by which OSA promotes lung cancer progression is unclear.
Methods:
Twenty-five lung cancer patients were recruited to investigate the relationship between OSA and cancer-associated fibroblast (CAFs) activation. Lung cancer cells (A549) and WI38 fibroblast cells were used to explore the hypoxia-induced TGFβ expression using qPCR, Western blot, and ELISA. Wound healing and transwell assays were performed to evaluate cancer cell migration and invasion. A549 or A549-Luc + WI38 xenograft mouse models were established to detect the intermittent hypoxia (IH) associated with lung tumor growth and epithelial–mesenchymal transition (EMT) in vivo.
Results:
OSA promotes CAF activation and enrichment in lung cancer patients. Hypoxia (OSA-like treatment) activated TGFβ signaling in both lung cancer cells and fibroblasts, which promoted cancer cell migration and invasion, and enriched CAFs. IH promoted the progression and EMT process of lung cancer xenograft tumor. Co-inoculation of lung cancer cells and fibroblast cells could further promote lung cancer progression.
Conclusions:
IH promotes lung cancer progression by upregulating TGFβ signaling, promoting lung cancer cell migration, and increasing the CAF activation and proportion of lung tumors.
Introduction
Obstructive sleep apnea (OSA) is one of the most common respiratory disorders, which is characterized by recurrent episodes of complete or partial upper airway obstruction during sleep, associated with intermittent hypoxemia, increased inspiratory effort, and disrupted sleep [Citation1,Citation2]. Recent epidemiological surveys indicate that 14–49% of adults have clinically significant OSA in Europe and the United States [Citation3]. Obesity, type 2 diabetes, and metabolic disease are the stronger risk factors of OSA [Citation4,Citation5]. OSA prevalence is high and is rising worldwide, which may be due to the growing prevalence of obesity and overweight [Citation6]. Apnea-hypopnoea index (AHI) is used to assess the severity of OSA, which represents how many times of apneas (complete) and hypopneas (incomplete) obstructive events happen during one hour of sleep, and AHI ≥ 5 is defined as OSA [Citation7].
Experimental and clinical data suggest that OSA may be associated with higher cancer incidence, tumor aggressiveness, and cancer mortality [Citation8,Citation9]. One 22-year mortality follow-up data suggested that OSA is associated with increased cancer mortality in a community-based sample [Citation10]. Heinzer et al. performed a HypnoLaus study based on 3043 consecutive participants and found that OSA was highly prevalent, with important public health outcomes, and might be correlated with cancer incidence and mortality [Citation11]. In addition, OSA is associated with the severity of pneumonia. Chiner et al. performed a case-control study to investigate the association between community-acquired pneumonia and OSA. In comparison with patients with non-respiratory infections, OSA is closely associated with the severity of community-acquired pneumonia [Citation12].
Cancer-associated fibroblasts (CAFs) are activated fibroblasts with significant plasticity and heterogeneity in the tumor microenvironment [Citation13]. CAFs proliferation and expansion enhance extracellular matrix (ECM) remodeling and growth factor production, and then promote tumor growth, metastasis, and progression [Citation14]. OSA is associated with the severity of pneumonia; however, the mechanism by which OSA promotes lung cancer progression is unclear. Using clinical sample analysis, in vitro experiments, and tumor models, this study found that OSA promoted lung cancer progression by upregulating TGFβ signaling, promoting lung cancer cell migration, and increasing the CAF activation and proportion lung tumors.
Materials and methods
Patient samples
Lung cancer tissues were collected from 25 lung adenocarcinoma patients, among them 14 patients had OSA (OSA, n = 14) and 11 patients without OSA (WO, n = 11). OSA was defined as the presence of an AHI of ≥5 events/h [Citation15]. The surgically excised tumor samples were prepared as protein samples and paraffin samples for Western blot and immunohistochemistry (IHC) analysis, respectively. OSA was diagnosed by using respiratory polygraphy and visually scoring the electroencephalography and electrooculography by a physician with the polysomnography device. All the participants obtained informed consent, and this study was approved by the ethics committee of Xinhua Hospital Affiliated to Shanghai Jiao Tong University School of Medicine.
Cell lines and cell culture
Human lung adenocarcinoma cell line (A549), A549-Luciferase (A549-Luc) cells, and human fibroblast cell line (WI38) were purchased from ATCC (Manassas, USA). A549 cells were cultured in F-12 K Medium with 10% fetal bovine serum (FBS, Gibco), and WI38 cells were cultured in Eagle's Minimum Essential Medium with 10% FBS. Cells were placed in an incubator at 37°C with 95% air and 5% CO2.
Hypoxic treatment in vitro
The in vitro hypoxic treatment was performed by using Hypoxia Workstation Invivo2 400 chamber (Ruskinn Technology Ltd, Bridgend, UK) as described previously [Citation16]. Briefly, A549 cells were seeded in a complete medium in the density of 1 × 10⁶ cells/ml and placed in a hypoxia chamber (0.1% O2 with 5% CO2) for 24 h. After incubation, cells and medium were harvested for the following analysis.
Wound healing and transwell invasion assays
To detect the cell migration, 5 × 10⁶ cells were seeded in 6-well plates. The cell monolayer was scratched a 1 mm wide crack using a sterile tip (200 µl) when cells reached 85% of confluence. Cell migration was monitored by using a microscope every day to calculate wound healing. The BD transwell chamber (BD, Franklin, TN, USA) was used to detect cell migration and invasiveness as described previously [Citation17]. The migrated cells were stained with crystal violet and imaged using an Olympus microscope.
Subcutaneous xenograft mouse model and intermittent hypoxic (IH) treatment
Eight-week-old BALB/c nude mice were obtained from Laboratory Animal Center (Shanghai, China). Mice were randomly divided into two groups (n = 10 per group). 1 × 10⁶ A549 cells or A549-Luc + WI38 mixed cells (A549-Luc: WI38 = 1:3) were implanted subcutaneously into the flanks of BALB/c nude mice. Half of the transplanted mice of each group were exposed to IH in a plexiglas chamber for 6 h per day, as described previously [Citation18]. Oxygen concentration was monitored using a CY-12C O2 analyzer (Chizhou, China). In the hypoxia phase, the oxygen concentration was decreased to 5% by infusion of nitrogen, and mice were maintained in this condition for 30 s. In the post-hypoxic re-oxygenation phase, the oxygen concentration was increased to 21% by infusion of clean air, and mice were maintained in this condition for 60 s. One hundred and sixty IH cycles were run each day, and mice were exposed to IH until day 20. Control mice were maintained in clean air without IH cycles. Bioluminescence imaging (BLI) was performed using the Xenogeny-IVIS imaging system (Perkin Elmer, Waltham, MA, USA), and all mice were imaged every 5 days after the transplantation. Tumor volume was calculated using the following formula: V = 0.5×a × b2 (a: length of the tumor; b: short diameter of the tumor). Animal experimental protocols were approved by the Animal Care and Use Committee at Xinhua Hospital Affiliated to Shanghai Jiao Tong University School of Medicine.
Immunoblotting
Cells or tissues were homogenized and lysed by whole cell extraction buffer that includes 10% glycerol, 2% sodium dodecylsulfate, and 62.5 mM Tris-HCl (pH 7.0). Protein concentrations were determined usinga BCA protein assay kit (Thermo Fisher Scientific Inc., Waltham, MA, USA). The final protein concentration was normalized to 3 µg/µl and all samples were denatured in 3× SDS loading buffer (Thermo Fisher Scientific Inc., Waltham, MA, USA) at 96°C for 5 min. Each sample was loaded at 12 µl/well into 12% Bis-Tris gels and proteins were separated at 80–100 volts for 90 min. Protein samples were then transferred to PVDF membranes (Sigma–Aldrich, St. Louis, MO, USA) for 120 min at 100 volts. Membranes were blocked in 5% Gibco skim milk (Thermo Fisher Scientific Inc., Waltham, MA, USA) in TBST buffer for 2 h at RT, then incubated with the primary antibodies overnight at 4°C. The following day, membranes were washed in TBST (3×) and then placed in second antibodies (1:5000) for 1–2 h at RT. The blots were washed 3 times by TBST buffer and placed ECL detection solution (Thermo Fisher Scientific Inc., Waltham, MA, USA), and then imaged using ImageQuant biomolecular imager and target bands were quantified by Image J. Antibodies included the antibodies against GAPDH (CST), p-SMAD2 (CST), SMAD2 (CST), E-Cadherin (CST), N-Cadherin (CST), Fibronectin (Abcam), α-SMA (Abcam), FAP (Abcam).
Real-time quantitative reverse transcription PCR (qRT-PCR)
Total RNA was isolated by using Trizol (Invitrogen, Waltham, MA, USA) and then incubated by DNase (Thermo Fisher Scientific Inc., Waltham, MA, USA) to remove single- and double-stranded DNA. The cDNA was synthesized using PrimeScript 1st strand cDNA Synthesis Kit (Takara Bio, Kusatsu, Japan) and cDNA samples were diluted 1:10 with double-distilled water. qRT-PCR was performed by using Applied Biosystems™ StepOne™ Real-Time PCR System, and GAPDH was used as the internal control to normalize the fold change of the target gene. Sequences of qPCR primers are listed in the .
Table 1. Primers used in this study.
Immunohistochemistry (IHC)
Lung tissues were prepared with formalin-fixed, and paraffin-embedded techniques. IHC staining and scoring were performed as previously described [Citation19]. Slides were incubated with the primary antibody anti-α-SMA (Abcam, ab230458, 1:1000) or anti-Collagen type 1 (Proteintech, 67288-1-Ig, 1:1000) and second antibody. After antibody incubation, slides were incubated with DAPI and mounted with a mounting medium. Images were taken using an Olympus microscope and analyzed by Image-Pro Plus 6.0 software.
Enzyme-linked immunosorbent assay (ELISA)
Cells were harvested and lysed by the lysis buffer provided in the ELISA kit (#DY240, R&D Systems, Inc., Minneapolis, USA), then were centrifuged at 12000rpm for getting supernatant. The culture medium was also harvested and centrifuged at 12000rpm for getting supernatant and determining the TGFβ1 level by ELISA. The protein concentration of TGFβ1 was determined by Human TGF-beta 1 DuoSet ELISA kit (#DY240, R&D Systems, Inc., Minneapolis, USA) following the manufacturer’s instructions. The absorbance at 450 nm was measured by using an Infinite M1000 microplate reader (Tecan, Männedorf, Switzerland).
Statistical analysis
All statistical analyses in this study were carried out by using Prism 8.0 (GraphPad). The significance between the two column groups was analyzed by T-test if the data was normal distribution in the normalcy test or by Mann Whitney test (non-parametric test) if the data was not normal distribution. The significance between the two curves was analyzed by a two-way ANOVA test. The error bar represents the mean ± standard deviation (SD).
Results
CAFs are enriched in tumor of lung adenocarcinoma patients with OSA
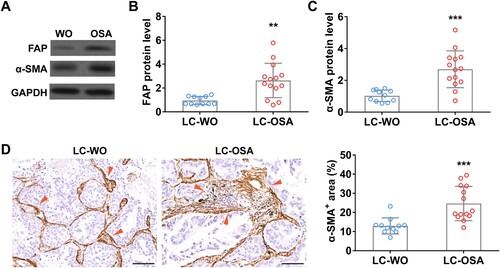
To explore the relationship between OSA and lung adenocarcinoma, first, we detected the enrichment of cancer-associated fibroblasts, a key promoter of tumor growth [Citation13], in lung adenocarcinoma patients with (LC-OSA, n = 14) and without OSA (LC-WO, n = 11). Western blot data showed that two traditional CAFs biomarkers, FAP and α-SMA, were significantly increased in lung adenocarcinoma patients with OSA ((A–C)). We further performed IHC staining of α-SMA using lung tissue sections from LC-OSA and LC-WO patients and observed a remarkable increase of α-SMA positive area in LC-OSA patients ((D)). These results suggested that OSA might promote CAF proliferation and expansion in lung adenocarcinoma.
Figure 1. Cancer-associated fibroblasts are enriched in tumor of lung adenocarcinoma patients with OSA. The protein level of FAP (A and B) and α-SMA (A and C) in tumors from lung adenocarcinoma patients with OSA (n = 14) or without OSA (WO, n = 11). (D) The area percentage of cancer-associated fibroblast (α-SMA+) (indicated by red arrows) in tumors from lung adenocarcinoma patients with (OSA, n = 14) or without OSA (WO, n = 11).
Hypoxia upregulates TGFβ1 expression and promotes lung cancer cells progression in vitro
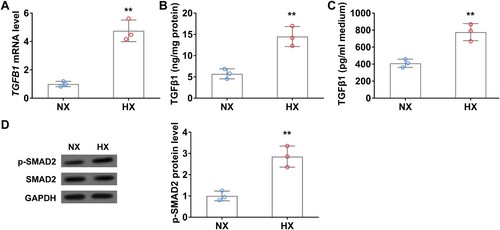
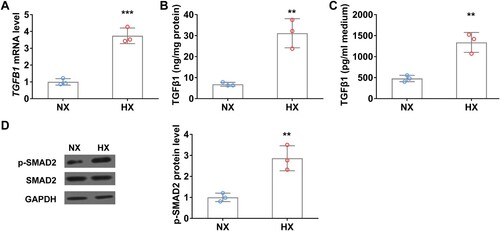
TGFβ1 is the key regulator that activates and promotes CAF proliferation [Citation20]. To investigate whether TGFβ1 expression is altered during hypoxia, we detected TGFβ1 mRNA and protein levels in A549 cells with or without hypoxic treatment. As shown in (A), in comparison with normoxia control, TGFβ1 mRNA level was significantly increased in A549 cells after 24 h of hypoxia, accordingly, TGFβ1 protein level also remarkedly elevated in cell lysate ((B)). Interestingly, ELISA data showed that secreted TGFβ1 in the conditional medium of A549 cells was significantly increased after 24 h of hypoxic treatment ((C)). Moreover, the expression of CAFs biomarkers, FAP and α-SMA, was also significantly elevated in hypoxia treated A549 cells compared to those in normoxic conditions ((D)).
Figure 2. Hypoxia upregulates TGFβ1 levels in lung cancer cells in vitro. (A) The mRNA level of TGFβ1 in A549 cells under normoxia (NX) and hypoxia (HX) conditions for 24 h. B–C, The protein level of TGFβ1 in cell body (B) and culture medium (C) of A549 cells under normoxia (NX) and hypoxia (HX) condition for 24 h. (D) The protein level of p-SMAD2 in A549 cells under normoxia (NX) and hypoxia (HX) conditions for 24 h. n = 3 wells.
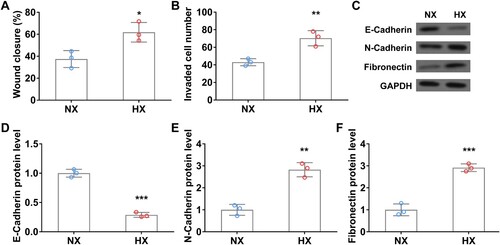
Next, we investigated the tumor migration and invasion of A549 cells using wound healing and transwell invasion assays. Upon 24 h of hypoxic treatment, the wound closure rate of lung cancer cells was significantly higher than that in normoxia ((A)). Transwell assay results are consistent with the above data, hypoxia remarkedly promoted A549 cell invasion relative to that in normoxia ((B)). Moreover, the protein levels of N-Cadherin and fibronectin, both promote epithelial–mesenchymal transition (EMT) transition in tumor progression [Citation21,Citation22], were significantly increased in hypoxia-treated lung cancer cells ((C, E, F)). In contrast, the expression of E-Cadherin, a tumor suppressor protein that can inhibit EMT transition [Citation23], was significantly decreased in A549 cells after 24 h of hypoxic treatment ((C and D)). The above data indicated that hypoxia upregulates TGFβ1 expression and promotes lung cancer cell migration, invasion, and EMT.
Figure 3. Hypoxia promotes the migration and invasion of A549 cells in vitro. Wound closure rate (A) and cell invasion number (B) of A549 cells in wound healing assay and transwell invasion assay under normoxia (NX) and hypoxia (HX) conditions for the first 24 h. C–F, The protein level of EMT-related protein E-Cadherin (C and D), N-Cadherin (C and E), and Fibronectin (C and F) in A549 cells under normoxia (NX) and hypoxia (HX) condition for 24 h. n = 3 wells.
Hypoxia induces fibroblast activation in vitro
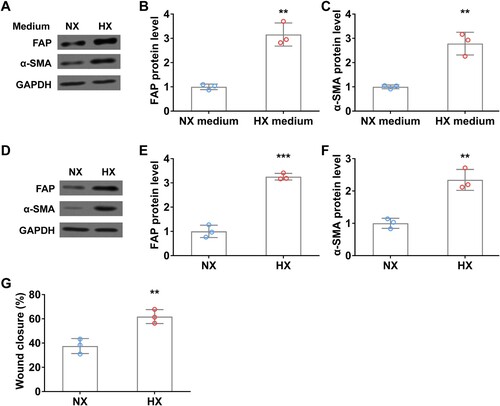
To explore the interaction between lung cancer cells and fibroblast cells under normoxia and hypoxia conditions, we treated WI38 cells by using a conditional medium derived from A549 cells with or without hypoxia, and then examined the activation of CAF makers. After 24 h of hypoxia (HX) conditional medium treatment, FAP and α-SMA protein levels were significantly increased in fibroblast cells compared to those in normoxia (NX) medium ((A–C)). Interestingly, similar promoting effects on FAP and α-SMA expression were observed after the hypoxic treatment of WI38 cells ((D–F)). Moreover, upon hypoxia treatment, the wound closure rate of fibroblast cells was remarkedly elevated compared to that in normoxia condition ((G)). These results indicated that hypoxic lung cancer cell secretions (such as TGFβ) or direct hypoxia can induce fibroblast activation.
Figure 4. Hypoxia induces fibroblast activation in vitro. (A–C) WI38 fibroblast cells were treated with conditioned A549 culture medium under normoxia (NX) and hypoxia (HX) conditions for 24 h, then were harvested for analyzing the protein levels of FAP (A and B) and α-SMA (A and C) by Western blot. (D-F) The protein level of FAP (D and E) and α-SMA (D and F) in WI38 cells under normoxia (NX) and hypoxia (HX) conditions for 24 h. G, Wound closure rate of WI38 cells in wound healing assay under normoxia (NX) and hypoxia (HX) condition for the first 24 h. n = 3 wells.
Hypoxia upregulates TGFβ1 level in WI38 fibroblast cells in vitro
Hypoxia induces TGFβ1 expression and promotes fibroblast activation, next, we ask if hypoxia can alter fibroblast cells status directly. To this end, WI38 cells were exposed under normoxia or hypoxia conditions for 24 h and then TGFβ1 mRNA and protein levels were analyzed using qRT-PCR and ELISA. Hypoxia significantly increased TGFβ1 mRNA level compared to that in normoxia condition ((A)). Accordingly, TGFβ1 protein levels in both cell body and culture medium were remarkedly elevated after hypoxic treatment ((B and C)). Moreover, the phosphorylation level of SMAD2, the downstream effector of the TGFβ signaling pathway was significantly increased in WI38 cells under hypoxia conditions ((D)).
Figure 5. Hypoxia upregulates TGFβ1 level in WI38 fibroblast cells in vitro. (A) The mRNA level of TGFβ1 in WI38 cells under normoxia (NX) and hypoxia (HX) conditions for 24 h. (B–C) The protein level of TGFβ1 in cell body (B) and culture medium (C) of WI38 cells under normoxia (NX) and hypoxia (HX) conditions for 24 h. (D) The protein level of p-SMAD2 in WI38 cells under normoxia (NX) and hypoxia (HX) conditions for 24 h. n = 3 wells.
IH promotes the progression and EMT process of lung cancer in vivo
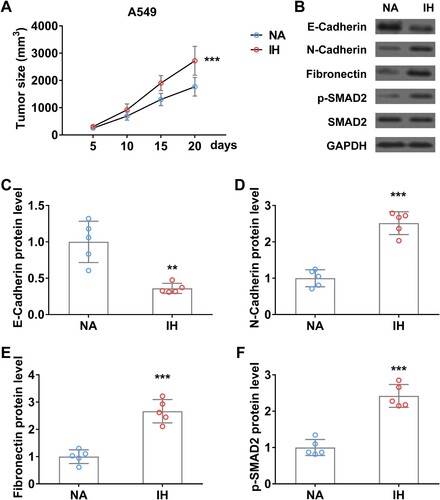
To further investigate the role of IH on lung cancer progression and EMT transition, we established a xenograft tumor mouse model using A549 cells and then performed IH treatment. Tumor volume was monitored every 5 days. As shown in (A), the A549 xenograft tumor size in IH-treated mice was significantly bigger than that in control mice. Western blot analysis indicated that EMT makers (N-Cadherin, Fibronectin) and TGFβ signaling (p-SMAD2) were remarkedly increased in xenograft tumor of mice under hypoxia, conversely, C-Cadherin protein level was significantly reduced in xenograft tumor after hypoxic treatment ((B–F)).
Figure 6. Intermittent hypoxia promotes the progression and EMT process of lung cancer xenograft tumor in mice. (A) Tumor size of A549 xenograft tumor on mice in normal air (NA) or treated with intermittent hypoxia (IH). (B–F) The protein level of E-Cadherin (B and C), N-Cadherin (B and D), fibronectin (B and E), and p-SMAD2 (B and F) in tumor from mice in normal air (NA) or treated with intermittent hypoxia (IH) on day 20. n = 5 mice.
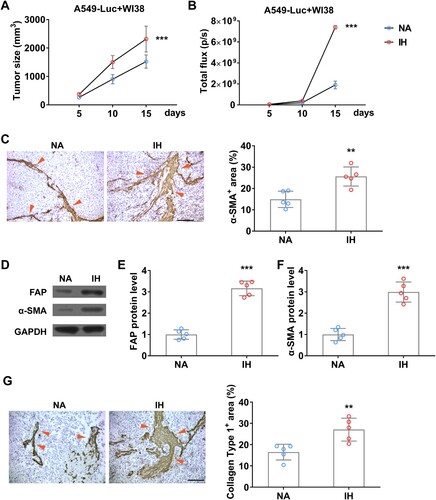
To explore whether hypoxia can increase the abundance of fibroblast in tumors in vivo, we established a xenograft tumor mouse model by inoculating A549-Luc and WI38 cells together ((A)). To detect the burden of A549 and avoid the interference of WI38, we used BLI to detect the amount of A549 in the tumor, the result showed that IH indeed accelerated tumor growth significantly ((B)). Moreover, IHC data indicated that IH further promotes CAFs formation ((C)), and the expression levels of CAFs markers, FAP and α-SMA, are also increased remarkedly ((D–F)), and fibrogenesis indicated by a high level of Collagen type 1 ((G)). All these data indicated that IH promotes the proliferation and activation of tumor CAFs in vivo.
Figure 7. Intermittent hypoxia promotes the growth of fibroblasts in lung cancer xenograft tumor in mice. (A) Tumor size of co-inoculation of A549-Luc and WI38 fibroblast cells (1: 3) on mice in normal air (NA) or treated with intermittent hypoxia (IH). (B) The tumor burden of A549-Luc was determined by BLI. (C) The enrichment of fibroblast in co-inoculation tumors was determined by IHC on α-SMA (indicated by red arrows) on day 15. (D-F) The protein level of FAP (D and E) and α-SMA (D and F) in co-inoculation tumor from mice in normal air (NA) or treated with intermittent hypoxia (IH) on day 15. (G) The fibrogenesis in co-inoculation tumors was determined by IHC on Collagen type 1 (indicated by red arrows) on day 15. n = 5 mice.
Discussion
The prevalence of OSA is increasing worldwide due to the continuously growing of overweight and obese individuals [Citation4,Citation5]. Patients with OSA have a higher risk of developing cardiovascular diseases, heart failure, strokes, and cancer [Citation24]. Recent epidemiological studies showed that OSA is associated with higher cancer incidence, tumor aggressiveness, and cancer mortality [Citation10,Citation11]. Although OSA has been reported to be associated with the severity of pneumonia [Citation12], the mechanism by which OSA promotes lung cancer progression is unclear. Here, we demonstrated that OSA can promote CAF activation and enrichment in patients with lung adenocarcinoma. Using an in vitro hypoxia analysis and in vivo intermittent hypoxia mouse model, we revealed that OSA promotes lung cancer progression by upregulating TGFβ signaling, promoting migration of lung cancer cells and activation of CAFs, and increasing the proportion of CAFs in lung tumor.
Dysfunction of TGFβ signaling promotes the formation of a pro-fibrotic environment by acting on fibroblasts, immune cells, and epithelial cells, finally causing fibrotic diseases, expansion of CAFs, and cancer metastasis [Citation25]. Accumulative evidence indicated that TGFβ signaling promotes tumor microenvironment and induces EMT in lung cancer [Citation26,Citation27]. In the current study, we observed significant upregulation of TGFβ and downstream signaling pathways after hypoxia or intermittent hypoxia (OSA-like treatment) in vitro and in vivo. Moreover, upon hypoxic condition, elevated TGFβ signaling remarkedly promotes CAF enrichment, lung cancer cell migration and invasion, and tumor growth. Accordingly, lung adenocarcinoma patients who had OSA symptoms had more severe CAF enrichment. Our findings reveal that OSA promotes tumor-prone lung microenvironment by the activation of the TGFβ signaling pathway and then leads to lung cancer metastasis and progression. Hanna et al. demonstrated that hypoxia-inducible factors (HIF-αs) can interact with TGFβ signaling and then promote glomerular fibrogenesis and blocking HIF-αs decrease TGFβ1-stimulated type I collagen expression [Citation28]. In clear cell renal cell carcinoma, HIF-αs interact with the TGFβ1 receptor to induce poor prognosis in patients [Citation29]. The next interesting question we want to address is whether HIF-αs are involved in TGFβ signaling activation and CAF enrichment in lung cancer.
Both TGFβ signaling activation and CAF expansion can significantly reprogram the tumor microenvironment [Citation30]. Hypoxia-induced TGFβ elevation promoted migration and invasion of lung cancer cells (A549 cells), which also induced the activation of fibroblasts (WI38) through the paracrine effect. Interestingly, hypoxia can stimulate TGFβ upregulation in fibroblasts directly and then promote fibroblast activation. These data suggest that hypoxia has dual tumor-promoting effects via autocrine effect and paracrine effect. Tumor microenvironment remodeling during cancer progression involves many types of cells, such as microphages, T cells, CAFs, and extracellular matrix [Citation31,Citation32].
By integrating human specimens and in vivo experimentation with cell lines, our study reveals a critical pathophysiological link between OSA and the progression of lung cancer. By the activation of CAFs mediated by IH, we demonstrate that OSA significantly upregulates the TGFβ signaling pathway. This molecular cascade, observed in both lung cancer cells and fibroblasts, not only fosters cancer cell migration and invasion but also potentiates the enrichment of CAFs within the tumor microenvironment. Notably, our in vivo xenograft models underscore the profound impact of IH on promoting epithelial–mesenchymal transition (EMT) and accelerating lung tumor growth, and collagen type 1 accumulation shows the increase of fibrogenesis in tumor induced by IH. This multifaceted evidence not only highlights the mechanistic significance of TGFβ activation in OSA-driven lung cancer progression but also emphasizes the critical role of CAFs in this process and underscores the potential therapeutic importance of targeting TGFβ signaling and CAFs for combating OSA-associated lung cancer advancement. It will be very interesting to explore the role and alteration of other cells, such as immune cells, in OSA or intermittent hypoxia-promoted lung cancer progression.
OSA and IH promote lung cancer progression by upregulating TGFβ signaling, promoting lung cancer cell migration, and increasing the CAF activation and proportion of lung tumors.
Disclosure statement
No potential conflict of interest was reported by the author(s).
Data availability statement
The datasets used and/or analyzed during the current study are available from the corresponding author on reasonable request.
Additional information
Funding
References
- Greenstone M, Hack M. Obstructive sleep apnoea. Br Med J. 2014;348:g3745–g3745. Epub 2014/06/19. doi:10.1136/bmj.g3745
- Levy P, Kohler M, McNicholas WT, et al. Obstructive sleep apnoea syndrome. Nat Rev Dis Primers. 2015;1:15015, Epub 2015/01/01. doi:10.1038/nrdp.2015.15
- Garvey JF, Pengo MF, Drakatos P, et al. Epidemiological aspects of obstructive sleep apnea. J Thorac Dis. 2015;7:920–929. Epub 2015/06/24.
- Kent BD, Grote L, Ryan S, et al. Diabetes mellitus prevalence and control in sleep-disordered breathing: the European sleep apnea cohort (ESADA) study. Chest. 2014;146:982–990. Epub 2014/05/17. doi:10.1378/chest.13-2403
- Jehan S, Zizi F, Pandi-Perumal SR, et al. Obstructive sleep apnea and obesity: implications for public health. Sleep Med Disord. 2017;1:00019.
- Peppard PE, Young T, Barnet JH, et al. Increased prevalence of sleep-disordered breathing in adults. Am J Epidemiol. 2013;177:1006–1014. Epub 2013/04/17. doi:10.1093/aje/kws342
- Young T, Palta M, Dempsey J, et al. The occurrence of sleep-disordered breathing among middle-aged adults. N Engl J Med. 1993;328:1230–1235. Epub 1993/04/29. doi:10.1056/NEJM199304293281704
- Martinez-Garcia MA, Campos-Rodriguez F, Barbe F. Cancer and OSA: current evidence from human studies. Chest. 2016;150:451–463. Epub 2016/05/11. doi:10.1016/j.chest.2016.04.029
- Almendros I, Martinez-Garcia MA, Farre R, et al. Obesity, sleep apnea, and cancer. Int J Obes (Lond). 2020;44:1653–1667. Epub 2020/02/20. doi:10.1038/s41366-020-0549-z
- Nieto FJ, Peppard PE, Young T, et al. Sleep-disordered breathing and cancer mortality: results from the Wisconsin sleep cohort study. Am J Respir Crit Care Med. 2012;186:190–194. Epub 2012/05/23. doi:10.1164/rccm.201201-0130OC
- Heinzer R, Vat S, Marques-Vidal P, et al. Prevalence of sleep-disordered breathing in the general population: the HypnoLaus study. Lancet Respir Med. 2015;3:310–318. Epub 2015/02/16. doi:10.1016/S2213-2600(15)00043-0
- Chiner E, Llombart M, Valls J, et al. Association between obstructive sleep apnea and community-acquired pneumonia. PLoS One. 2016;11:e0152749, Epub 2016/04/07. doi:10.1371/journal.pone.0152749
- Ping Q, Yan R, Cheng X, et al. Cancer-associated fibroblasts: overview, progress, challenges, and directions. Cancer Gene Ther. 2021;28:984–999. Epub 2021/03/14. doi:10.1038/s41417-021-00318-4
- Biffi G, Tuveson DA. Diversity and biology of cancer-associated fibroblasts. Physiol Rev. 2021;101:147–176. Epub 2020/05/30. doi:10.1152/physrev.00048.2019
- Asghari A, Mohammadi F. Is apnea-hypopnea index a proper measure for obstructive sleep apnea severity? Med J Islam Repub Iran. 2013;27:161–162. Epub 2014/05/03.
- Hughes AL, Todd BL, Espenshade PJ. SREBP pathway responds to sterols and functions as an oxygen sensor in fission yeast. Cell. 2005;120:831–842. Epub 2005/03/31. doi:10.1016/j.cell.2005.01.012
- You J, Li J, Ke C, et al. Oncogenic long intervening noncoding RNA Linc00284 promotes c-Met expression by sponging miR-27a in colorectal cancer. Oncogene. 2021;40:4151–4166. Epub 2021/05/30. doi:10.1038/s41388-021-01839-w
- He Q, Yang QC, Zhou Q, et al. Effects of varying degrees of intermittent hypoxia on proinflammatory cytokines and adipokines in rats and 3T3-L1 adipocytes. PLoS One. 2014;9:e86326, Epub 2014/01/28. doi:10.1371/journal.pone.0086326
- Luo X, Fan S, Huang W, et al. Downregulation of IRS-1 promotes metastasis of head and neck squamous cell carcinoma. Oncol Rep. 2012;28:659–667. Epub 2012/06/06. doi:10.3892/or.2012.1846
- Jena B C, Sarkar S, Rout L, et al. The transformation of cancer-associated fibroblasts: current perspectives on the role of TGF-β in CAF mediated tumor progression and therapeutic resistance. Cancer Lett. 2021;520:222–232. Epub 2021/08/08. doi:10.1016/j.canlet.2021.08.002
- Loh CY, Chai JY, Tang TF, et al. The E-cadherin and N-cadherin switch in epithelial-to-mesenchymal transition: signaling,: therapeutic implications, and challenges. Cells. 2019;8:1118.
- Park J, Schwarzbauer JE. Mammary epithelial cell interactions with fibronectin stimulate epithelial-mesenchymal transition. Oncogene. 2014;33:1649–1657. Epub 2013/04/30. doi:10.1038/onc.2013.118
- Na TY, Schecterson L, Mendonsa AM, et al. The functional activity of E-cadherin controls tumor cell metastasis at multiple steps. Proc Natl Acad Sci U S A. 2020;117:5931–5937. Epub 2020/03/05. doi:10.1073/pnas.1918167117
- Bonsignore MR, Baiamonte P, Mazzuca E, et al. Obstructive sleep apnea and comorbidities: a dangerous liaison. Multidiscip Respir Med. 2019;14(8):8.
- Shi X, Young CD, Zhou H, et al. Transforming growth factor-beta signaling in fibrotic diseases and cancer-associated fibroblasts. Biomolecules. 2020;10:1666.
- Herriges M, Morrisey EE. Lung development: orchestrating the generation and regeneration of a complex organ. Development. 2014;141:502–513. Epub 2014/01/23. doi:10.1242/dev.098186
- Bragg AD, Moses HL, Serra R. Signaling to the epithelium is not sufficient to mediate all of the effects of transforming growth factor β and bone morphogenetic protein 4 on murine embryonic lung development. Mech Dev. 2001;109:13–26. Epub 2001/10/26. doi:10.1016/S0925-4773(01)00508-1
- Hanna C, Hubchak SC, Liang X, et al. Hypoxia-inducible factor-2α and TGF-β signaling interact to promote normoxic glomerular fibrogenesis. Am J Physiol Renal Physiol. 2013;305:F1323–F1331. Epub 2013/08/16. doi:10.1152/ajprenal.00155.2013
- Mallikarjuna P, Raviprakash TS, Aripaka K, et al. Interactions between TGF-β type I receptor and hypoxia-inducible factor-α mediates a synergistic crosstalk leading to poor prognosis for patients with clear cell renal cell carcinoma. Cell Cycle. 2019;18:2141–2156. Epub 2019/07/25. doi:10.1080/15384101.2019.1642069
- Pickup M, Novitskiy S, Moses HL. The roles of TGFβ in the tumour microenvironment. Nat Rev Cancer. 2013;13:788–799. Epub 2013/10/18. doi:10.1038/nrc3603
- Chen Q, Liu G, Liu S, et al. Remodeling the tumor microenvironment with emerging nanotherapeutics. Trends Pharmacol Sci. 2018;39:59–74. Epub 2017/11/21. doi:10.1016/j.tips.2017.10.009
- Papageorgis P, Stylianopoulos T. Role of TGFβ in regulation of the tumor microenvironment and drug delivery (review). Int J Oncol. 2015;46:933–943. Epub 2015/01/13. doi:10.3892/ijo.2015.2816